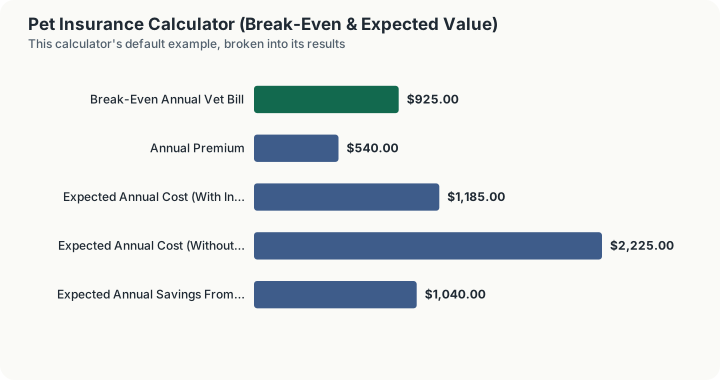
Quick Answer: A $45/month policy with a $250 deductible and 80% reimbursement breaks even at $925 in annual vet bills. Weighted across a low/moderate/high illness-and-injury scenario set, the expected annual cost with insurance is $1,185 versus $2,225 without it, an expected savings of $1,040 a year.
Overview
Pet insurance reimburses a share of eligible vet bills after you meet a deductible, in exchange for a fixed monthly premium. Unlike human health insurance, it is almost always a reimbursement model: you pay the vet directly, submit a claim, and the insurer reimburses you afterward according to the policy's deductible and reimbursement percentage. The industry has grown quickly, with the North American Pet Health Insurance Association (NAPHIA) reporting the market surpassed $5.2 billion in written premium in 2024, and average annual premiums for accident-and-illness plans running roughly $749 for dogs and $386 for cats that same year.
Whether a policy is worth it depends on two separate questions this calculator answers directly. First: at what point does the policy "pay for itself" in a given year? That is the break-even vet bill, the annual spend at which your reimbursements equal what you paid in premiums. Second: on average, across a realistic range of outcomes, does insurance save money? That requires weighing the low-probability, high-cost scenarios (a torn ligament, cancer treatment, emergency surgery) against the high-probability, low-cost scenarios (a healthy year with only routine visits), which is what the expected-value section does.
How This Is Calculated
Break-even vet bill. Annual premium is compared against reimbursement, which only kicks in above the deductible.
This is the total annual vet bill at which your reimbursement checks exactly equal the premiums you paid that year. Below this bill amount, you paid more in premium than you got back; above it, the policy nets you money for the year.
Expected value across scenarios. For each illness/injury probability scenario (low, moderate, high), the calculator computes your net cost with insurance (premium plus any out-of-pocket deductible and unreimbursed share) and without insurance (the full vet bill), then weights each by its probability:
This is a simple weighted-expected-value calculation using illustrative probability bands, not a full actuarial model built on breed-, age-, and region-adjusted incidence tables, which is what an actual insurer's pricing actuaries use.
Worked Example
Using the calculator's default inputs:
- Monthly Premium: $45 ($540/year)
- Annual Deductible: $250
- Reimbursement: 80%
Step 1 -- The annual premium. $45 x 12 = $540.00
Step 2 -- Gross up the premium by the reimbursement rate. $540.00 / 0.80 = $675.00
Step 3 -- Add the deductible, which is never reimbursed. $250.00 + $675.00 = $925.00
Above $925 of annual vet bills the policy returns more than it cost; below it, the premium was the larger number. Note step 2: because only 80 cents of each dollar above the deductible comes back, the bill has to exceed the premium by a quarter before the policy is even.
Expected value, across three illustrative scenarios:
| Scenario | Probability | Avg. Vet Bill | Net Cost (Insured) | Net Cost (Uninsured) |
|---|---|---|---|---|
| Low risk (routine only) | 50% | $300 | $800 | $300 |
| Moderate (one illness/injury) | 35% | $2,500 | $1,240 | $2,500 |
| High (major illness/surgery) | 15% | $8,000 | $2,340 | $8,000 |
Step 4 -- The low-risk row, insured. The $300 bill is above the $250 deductible, so out of pocket is $250.00 + ($50 x 20%) = $260.00, and adding the premium gives $540.00 + $260.00 = $800.00
Step 5 -- The moderate row, insured. $250.00 + ($2,250 x 20%) = $700.00 of out of pocket, plus the premium = $1,240.00
Step 6 -- The high row, insured. $250.00 + ($7,750 x 20%) = $1,800.00, plus the premium = $2,340.00
Step 7 -- Weight the insured outcomes. (0.50 x $800.00) + (0.35 x $1,240.00) + (0.15 x $2,340.00) = $400.00 + $434.00 + $351.00 = $1,185.00
Step 8 -- Weight the uninsured outcomes. (0.50 x $300.00) + (0.35 x $2,500.00) + (0.15 x $8,000.00) = $150.00 + $875.00 + $1,200.00 = $2,225.00
Step 9 -- Expected annual saving. $2,225.00 - $1,185.00 = $1,040.00
Look at where the saving comes from. In step 8 the 15% scenario alone contributes $1,200 of the $2,225, more than the other two combined, while in step 7 the same scenario contributes $351. Insurance wins here on the tail, not on the routine year, and in the routine year it loses $500.00 outright.
Policy design moves the answer in ways the monthly premium alone will not show:
Step 10 -- A richer policy: $100 deductible, 90% reimbursement, same $45 premium. Break-even falls to $100.00 + ($540.00 / 0.90) = $700.00, expected insured cost falls to $852.50, and the expected saving rises to $1,372.50
Step 11 -- A budget policy: $25 a month, $500 deductible, 70% reimbursement. Annual premium $300.00, but break-even is $500.00 + ($300.00 / 0.70) = $928.57, slightly worse than the $925.00 of the default policy despite costing $240 a year less
Step 12 -- What that budget policy is worth on the same scenarios. Expected insured cost $1,247.50 and an expected saving of $977.50, the weakest of the three
Step 11 is the useful one. The cheap policy has almost the same break-even as the standard one, because the deductible and the reimbursement share give back everything the lower premium saved. Comparing pet policies on the monthly figure alone is the single easiest way to buy the worst of the three.
Reading the Scenarios Honestly
The default 50/35/15 probability split and the $300/$2,500/$8,000 bill amounts are illustrative planning bands, not a veterinary actuarial table for your specific pet. Actual illness and injury probability varies enormously by species, breed, age, and pre-existing conditions. A young, healthy mixed-breed dog skews toward the low-risk scenario far more than 50% of the time; a senior large-breed dog or a breed prone to hereditary conditions skews toward the moderate and high scenarios more than shown here. Treat the expected-value output as a framework for thinking about the trade-off, not a personalized risk assessment.
What This Does Not Account For
- Breed- and age-adjusted risk. This calculator uses one illustrative probability set for every pet. A senior pet or a breed with known hereditary conditions carries meaningfully higher real-world claim probability than these default bands assume.
- Pre-existing condition exclusions. Virtually all pet insurers exclude pre-existing conditions from coverage; this calculator assumes every dollar of the modeled vet bill is an eligible, coverable expense.
- Premium increases with age. Most insurers raise premiums as a pet ages, sometimes substantially by their senior years. This calculator models a single, static premium rather than a lifetime cost curve.
- Wellness/routine-care riders. Some policies offer an optional add-on for routine care (vaccines, annual exams); this calculator models a standard accident-and-illness policy without that rider.
- Multi-year deductible resets. Deductibles reset annually (or sometimes per-incident on some legacy plans); this calculator computes a single policy year, not a multi-year cumulative comparison.
Common Pitfalls
- Comparing only the premium, not the deductible and reimbursement together. A cheap premium with a high deductible and a low reimbursement percentage can cost more out of pocket during an actual claim than a pricier policy with richer terms.
- Assuming pre-existing conditions are covered. Enrolling after a pet is already showing symptoms of a condition typically means that condition, and often related ones, are permanently excluded.
- Ignoring the waiting period. Most policies impose a waiting period (commonly 14-30 days for illness, sometimes shorter for accidents) before coverage begins, during which claims are denied even if the policy is active.
- Judging value from a single healthy year. A single year with low vet bills makes any insurance policy look like a bad deal in hindsight; the expected-value framework, not any one year's outcome, is the right way to evaluate the purchase decision.
- Not re-shopping as the pet ages. Premiums typically climb with age; periodically comparing your renewal premium against current market rates can reveal meaningful savings.
Frequently Asked Questions
What counts as "breaking even" on a pet insurance policy?
Is a policy that never breaks even a bad purchase?
How accurate are the default illness/injury probabilities?
Does a higher reimbursement percentage always mean a better deal?
Why does the deductible matter so much to the break-even number?
Sources
- National Association of Insurance Commissioners, the standard-setting body of U.S. state insurance regulators. content.naic.org
Also consulted: North American Pet Health Insurance Association (NAPHIA): State of the Industry Report, 2024 average annual premium and market size data; Insurance Information Institute (III): Facts + Statistics on pet ownership and insurance; American Veterinary Medical Association (AVMA): Pet insurance industry growth reporting.