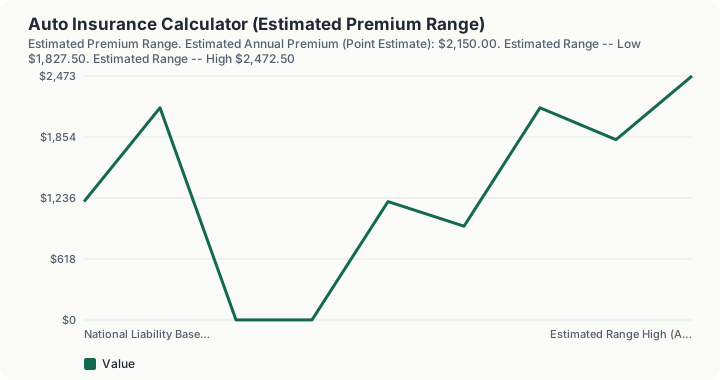
Quick Answer: A $30,000 vehicle with full coverage, a clean driving record, and no state selected (national baseline) has an estimated annual premium of $2,150, with a typical range of $1,827.50 to $2,472.50 depending on the carrier. This is an estimate, not a quote.
Overview
Auto insurance pricing is one of the most individualized products in personal finance: two neighbors with identical cars can pay meaningfully different premiums based on age, credit-based insurance score, annual mileage, claims history, and the specific carrier's own underwriting model, none of which any calculator without access to real-time carrier rate filings can price precisely. This calculator does not pretend otherwise. It produces a range, built from published national industry averages and standard rating factors you provide, explicitly designed to avoid the false precision of a single dollar figure.
The methodology starts from countrywide average premiums (liability-only and full coverage, drawn from published 2025 industry data) and applies three adjustments: your driving record, your vehicle's value (which drives the comprehensive/collision portion of full coverage), and a regional cost-of-living index as a proxy for geographic cost variation, since state-specific insurance rate filings are not publicly available in a form this platform can verify and reproduce. The result is a point estimate with a disclosed plus-or-minus range reflecting typical carrier-to-carrier pricing variance for otherwise-identical risk profiles.
How This Is Calculated
- National baseline. Two countrywide average annual premiums serve as the starting point: approximately $1,200 for liability-only coverage and $2,150 for full coverage (liability plus comprehensive and collision), based on published 2025 industry averages.
- Driving record multiplier. Your driving record tier scales the baseline, reflecting commonly cited industry rate-impact magnitudes for violations and accidents:
| Driving Record | Multiplier |
|---|---|
| Clean (no violations/claims) | 1.00x |
| One minor violation | 1.20x |
| At-fault accident / multiple violations | 1.45x |
| DUI/DWI or major violation | 1.90x |
- Vehicle value factor. For full coverage, the comprehensive/collision portion of the premium scales with vehicle value relative to a $30,000 baseline vehicle, floored at 0.5x and capped at 3.0x to keep the estimate reasonable at the extremes.
- Regional cost multiplier. Your selected state's overall cost-of-living index (from this platform's state cost-of-living data table, US average = 100) is used as a proxy for regional cost variation. This is not a state insurance-rate filing; it is an honest proxy disclosed as such, used only because verified state-by-state insurance premium data is not available to reproduce reliably.
- Point estimate and range. Liability and comprehensive/collision premiums (each independently adjusted) are summed into a point estimate, then a disclosed ±15% band is applied to represent typical carrier-to-carrier pricing variance for the same risk profile.
Worked Example
Using the calculator's default inputs:
- Vehicle Value: $30,000 (equal to the baseline, so the vehicle value factor is 1.00x)
- Coverage Level: Full Coverage
- Driving Record: Clean
- State: National Average (no state selected, regional multiplier 1.00x)
Step by step:
- Liability premium: $1,200 × 1.00 (driving) × 1.00 (regional) = $1,200.00
- Comp/collision premium: $950 (full-coverage baseline minus liability baseline) × 1.00 (vehicle) × 1.00 (driving) × 1.00 (regional) = $950.00
- Point estimate: $1,200.00 + $950.00 = $2,150.00
- Estimated range: $2,150.00 × 0.85 = $1,827.50 (low) to $2,150.00 × 1.15 = $2,472.50 (high)
- Estimated monthly premium: $2,150.00 ÷ 12 = $179.17
Why This Is a Range, Not a Quote
Real auto insurance premiums depend on dozens of factors this calculator does not have access to: your exact ZIP code, credit-based insurance score (used in most states), annual mileage, vehicle safety and theft-rate ratings by exact make/model/trim, prior insurance lapses, marital status, and the specific carrier's own proprietary pricing algorithm, which can differ from a competitor's by 30% or more for the identical driver. State insurance regulation also varies significantly: some states restrict the use of credit scoring or gender in pricing, others require specific minimum liability limits that materially change the liability baseline. Getting an actual number requires a real quote from a licensed carrier or agent in your state. This calculator's job is to give you a defensible starting range for budgeting and comparison shopping, not to replace that quote.
What This Does Not Account For
- Your exact ZIP code or county. This calculator uses a state-level cost-of-living proxy, not the ZIP-code-level territory rating most carriers actually use, which can vary premiums significantly even within the same state.
- Credit-based insurance score. Most states allow carriers to use a credit-based insurance score as a major rating factor; this calculator does not model it.
- Annual mileage and vehicle usage. Commute distance and annual mileage materially affect real premiums and are not inputs here.
- Multi-policy and other discounts. Bundling home and auto, good-student discounts, low-mileage discounts, and safe-driver telematics programs can meaningfully reduce actual premiums below this estimate.
- Make/model/trim-specific rating. This calculator uses vehicle value as a single proxy; real underwriting also weighs the specific vehicle's theft rate, repair cost, and safety rating independent of its dollar value.
- State-mandated minimum coverage differences. Some states require materially higher or lower minimum liability limits than others; this calculator applies a single national liability baseline rather than each state's actual statutory minimum.
Common Pitfalls
- Treating the point estimate as a quote. This is a budgeting range built from national averages and standard rating factors, not a carrier-issued quote. Always get real quotes before budgeting a specific premium.
- Assuming full coverage is always required. Full coverage (comprehensive and collision) is typically only required by an auto lender or lessor; an owned, paid-off older vehicle may not need it if its value no longer justifies the added premium.
- Ignoring how much driving record moves the number. The gap between a clean record and a DUI/major violation in this model is nearly double the premium, consistent with real-world rate impacts; a clean record is the single largest lever a driver personally controls.
- Not shopping multiple carriers. Because carrier pricing algorithms differ substantially for the same risk profile, comparing quotes from several carriers routinely finds savings well outside this calculator's ±15% disclosed range.
- Forgetting liability limits still cost money even at "minimum." Liability-only coverage is cheaper than full coverage, but it does not mean cheap in an absolute sense, and it provides no coverage for your own vehicle's damage.
Frequently Asked Questions
Why doesn't this calculator ask for my ZIP code or give an exact state rate?
How much does full coverage typically cost versus liability-only?
Why is the driving-record multiplier so large for a DUI?
Can I use this calculator to compare two vehicles?
Does a lower reported premium mean a worse insurer?
Sources
- National Association of Insurance Commissioners, the standard-setting body of U.S. state insurance regulators. content.naic.org
Also consulted: Insurify: Countrywide average cost of liability-only car insurance, 2025-2026 data; ValuePenguin: State of Auto Insurance, national average full-coverage premium, 2025; Insurance Information Institute (III): Facts + Statistics on auto insurance, rate trend commentary; MERIC (Missouri Economic Research and Information Center) composite cost-of-living index by state, used here only as a regional cost proxy.