Quick Answer: Guyton-Klinger lets you start retirement withdrawing more than the static 4% rule by adjusting your annual withdrawal up or down whenever it drifts more than 20% from your original rate.
Overview
The 4% rule, developed by William Bengen in the 1990s, tells a retiree to withdraw a fixed percentage of the starting portfolio in year one, then simply increase that dollar amount every year for inflation, regardless of how markets perform. Simple, yes, but also rigid. A retiree who happens to retire right before a strong bull market ends up leaving an enormous amount of money unspent, while a retiree who retires right before a prolonged downturn gets no relief from the plan even as their portfolio shrinks.
Jonathan Guyton and William Klinger addressed this rigidity in a 2006 Journal of Financial Planning paper, "Decision Rules and Maximum Initial Withdrawal Rates." They proposed a dynamic system built around four rules that respond to how the portfolio is actually performing, rather than assuming a fixed path. Their research found that these rules could support meaningfully higher initial withdrawal rates, in the 5.0% to 5.6% range for portfolios with substantial stock exposure, while maintaining a very high probability the money would last. This calculator implements the two rules that most directly change year-to-year spending: the Withdrawal Rule and the paired Capital Preservation and Prosperity guardrails.
How This Is Calculated
Guyton and Klinger's system rests on four decision rules. This calculator focuses on the three that determine your annual withdrawal amount.
The Withdrawal Rule. In a normal year, your withdrawal simply increases from the prior year by the rate of inflation, exactly like the static 4% rule. The one exception in the full Guyton-Klinger method is that if the portfolio had a negative return the prior year, the inflation raise is skipped entirely, freezing the withdrawal at the prior dollar amount. Because this calculator uses a single constant assumed annual return rather than a year-by-year randomized sequence, that specific exception never triggers here. A full stochastic simulation would be needed to model it.
The Capital Preservation Rule (the upper guardrail). Each year, the calculator checks the "current withdrawal rate," meaning this year's planned withdrawal divided by the portfolio's value at the start of the year. If that current rate has risen more than 20% above your original first-year withdrawal rate, meaning the portfolio has shrunk relative to what you are taking out, the withdrawal is cut by 10% before it is paid. This protects the portfolio from a rapid downward spiral during a sustained downturn.
The Prosperity Rule (the lower guardrail). If the current withdrawal rate has fallen more than 20% below your original rate, meaning the portfolio has grown faster than your withdrawals, the withdrawal is raised by 10%. This lets a retiree whose portfolio is thriving spend more, rather than needlessly under-spending for decades.
Both guardrails use the same 20% distance and 10% adjustment size in the original Guyton-Klinger paper, and both are configurable inputs on this calculator so you can test tighter or looser guardrails.
The calculator projects your portfolio year by year: apply the current year's withdrawal decision (including any guardrail adjustment), subtract the withdrawal from the portfolio, then grow the remainder by your assumed annual return. It repeats this for your full planning horizon and reports the average withdrawal, the worst 10th-percentile withdrawal year (via the statistics primitive's percentile function), and the total number of times each guardrail fired.
Worked Example
A retiree starts with a $1,500,000 portfolio and a 5.0% initial withdrawal rate, assuming a constant 6.0% annual return and 2.5% inflation, with the standard 20% guardrail width and 10% adjustment, over a 30-year horizon.
Step 1 -- Set the guardrails. Upper: 5.0% x 1.20 = 6.00%. Lower: 5.0% x 0.80 = 4.00%
Step 2 -- Year 1 withdrawal. $1,500,000 x 5.0% = $75,000.00
Step 3 -- Year 1 guardrail check. $75,000 / $1,500,000 = 5.00%, which is neither above 6.00% nor below 4.00%, so no adjustment
Step 4 -- Year 1 ending balance. ($1,500,000 - $75,000) x 1.06 = $1,510,500.00, of which $85,500.00 is growth
Step 5 -- Year 2 withdrawal under the Withdrawal Rule. $75,000 x 1.025 = $76,875.00
Step 6 -- Year 2 guardrail check. $76,875 / $1,510,500 = 5.09%, still inside the band, so no adjustment
Step 7 -- Year 2 ending balance. ($1,510,500 - $76,875) x 1.06 = $1,519,642.50
Step 8 -- Cumulative growth through year 2. $85,500.00 + $86,017.50 = $171,517.50
Where the first guardrail actually fires
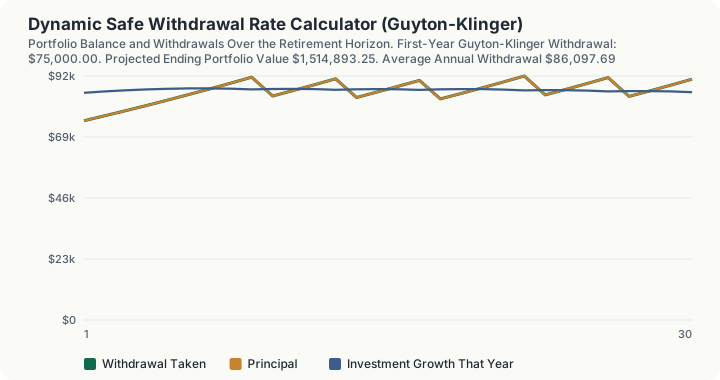
The withdrawal grows at 2.5% a year while the portfolio barely moves, so the current rate drifts upward by roughly a tenth of a point annually. It takes nine years to reach the ceiling.
Step 9 -- Year 9's withdrawal and rate. $91,380.23 against a start-of-year balance of $1,537,975.17, a rate of 5.94% -- inside the band by six hundredths of a point
Step 10 -- Year 10's inflation-adjusted withdrawal, before any check. $91,380.23 x 1.025 = $93,664.74
Step 11 -- Year 10 guardrail check. $93,664.74 / $1,533,390.64 = 6.11%, above the 6.00% upper guardrail, so the Capital Preservation Rule fires
Step 12 -- Year 10 withdrawal after the 10% cut. $93,664.74 x 0.90 = $84,298.27
Step 13 -- Year 10 ending balance and cumulative growth. Balance $1,536,037.91, cumulative growth to date $866,925.13
That single 10% cut resets the rate to 5.63% and buys roughly four more years before the ceiling is touched again. Over the full horizon the Capital Preservation Rule fires 5 times -- in years 10, 14, 18, 23 and 27 -- and the Prosperity Rule fires 0 times, because a 6% return never outruns a 5% withdrawal plus 2.5% inflation by enough to push the rate below 4.00%.
Step 14 -- Year 20 and year 30, from the computed schedule. Year 20 withdrawal $87,406.21, balance $1,534,918.44. Year 30 withdrawal $90,628.75, ending balance $1,514,893.25
Step 15 -- What the thirty years produced in total. Average annual withdrawal $86,097.69, 10th-percentile year $80,569.81, withdrawal volatility $4,236.44, cumulative investment growth $2,597,824.07
The shape of that result is the point of the method. The retiree started at a 5% rate, which a static rule would call reckless, took an average of $86,097.69 a year rather than $75,000, and still finished with $1,514,893.25 -- slightly more than they began with in nominal terms. The price was five cuts, and the worst year still paid $80,569.81, above the year-one figure. Guyton and Klinger's claim was never that guardrails avoid pain; it is that a small, rule-bound cut taken early is cheaper than the permanent under-spending a static rule requires to reach the same survival odds.
What This Does Not Account For
- No sequence-of-returns risk. This calculator uses one constant annual return for the entire horizon. Real portfolios experience a volatile sequence of up and down years, and the order those returns arrive in, especially in the first several years of retirement, matters enormously for how long a portfolio survives. A true test of the Guyton-Klinger rules requires Monte Carlo simulation or historical sequence testing, not a single deterministic path.
- The Withdrawal Rule's negative-return exception is not modeled, as explained above, because it depends on year-to-year return variability that a constant-return model cannot produce.
- The Portfolio Management Rule is not modeled. The full Guyton-Klinger system also specifies which asset class to draw from each year (rebalancing preferentially from strong performers, and refraining from selling depressed assets), which requires a multi-asset-class simulation this single-portfolio-balance calculator does not attempt.
- No allowance for the "last 15 years" carve-out. Guyton and Klinger's original paper suspends the Capital Preservation Rule once the retiree is within roughly 15 years of the end of the planning horizon, since a spending cut becomes less useful very close to the end of the plan. This calculator applies the guardrail uniformly across the full horizon.
- No taxes, required minimum distributions, Social Security, or pension income are modeled. This is a portfolio-only withdrawal simulation.
Common Pitfalls
- Assuming a higher initial withdrawal rate is automatically safe just because guardrails exist. The guardrails reduce, but do not eliminate, the risk of running out of money in a genuinely bad sequence of returns.
- Ignoring the psychological reality of a spending cut. A 10% cut to retirement income during a market downturn is easy to model on a spreadsheet. It's harder to actually live with, and guardrail strategies work only if the retiree is willing to follow them.
- Treating the 20% guardrail as an absolute dollar threshold rather than a relative one. The trigger is based on the ratio between the current and initial withdrawal rates, not a fixed dollar drop in portfolio value.
- Comparing Guyton-Klinger results directly to a static 4% rule without adjusting for the higher starting rate. Guyton-Klinger is typically paired with a materially higher starting withdrawal rate than the static rule, which is the entire point of adding dynamic guardrails.
- Forgetting that this is a nominal-dollar model. All figures shown, including the ending portfolio value, are in future nominal dollars unless you separately deflate them by cumulative inflation to see purchasing power.
Frequently Asked Questions
How is Guyton-Klinger different from the simple 4% rule?
What withdrawal rate did Guyton and Klinger's research actually support?
What happens if both guardrails could theoretically fire in the same year?
Does this calculator guarantee my money will last the full planning horizon?
Why does the calculator report a 10th-percentile withdrawal year?
Sources
- Milevsky, M. A. and Robinson, C. (2005), "A Sustainable Spending Rate without Simulation," Financial Analysts Journal 61(6). doi.org/10.2469/faj.v61.n6.2776
- Milevsky, M. A. and Huang, H. (2011), "Spending Retirement on Planet Vulcan: The Impact of Longevity Risk Aversion on Optimal Withdrawal Rates," Financial Analysts Journal 67(2). doi.org/10.2469/faj.v67.n2.2
Also consulted: Jonathan T. Guyton and William J. Klinger, "Decision Rules and Maximum Initial Withdrawal Rates," Journal of Financial Planning, March 2006; Michael Kitces, "Implementing Retirement Income Guardrails With Clients," Kitces.com, for practical implementation details of the guardrail thresholds; White Coat Investor, "What Is the Guyton-Klinger Guardrails Approach for Retirement?", for a plain-language summary of the four decision rules.