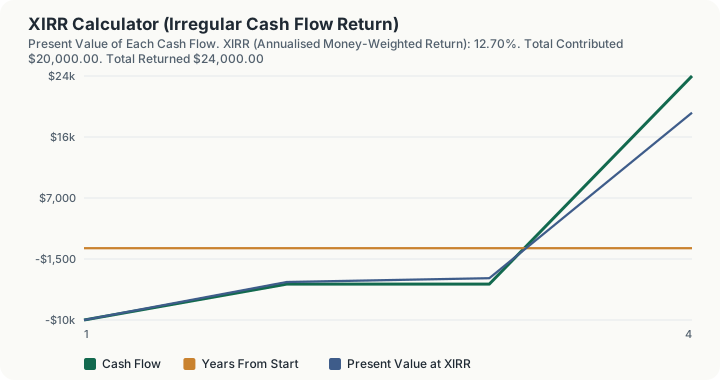
Quick Answer: With $10,000 invested at the start, $5,000 added at month 6, another $5,000 at month 18, and a $24,000 ending value at month 24, the XIRR is 12.70% a year. The naive annualised figure, a 20.00% total gain spread over the 2.0027 elapsed years, is only 9.53%. The 3.17 percentage point gap is the timing effect: the later dollars were exposed for less time, so each dollar-year worked harder than the simple calculation implies.
What does this calculator do?
Most return figures assume all your money showed up on day one. Almost nobody's does. You contribute at odd intervals, withdraw at others, and the simple arithmetic of "total gain divided by total contributed, annualised" quietly treats a dollar added last month the same as one that has been at risk for three years.
XIRR fixes that by solving for the single annual rate that makes the present value of every dated cash flow sum to zero. It is money-weighted: dollars that were invested longer carry more weight, exactly as they should. It is what Excel's XIRR function computes, and it is the correct measure of what your money actually earned.
It is not the right measure of a fund manager's skill, which is a separate and frequently confused point. A manager who receives a large inflow just before a bad quarter has a poor XIRR through no fault of their own. Time-weighted return exists for that question. XIRR answers the investor's question: what did my money earn?
How is this calculated?
XIRR is the rate $r$ solving
∑_i Cᵢ/((1 + r)^(dᵢ/365)) = 0
where Cᵢ is each cash flow and dᵢ is the number of actual calendar days from the first flow. Contributions are negative and withdrawals or the terminal value positive, the same sign convention Excel uses.
There is no closed form. The engine solves it numerically with Newton's method and falls back to bisection when Newton does not converge.
Step 1: Lay out the dated cash flows. Month offsets are applied to a fixed anchor date so the result never drifts with today's date. 2020-01-01: -$10,000 2020-07-01: -$5,000 2021-07-01: -$5,000 2022-01-01: +$24,000
Step 2: Compute the elapsed calendar days between the first and last flow. 1 January 2020 to 1 January 2022 = 731 days
Note it is 731, not 730. 2020 was a leap year. That single day is precisely why XIRR is not IRR.
Step 3: Convert to years on an ACT/365 basis. 731 / 365 = 2.0027 years
Step 4: Compute the year fraction for each individual flow. Flow 1: 0 days = 0.0000 years Flow 2: 182 days = 0.4986 years Flow 3: 547 days = 1.4986 years Flow 4: 731 days = 2.0027 years
Step 5: Sum the contributions and the returns. Total contributed: $10,000 + $5,000 + $5,000 = $20,000 Total returned: $24,000
Step 6: Take the net gain. $24,000 - $20,000 = $4,000
Step 7: Compute the simple return on contributed capital. $4,000 / $20,000 = 0.20 = 20.00%
Step 8: Annualise it naively over the elapsed span. 1.20^(1/2.0027) - 1 = 9.53%
This treats every dollar as if it had been invested for the full 2.0027 years. Two of the four flows were not.
Step 9: Solve for the rate that zeroes the present value sum. Discounting each flow at 12.70%: -$10,000 / 1.127^0.0000 = -$10,000.00 -$5,000 / 1.127^0.4986 = -$4,710.70 -$5,000 / 1.127^1.4986 = -$4,179.99 +$24,000 / 1.127^2.0027 = +$18,890.69 Sum: approximately $0.00
That is the definition of the XIRR, and the table on the page shows exactly these present values.
Step 10: Take the timing effect. 12.70% - 9.53% = +3.17 percentage points
XIRR exceeds the naive figure because the later contributions were exposed for less than the full period, so the same $4,000 gain was earned on fewer dollar-years of capital than the simple calculation assumed.
The engine guards one case explicitly. If the cash flows never change sign (contributions only, with no ending value or withdrawal) there is no rate at which the present value can be zero, and no XIRR exists. The page reports it as undefined and explains why, rather than returning a meaningless number from a solver that ran out of bracket.
Worked Example
You started an investment account with $10,000 in January 2020, added $5,000 six months later, another $5,000 eighteen months in, and the account was worth $24,000 at the two-year mark.
Step 1: The obvious calculation. You put in $20,000 and it became $24,000. That is a 20.00% gain over roughly two years, which most people would annualise to about 9.53%.
Step 2: Why that is wrong. The last $5,000 was only invested for six months. Charging it with two years' worth of the denominator understates the rate your money actually compounded at.
Step 3: The money-weighted answer. 12.70%
Step 4: The size of the correction. +3.17 percentage points. Not a rounding difference. On a decision about whether an investment beat a benchmark, three points is the entire argument.
Step 5: Verify by discounting. Take the $24,000 terminal value back two years at 12.70% and it is worth $18,890.69 today. Take the three contributions forward at the same rate and their present values are $10,000.00, $4,710.70 and $4,179.99, summing to $18,890.69. The two sides balance, which is what the solver was searching for.
Step 6: Test the boundary case. Set both extra contributions to zero and raise the initial investment to $20,000. All the money is now invested for the whole period, and XIRR and the naive annualised return become the same number. The timing effect goes to zero, which is the sanity check that confirms the timing effect is measuring exactly what it claims to.
Step 7: Test the opposite direction. Move most of the money late: $4,000 initially, $2,000 at month 6, $14,000 at month 18. XIRR rises far above the naive figure on the same total gain, because most of the capital was only working for six months.
What does this calculator not account for?
- Manager skill. XIRR is money-weighted and is affected by when you contributed, which is usually your decision rather than the manager's. Time-weighted return is the measure for evaluating a strategy independent of flows. Comparing an XIRR against a fund's published time-weighted return is not a like-for-like comparison.
- Multiple valid solutions. A cash flow stream that changes sign more than once can have more than one internal rate of return. The engine returns one root and does not enumerate the others. With the simple contribute-then-withdraw pattern this page supports, the sign changes once and the root is unique.
- Taxes, fees and costs. Every figure is gross. Advisory fees, transaction costs, withholding and capital gains tax are all outside the calculation.
- Inflation. The result is a nominal rate. Nothing here converts it to a real return.
- Reinvestment assumptions. Like any internal rate of return, XIRR implicitly assumes interim cash flows compound at the same rate. When the rate is high, that assumption is doing more work than it looks.
- More than four cash flows. This page supports an initial investment, two optional contributions and a terminal value. A long irregular stream needs a spreadsheet.
- Withdrawals during the period. Every intermediate flow here is a contribution, entered as a positive number and treated as negative internally. A mid-period withdrawal cannot be modelled.
- Anything about risk. A 12.70% XIRR earned smoothly and one earned through a 60% drawdown are identical here.
What mistakes do people make with this?
- Confusing XIRR with time-weighted return. These answer different questions and routinely differ by several points. XIRR tells you what your money earned. Time-weighted return tells you how the strategy performed. Neither is wrong; using the wrong one for the question is.
- Annualising by hand. The naive figure on this page, 9.53%, is exactly the calculation most people do mentally, and it is 3.17 points off. The page shows it deliberately so the gap is visible.
- Ignoring leap days. XIRR discounts on actual calendar days. The default stream spans 731 days rather than 730 because 2020 was a leap year, and the ACT/365 convention means that extra day changes the answer slightly.
- Getting the sign convention backwards. Money going in is negative, money coming out or remaining at the end is positive. This page takes contributions as positive numbers in the fields and applies the sign internally, but in a spreadsheet you must do it yourself, and a stream with all-positive entries will not solve.
- Expecting a number when the cash flows never change sign. A stream of contributions with no ending value has no internal rate of return, because there is no rate at which the present values can cancel. This page says so explicitly instead of returning a solver artefact.
- Reading a very high XIRR on a short period as durable. Annualising a six-week gain produces enormous numbers that mean nothing about a full year.
- Forgetting the ending value. The final cash flow is the account's current worth, not a withdrawal you made. Leaving it out entirely removes the only positive flow and makes the problem unsolvable.
Frequently Asked Questions
What is the difference between IRR and XIRR?
Why is my XIRR higher than my simple annualised return?
Is XIRR the same as what my brokerage shows?
Can XIRR be negative?
Why does the calculator sometimes say XIRR is undefined?
Does the order of my contributions matter, or just the total?
What discount convention is used for the year fractions?
Sources
- Global Investment Performance Standards (GIPS), CFA Institute, for the distinction between money-weighted and time-weighted return and the circumstances in which each is the appropriate measure. gipsstandards.org/standards/gips-standards-for-firms
- U.S. Securities and Exchange Commission, Investor.gov, the official authority for the investing this calculator relates to. investor.gov
Also consulted: The XIRR definition and the ACT/365 sign convention follow the Microsoft Excel XIRR function, which is the de facto standard for money-weighted return on irregularly dated cash flows; The root is found by Newton's method with a bisection fallback, implemented in the platform's shared net present value and internal rate of return primitive; the calculator guards for the absence of a sign change before invoking it.