Quick Answer: A portfolio that returned 10% then 5% in two back-to-back periods has a 15.5% time-weighted return regardless of cash flows, but if an investor added $5,000 right before the weaker 5% period, their personal dollar-weighted (money-weighted) return drops to about 14.49%, because more of their money was exposed to the lower-return period.
Overview
Two investors can hold the exact same fund, over the exact same period, and walk away with genuinely different personal returns, not because the fund manager did anything different for either of them, but because of when each investor happened to add or withdraw money. This is the central fact that time-weighted return (TWR) and dollar-weighted return (DWR, also called money-weighted return) are each designed to handle differently, and confusing the two, or not realizing a single number cannot answer both questions at once, is one of the most common sources of confusion in performance reporting.
Time-weighted return measures the compound growth rate of one dollar invested for the entire period, completely removing the distorting effect of when cash flows happened or how large they were. It is calculated by breaking the period into subperiods bounded by each cash flow, calculating the return for each subperiod on its own, and chain-linking (compounding) those subperiod returns together. Because it strips out cash-flow timing entirely, TWR is the industry-standard way to judge a portfolio manager's skill: a manager has no control over when a client decides to add or withdraw money, so it would be unfair to let those decisions affect the number used to evaluate the manager's investment decisions.
Dollar-weighted return measures the actual annualized return an individual investor experienced, given the specific size and timing of every dollar they personally put in or took out, and what the portfolio was worth at the end. It is calculated as the internal rate of return (IRR) on the investor's full stream of dated cash flows. Because it is directly sensitive to an investor's own timing decisions, DWR is the right number for answering "what did I personally earn on my money," even though it is the wrong number for evaluating whether the manager's investment decisions were skillful.
How This Is Calculated
Time-Weighted Return chain-links each subperiod return:
Where $r_t$ is the manager's return for subperiod $t$, calculated independently for each subperiod between cash flows. This calculator computes TWR using the platform's shared chain-linking function, applied directly to the subperiod returns you enter.
Dollar-Weighted Return solves for the single discount rate that makes the net present value of the investor's entire dated cash flow stream equal to zero:
Where $CF_t$ is each cash flow (initial investment and any contribution as a negative outflow, any withdrawal and the final ending value as a positive inflow), discounted back to Day 0 using the actual number of days between each cash flow date. This calculator computes DWR using the platform's shared IRR solver applied to the exact dated series: the initial investment, up to two interim contributions or withdrawals, and the final ending value treated as if liquidated on the last day.
Worked Example
The same portfolio, measured two ways
A portfolio opens with $10,000. It returns 10% in the first half of the year. On day 182 the investor adds $5,000. It returns 5% in the second half. The measurement window is 365 days.
Step 1 -- Chain-link the subperiod returns. (1 + 0.10) x (1 + 0.05) = 1.155, so TWR = 15.5%
That is the whole time-weighted calculation. The $5,000 never appears in it, and could not, because chain-linking multiplies rates rather than dollars.
Step 2 -- Track the actual dollars, first subperiod. $10,000 x 1.10 = $11,000.00
Step 3 -- The contribution. $11,000.00 + $5,000.00 = $16,000.00
Step 4 -- Second subperiod. $16,000.00 x 1.05 = $16,800.00
Step 5 -- Assemble the dated cash flow series. -$10,000 on day 0, -$5,000 on day 182, +$16,800 on day 365
Step 6 -- Solve for the rate that zeroes the NPV of that series. DWR = 14.49%
Step 7 -- The divergence. 15.50% - 14.49% = 1.01 percentage points, with the time-weighted figure the higher of the two
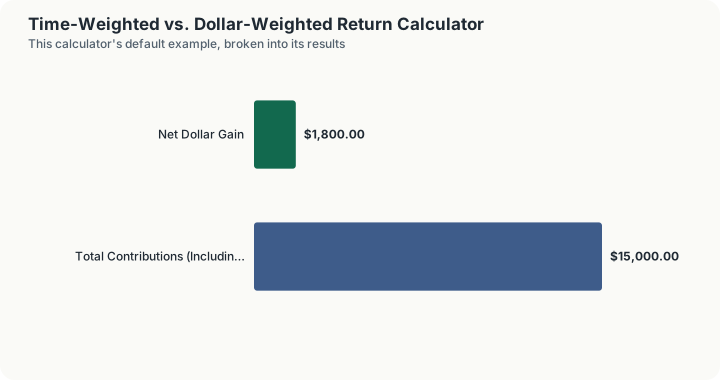
Step 8 -- The actual dollars earned. $16,800 ending value + $0 withdrawn - $15,000 contributed = $1,800.00
Steps 1 and 6 describe the same twelve months and the same portfolio and disagree by a full percentage point. Neither is wrong. The manager earned 10% then 5%, and that is 15.5% compounded, full stop. But two thirds of the investor's money only ever saw the weaker 5% leg, so the return on the average dollar they had at risk was 14.49%. TWR answers "how did the portfolio do", DWR answers "how did I do", and the $5,000 on day 182 is the entire reason those are different questions.
Reverse the cash flow and the gap reverses with it
Same 10% and 5% subperiods, but on day 182 the investor takes $5,000 out instead of putting it in.
Step 9 -- Balance after the withdrawal. $11,000.00 - $5,000.00 = $6,000.00
Step 10 -- Second subperiod. $6,000.00 x 1.05 = $6,300.00
Step 11 -- The cash flow series. -$10,000 on day 0, +$5,000 on day 182, +$6,300 on day 365
Step 12 -- The dollar-weighted return. DWR = 17.12%, now 1.62 percentage points above the unchanged 15.50% TWR
The TWR did not move a basis point between step 1 and step 12, because nothing the manager did changed. The investor's own number swung by 2.63 points on the strength of a single timing decision. That is the case for GIPS requiring time-weighted reporting in one sentence: a manager judged on DWR is being graded on their clients' behaviour.
A more realistic three-period path
8% in the first stretch, a $2,000 contribution on day 120, a 4% loss, a $1,000 withdrawal on day 250, then 6%.
Step 13 -- Chain-link three subperiods. 1.08 x 0.96 x 1.06 - 1 = 9.9008%
Step 14 -- The dated series. -$10,000 on day 0, -$2,000 on day 120, +$1,000 on day 250, +$11,965.28 on day 365
Step 15 -- The dollar-weighted return. DWR = 8.76%, 1.14 percentage points below the TWR
Step 16 -- The dollars. $11,965.28 + $1,000.00 withdrawn - $12,000.00 contributed = $965.28 of net gain
Here the drag comes from the contribution landing immediately before the down leg, only partly offset by the withdrawal that took money off the table before the recovery. Two flows in opposite directions, and the timing penalty still nets out negative -- which is the ordinary experience of most investors, and the reason a statement's personal return so often trails the fund's published one.
Why the Industry Uses TWR to Judge Managers
If a fund reported dollar-weighted returns as its headline performance figure, that number would be at the mercy of whatever the fund's largest investors happened to do with their money, entirely outside the manager's control. A large client who happened to add a big contribution right before a strong quarter would flatter the fund's dollar-weighted number; a large client who added money right before a weak quarter would drag it down, regardless of anything the manager actually did. This is precisely why the CFA Institute's Global Investment Performance Standards (GIPS), the widely recognized standard for reporting investment performance, require time-weighted returns for composite performance reporting: TWR isolates the manager's actual investment decisions from client-driven cash-flow timing, making it possible to fairly compare one manager against another or against a benchmark.
Dollar-weighted return has not become less useful for its own purpose; it remains the correct number for an individual investor asking "what did I personally earn." A retirement account statement showing an investor's personal annualized return is typically closer to a dollar-weighted calculation, since it reflects that specific person's actual contribution and withdrawal history, not an idealized single-dollar benchmark.
What This Does Not Account For
This calculator requires the subperiod returns to be entered directly, since deriving true chain-linked subperiod returns from raw cash flows alone requires knowing the portfolio's exact value immediately before and after each cash flow, information typically produced by a fund administrator's official valuation process rather than something this calculator can infer. It supports up to three subperiods and two interim cash flows; portfolios with many more contribution and withdrawal events over a long history would need those returns pre-aggregated into subperiods before use. It does not account for the difference between pre-tax and after-tax returns, fees charged at different points in the period, or currency effects for portfolios holding foreign-denominated assets. The dollar-weighted calculation solves numerically for the internal rate of return and, like any IRR calculation, can in rare cash-flow patterns with multiple sign changes produce more than one mathematically valid solution; this calculator's underlying cash-flow patterns (one initial outlay, optional interim flows, one final positive value) are structured to avoid that ambiguity in ordinary use.
Common Pitfalls
- Reporting DWR as if it measured manager skill. A manager who made excellent investment decisions can still show a mediocre dollar-weighted return if a large client happened to add money right before a downturn; that is a statement about the client's timing, not the manager's judgment.
- Reporting TWR as if it measured an individual investor's actual personal return. TWR intentionally ignores what the investor actually put in and took out; it answers "how did the strategy perform," not "how did my money do."
- Assuming a large gap between TWR and DWR means something is wrong. A gap is expected and normal whenever an investor's contributions or withdrawals are meaningfully concentrated around strong or weak performance periods; it is a description of timing, not an error.
- Forgetting that the direction of the gap depends on whether cash moved in or out. Contributing before a weak period drags DWR below TWR; withdrawing before a weak period pushes DWR above TWR; the same logic reverses around strong periods.
- Comparing your personal DWR-style account statement directly against a fund's published TWR-style performance figure. These are frequently different calculation methods measuring different things, and comparing them directly without adjusting for that is a common source of "why doesn't my return match the fund's advertised performance" confusion.
Frequently Asked Questions
Which return figure should I trust: TWR or DWR?
Why do fund fact sheets almost always show time-weighted returns?
Can TWR and DWR ever be exactly equal?
Is dollar-weighted return the same thing as IRR?
What if I contributed and withdrew money multiple times throughout the year?
Sources
- CFA Institute, Global Investment Performance Standards (GIPS). cfainstitute.org
- U.S. Securities and Exchange Commission, Investor.gov, Internal Rate of Return (IRR). investor.gov
Also consulted: CFA Institute, Portfolio Risk and Return: Time-Weighted and Money-Weighted Rate of Return, CFA Program Curriculum.