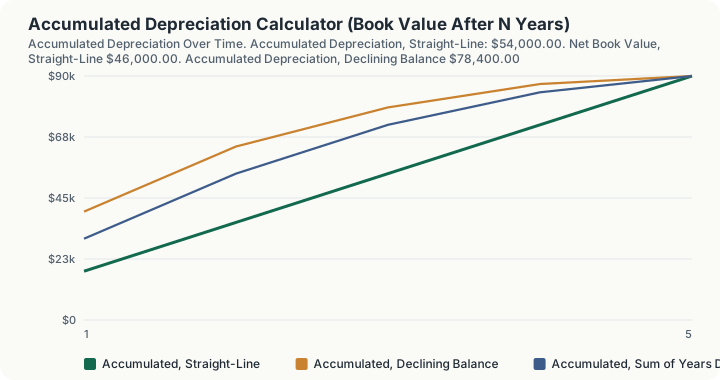
Quick Answer: A $100,000 asset with a $10,000 salvage value and a five-year life, three years in, carries $54,000.00 of accumulated depreciation under straight-line, leaving a net book value of $46,000. Under double declining balance the same asset shows $78,400 accumulated and only $21,600 of book value. The $24,400 gap is accounting policy, not a difference in the asset.
What does this calculator do?
Accumulated depreciation is not an expense. It is a contra-asset balance: the running total of every depreciation charge recorded since the asset was placed in service, carried on the balance sheet directly against the asset's cost. Cost less accumulated depreciation is net book value, and net book value is the number that actually matters when the asset is sold, insured, tested for impairment, or pledged as collateral.
This page answers the balance sheet question rather than the income statement one. It does not ask what this year's charge is. It asks: after a chosen number of full years, how much has piled up, and what is the asset worth on the books as a result under each of the three classic methods.
At the defaults the three answers are $54,000, $78,400 and $72,000 of accumulated depreciation, giving book values of $46,000, $21,600 and $28,000. Every one of those is defensible under generally accepted accounting principles. The choice was made once, at acquisition, and it drives the carrying amount for the rest of the asset's life.
How is this calculated?
Accumulated depreciation at the end of year N is simply the sum of the charges for years 1 through N:
A_N = ∑(t = 1 to N) Dₜ; BV_N = Cost − A_N
What varies is Dₜ, and this page runs all three of the standard patterns:
- Straight-line charges $(Cost - Salvage) / Life$ every year, so accumulated depreciation grows in a straight line: $18,000, $36,000, $54,000 and so on.
- Declining balance charges $factor / Life$ of the opening book value, which at a factor of 2 over five years is 40% a year. The engine switches to straight-line on the remaining basis once that yields more, and never lets book value fall below salvage.
- Sum of years digits charges the base weighted by remaining life over the sum of the digits, 5/15 then 4/15 then 3/15 for a five-year asset.
Under all three, book value can never fall below salvage value and accumulated depreciation can never exceed the depreciable base of $90,000. Entering more elapsed years than the asset has life simply returns the end-of-life position: $90,000 accumulated, $10,000 of book value, $0 still to come.
The share written off is measured against the depreciable base, not the cost. Three years in, straight-line has written off $54,000 of the $90,000 base, which is 60.00%, not the 54% that dividing by the $100,000 cost would suggest.
Worked Example
A machine shop bought a press for $100,000, expects $10,000 for it after five years, and is preparing the balance sheet at the end of year three.
Step 1: The depreciable base. $100,000 cost - $10,000 salvage = $90,000
Step 2: The straight-line annual charge. $90,000 / 5 years = $18,000 a year
Step 3: Accumulated depreciation after year one. $0 + $18,000 = $18,000, book value $100,000 - $18,000 = $82,000
Step 4: Accumulated depreciation after year two. $18,000 + $18,000 = $36,000, book value $64,000
Step 5: Accumulated depreciation after year three. $36,000 + $18,000 = $54,000, book value $46,000
Step 6: Depreciation still to come, straight-line. $46,000 book value - $10,000 salvage = $36,000, which is exactly two more years at $18,000
Step 7: The share of the base already written off. $54,000 / $90,000 = 60.00%
The Same Three Years Under Declining Balance
Step 8: The declining balance rate. factor 2 / 5-year life = 40% a year
Step 9: Year one, and the first accumulated balance. 40% x $100,000 = $40,000 charged. Accumulated $40,000, book value $60,000
Step 10: Year two, on the reduced book value. 40% x $60,000 = $24,000 charged. Accumulated $40,000 + $24,000 = $64,000, book value $36,000
Step 11: Year three. 40% x $36,000 = $14,400 charged. Accumulated $64,000 + $14,400 = $78,400, book value $21,600
Step 12: The book value spread at the same date. $46,000 straight-line - $21,600 declining balance = $24,400
And Under Sum of Years Digits
Step 13: The sum of the digits. 1 + 2 + 3 + 4 + 5 = 15
Step 14: Year one. $90,000 x 5/15 = $30,000. Accumulated $30,000, book value $70,000
Step 15: Year two. $90,000 x 4/15 = $24,000. Accumulated $30,000 + $24,000 = $54,000, book value $46,000
Step 16: Year three. $90,000 x 3/15 = $18,000. Accumulated $54,000 + $18,000 = $72,000, book value $28,000
Note that sum of years digits after two years ($54,000) equals straight-line after three ($54,000). The methods do not run parallel; they cross.
Carrying On to Years Four and Five
Step 17: Year four, straight-line. $54,000 + $18,000 = $72,000 accumulated, book value $28,000
Step 18: Year four, declining balance. The 40% charge on the $21,600 book value is $8,640, against $5,800 for straight-line on the remaining basis, so the larger applies: accumulated $78,400 + $8,640 = $87,040, book value $12,960
Step 19: Year five, straight-line. $72,000 + $18,000 = $90,000 accumulated, book value $10,000
Step 20: Year five, declining balance, where the salvage floor binds. The 40% charge would be $5,184, but only $12,960 - $10,000 = $2,960 of base remains, so that is what is taken. Accumulated $87,040 + $2,960 = $90,000, book value $10,000
Step 21: Where all three converge. $90,000 accumulated and $10,000 of book value under every method, and a book value spread of $0
The whole $24,400 disagreement at year three has vanished by year five. Accumulated depreciation is a timing difference and nothing more, but for four of the five years it is a very large one on the face of the balance sheet.
With no salvage value: the base becomes the full $100,000, straight-line charges $20,000 a year, and three years in accumulated depreciation is $60,000 against a book value of $40,000.
What does this calculator not account for?
- Partial years. This measures whole elapsed years. A real asset placed in service in July gets a part-year charge under most conventions, so the first accumulated balance is typically about half of a full year.
- Units of production. Accumulated depreciation under an output-based method depends on the production history, not the elapsed years this page takes as its input. The depreciation methods calculator handles that method.
- Tax basis. Accumulated depreciation for tax purposes follows MACRS and its own conventions, and rarely equals the book figure. The difference is what deferred tax accounts for.
- Section 179 and bonus depreciation, which can drive tax accumulated depreciation to the full cost in year one while the book figure moves at $18,000 a year.
- Impairment write-downs, which reduce carrying amount outside the depreciation schedule and reset the remaining charge.
- Revaluation, permitted under IFRS but not US GAAP, which resets carrying amount upward.
- Disposal and recapture. Selling above net book value creates a gain, and for tax purposes some or all of it is recaptured as ordinary income. That calculation is a separate page.
- Asset additions and improvements, which are capitalised and depreciated on their own schedules rather than folded into this one.
What mistakes do people make with this?
- Treating accumulated depreciation as an expense. It is a balance, not a flow. The $54,000 here is three years of $18,000 expenses added together, and only the $18,000 hits any single year's income statement.
- Dividing by cost to get the percentage written off. Three years in it is $54,000 of the $90,000 base, or 60.00%, not 54% of the $100,000 cost. Salvage was never depreciable in the first place.
- Expecting book value to equal market value. At $46,000 straight-line and $21,600 declining balance, at most one of them can resemble what the press would fetch. Neither is a valuation.
- Assuming accumulated depreciation keeps growing. It stops at the $90,000 base. Entering eight elapsed years on a five-year asset returns the same $90,000 and $10,000 that year five did.
- Comparing two companies' book values directly. A competitor showing $21,600 for an identical press is not running a worse asset, only a more aggressive method.
- Forgetting the salvage floor in the final year. Declining balance would have charged $5,184 in year five; only $2,960 of base was left, so that is what it took.
Frequently Asked Questions
What is the difference between depreciation expense and accumulated depreciation?
Can accumulated depreciation exceed the asset's cost?
Why do the three methods give different book values for the same asset?
Is net book value what the asset is worth?
What happens to accumulated depreciation when the asset is sold?
Does accumulated depreciation reduce taxes?
Sources
- Internal Revenue Service, the official authority for the tax rules this calculator relates to. irs.gov
Also consulted: Standard accounting mathematics for accumulated depreciation and net book value. Straight-line, declining balance and sum of years digits are conventional methods with no jurisdictional content; The schedules come from the same depreciation primitive used across this site, which enforces the salvage floor and switches declining balance to straight-line when that yields the larger charge.