Quick Answer: The capitalization rate is Net Operating Income divided by property price, expressed as a percentage, and it tells you the unlevered annual yield a property produces before any mortgage financing is factored in.
Overview
The capitalization rate, almost always shortened to "cap rate," is the single number commercial and multifamily investors reach for first when screening a deal. It strips financing out of the picture entirely and asks a narrower question: if you paid cash for this property today, what annual return would the real estate itself generate? Because it ignores debt, cap rate lets you compare a $250,000 duplex against a $12 million apartment complex on equal footing, which is exactly why brokers put it on the first page of every offering memorandum.
Cap rate is a function of two inputs only: Net Operating Income (NOI) and price. NOI is gross rental income, reduced for a realistic vacancy and credit-loss allowance, minus the property's operating expenses (property management, insurance, repairs, property taxes, and reserves) but before mortgage principal, interest, income taxes, and depreciation. Anyone who folds debt service into the "expenses" line has stopped calculating a cap rate and started calculating something else, usually cash-on-cash return, which is a related but distinct metric this calculator does not attempt to replace.
Cap rates move inversely with price for a fixed income stream, and they compress or expand with capital markets conditions, asset class, and location risk. A stabilized Class A apartment building in a coastal metro might trade at a 4.5% cap rate because buyers accept lower current yield in exchange for perceived safety and appreciation potential, while a Class C property in a secondary market might need to clear 8-9% to attract the same buyer pool given higher perceived operating and vacancy risk. This calculator computes the cap rate implied by your inputs and also reverses the formula to show what the property would be worth at a 5.0% benchmark cap rate, a quick sanity check against market comparables.
How This Is Calculated
The calculator works through three sequential steps, each carried out in Decimal-precision arithmetic so there is no floating-point drift on large property values.
Step 1: Effective Gross Income (EGI). Gross annual rental income is reduced by a vacancy and credit-loss allowance:
Step 2: Net Operating Income (NOI). Annual operating expenses (everything except debt service and income tax) are subtracted from EGI:
Step 3: Capitalization Rate. NOI is divided by the property's purchase price or current market value:
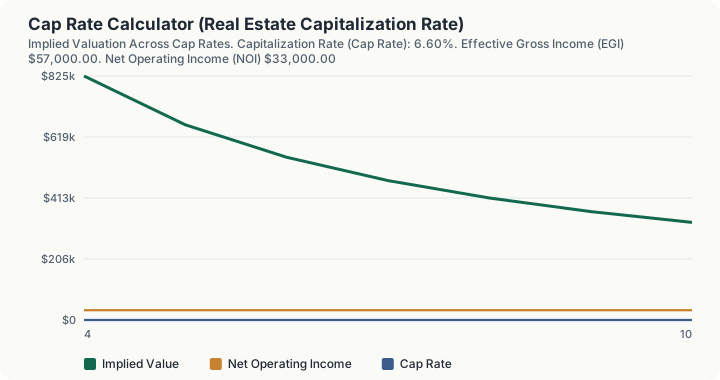
The calculator also solves the formula in reverse to show an implied valuation at a fixed 5.0% cap rate benchmark: Value = NOI ÷ 0.05, plus a sensitivity table running the same NOI through cap rates from 4% to 10% so you can see how much valuation swings as market cap rates move.
Worked Example
Using this calculator's own baseline inputs: a $500,000 property with $60,000 in gross annual rental income, $24,000 in annual operating expenses, and a 5.0% vacancy allowance.
- Vacancy loss: $60,000 × 5.0% = $3,000
- Effective Gross Income: $60,000 − $3,000 = $57,000
- Net Operating Income: $57,000 − $24,000 = $33,000
- Cap rate: $33,000 ÷ $500,000 × 100 = 6.60%
- Implied 5.0% cap valuation: $33,000 ÷ 0.05 = $660,000
That last line is worth sitting with. The same $33,000 of NOI, priced at a more aggressive 5.0% market cap rate, implies a value of $660,000, or $160,000 more than the $500,000 purchase price in this scenario. That gap is the arbitrage opportunity (or the risk premium the buyer is being asked to accept) between the deal price and the broader market's pricing of similar income streams. A second reference point from the calculator's own test suite: an all-cash NNN (triple-net) asset priced at $1,000,000 with $80,000 in gross rent, zero operating expenses, and 0% vacancy produces an 8.00% cap rate directly, since NOI equals the full $80,000 when the tenant covers taxes, insurance, and maintenance under the lease.
What This Does Not Account For
- Capital expenditures (CapEx) reserves. Many operators exclude major roof, HVAC, or parking-lot replacement reserves from "operating expenses," which inflates NOI and understates the true stabilized cap rate. This calculator uses whatever operating expense figure you supply.
- Debt service and leverage. Cap rate is intentionally unlevered. It says nothing about your actual cash-on-cash return, which depends on your loan terms, down payment, and amortization, and can be dramatically higher or lower than the cap rate depending on whether the deal is positively or negatively leveraged.
- Income and expense growth trajectories. This is a single-year snapshot cap rate, not a discounted cash flow or IRR model that captures rent growth, expense inflation, or a future sale.
- Deferred maintenance and physical condition. A property with a strong trailing NOI can still carry hidden capital needs that a cap rate calculation, by design, never sees.
- Transaction costs. Closing costs, due diligence expenses, and broker commissions are not netted against the purchase price in this formula.
Common Pitfalls
- Using pro forma income instead of trailing actuals. Sellers frequently market a "pro forma cap rate" based on optimistic post-renovation rents. Underwrite off trailing twelve-month actual income and a realistic vacancy assumption instead.
- Forgetting to subtract vacancy before computing NOI. A property that shows 0% vacancy on paper because it happens to be fully leased today still needs a market-realistic vacancy and credit-loss allowance, typically 3-8% depending on asset class and market.
- Including debt service in operating expenses. This is the single most common cap rate error and it silently converts the metric into something else entirely, usually producing a number far lower than the true unlevered yield.
- Comparing cap rates across incompatible asset classes. A 6% cap rate on a Class A medical office building and a 6% cap rate on a Class C strip retail center do not carry the same risk profile, even though the number is identical.
- Ignoring cap rate compression risk. Buying at a low cap rate assumes you can either grow NOI meaningfully or exit at an equally low (or lower) cap rate. If market cap rates expand before you sell, your exit valuation falls even if NOI held steady.
Frequently Asked Questions
What is considered a "good" cap rate?
Is a higher cap rate always better for a buyer?
How does cap rate differ from cash-on-cash return?
Does cap rate account for appreciation?
Why does this calculator subtract vacancy before subtracting operating expenses?
What operating expenses should I include?
Sources
- IRS Publication 527, Residential Rental Property, for allowable operating expense treatment, irs.gov/publications/p527
Also consulted: Appraisal Institute, The Appraisal of Real Estate, Income Capitalization Approach chapters; CCIM Institute, Commercial Real Estate Investment Analysis and Underwriting Standards; CBRE Research, U.S. Cap Rate Survey (quarterly reports by asset class and market); National Association of Realtors, Commercial Real Estate Research.