Quick Answer: Monthly cash flow equals rental income minus operating expenses minus the mortgage payment, and cash-on-cash return measures that cash flow against the actual cash you invested to buy the property.
Overview
Buying a rental property is a leveraged bet, and evaluating it with only a cap rate misses the effect of that leverage entirely. This calculator answers the question most buy-and-hold investors actually care about: after the mortgage payment clears every month, does the property put cash in your pocket or pull it out, and how does that cash flow compare to the equity you tied up to acquire the deal? It runs four distinct metrics side by side (net monthly cash flow, cap rate, gross rent multiplier, and cash-on-cash return) plus the widely used "1% rule" screening test, because no single number captures deal quality on its own.
Net Operating Income (NOI) is calculated the standard way: gross monthly rent is annualized, an operating expense percentage is applied to approximate property taxes, insurance, maintenance, property management, and vacancy combined, and the result is NOI. From there, a standard 30-year fixed-rate amortizing mortgage payment is calculated on the financed portion of the purchase price, and subtracting that debt service from monthly NOI produces net cash flow, the actual dollars the property generates (or costs you) each month after every bill is paid except your own income taxes.
Cash-on-cash return divides annualized cash flow by total cash invested, which combines your down payment and your closing and upfront repair costs. This is the metric that reveals leverage's double edge: financing a deal with a smaller down payment concentrates the same absolute cash flow onto a smaller equity base, which can push cash-on-cash return well above the property's unlevered cap rate (positive leverage), or well below it if the mortgage rate exceeds the property's yield (negative leverage). The 1% rule, a rough industry screening heuristic comparing monthly rent to purchase price, is included as a quick first-pass filter, not a substitute for the full cash flow math.
How This Is Calculated
Step 1: Net Operating Income. Gross monthly rent is annualized, and operating expenses (as a percentage of gross rent) are subtracted:
Step 2: Monthly mortgage principal and interest. Standard amortization formula applied to the financed loan amount (purchase price minus down payment) over 360 months:
Step 3: Net monthly cash flow.
Step 4: Cap rate (unlevered yield), gross rent multiplier, and cash-on-cash return.
Total cash invested combines the down payment (purchase price × down payment %) with closing costs and any upfront repair budget.
Worked Example
Using this calculator's baseline inputs: a $300,000 purchase price, 20% down payment, 7.0% interest rate, $2,600 gross monthly rent, 35% operating expense ratio, and $10,000 in closing and upfront repair costs.
- Annual gross rent: $2,600 × 12 = $31,200
- Annual operating expenses: $31,200 × 35% = $10,920
- Net Operating Income: $31,200 − $10,920 = $20,280
- Down payment: $300,000 × 20% = $60,000; loan amount = $240,000
- Monthly mortgage P&I (240,000 financed at 7.0% over 360 months): $1,596.73
- Net monthly cash flow: ($20,280 ÷ 12) − $1,596.73 = $1,690.00 − $1,596.73 = $93.27
- Cap rate: $20,280 ÷ $300,000 × 100 = 6.76%
- Gross rent multiplier: $300,000 ÷ $31,200 = 9.62
- Total cash invested: $60,000 down + $10,000 closing/repairs = $70,000
- Cash-on-cash return: ($93.27 × 12) ÷ $70,000 × 100 = $1,119.24 ÷ $70,000 × 100 = 1.60%
- 1% rule screen: $2,600 ÷ $300,000 = 0.867%, below the 1.0% threshold, so this baseline deal fails the 1% rule despite producing positive cash flow.
That last line illustrates why the 1% rule is only a coarse screen: this property clears $93.27 a month in real cash flow and a healthy 6.76% cap rate, yet it fails the quick rent-to-price screening test. A second reference point confirms the model at the opposite extreme: paying all-cash for a $200,000 property renting for $2,000/month at a 40% expense ratio produces $14,400 NOI, a 7.20% cap rate, $1,200 in monthly cash flow (since there is no mortgage payment to subtract), and a passing 1% rule score, since $2,000 ÷ $200,000 = 1.0%.
Carrying the Cash Flow Forward
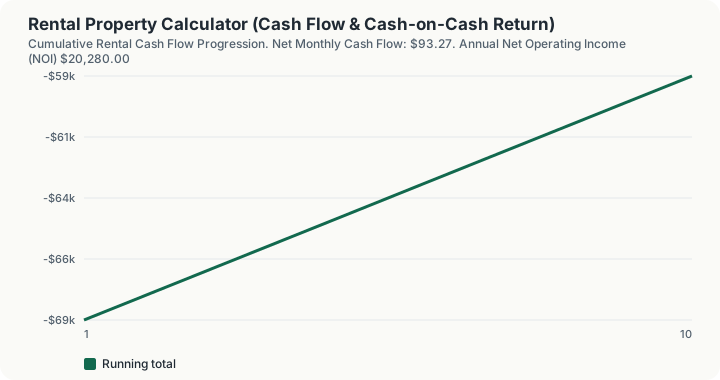
- Cumulative cash position after year one: the $70,000 invested against $1,119.29 of cash flow leaves the position $68,880.71 in the hole.
- After year two: -$67,761.42. Another $1,119.29 recovered.
- After year ten: -$58,807.12. Ten years of rent has returned $11,192.88 of the $70,000.
- What that implies: at this rent, this expense ratio and this financing, cash flow alone would take roughly 63 years to return the capital.
That is not a verdict on the deal, it is a statement about where the return has to come from. A property clearing $93.27 a month is not being bought for its cash flow; it is being bought for the principal the tenant repays and for appreciation, and this calculator models neither. Read the negative cumulative column as the reminder that the cash-on-cash figure of 1.60% is the only part of the return this page can actually see.
What This Does Not Account For
- CapEx reserves separate from the operating expense percentage. A flat operating expense ratio approximates maintenance and reserves, but it can understate real capital needs on an older property with an aging roof, HVAC system, or major mechanical components.
- Vacancy timing and turnover costs. The operating expense ratio blends vacancy loss into a single average figure; actual vacancy hits are lumpy, and turnover between tenants often carries one-time costs (cleaning, re-leasing commissions, make-ready repairs) not itemized separately here.
- Rent growth and appreciation. This is a first-year snapshot. It does not project rent increases, property value appreciation, or how cash flow and returns evolve as the mortgage amortizes over a multi-year hold.
- Depreciation and income tax effects. Real estate depreciation can meaningfully improve after-tax returns; this calculator reports pre-tax cash flow only.
- Property management overhead if you self-manage. If the operating expense ratio you enter includes a property management fee you would not actually pay by self-managing, your real cash flow will run higher than shown, and vice versa.
Common Pitfalls
- Underestimating the operating expense ratio. New investors often assume 20-25% covers everything; seasoned operators frequently budget 35-50% once vacancy, maintenance, capital reserves, and management are honestly included, especially on older properties.
- Treating cap rate and cash-on-cash return as interchangeable. They answer different questions. Cap rate ignores your financing; cash-on-cash return is entirely a function of it. A deal can have a mediocre cap rate and an excellent cash-on-cash return if it is financed favorably, or the reverse.
- Failing to price in closing costs and upfront repairs when computing cash-on-cash return. Using only the down payment as "cash invested" overstates your return; total cash invested should include every dollar it took to close and make the unit rent-ready.
- Relying on the 1% rule as a pass/fail gate. It is a fast screening heuristic from an earlier, higher-interest-rate market era. In many current markets, few conventionally financed deals clear 1%, even genuinely good ones, so use it as a rough filter, not a rejection criterion on its own.
- Ignoring how sensitive cash flow is to the interest rate. Because the mortgage payment is calculated over 360 compounding periods, a 1 percentage point rate change can swing monthly cash flow by well over $100 on a $240,000 loan, easily flipping a marginal deal from cash-flow-positive to negative.
Frequently Asked Questions
What counts as "cash invested" for the cash-on-cash calculation?
Why did the baseline example fail the 1% rule but still show positive cash flow?
Is a higher cash-on-cash return always a better deal?
How does the down payment percentage affect cash flow?
What operating expense percentage should I use if I don't have historical data?
Does this calculator account for property appreciation over time?
Sources
- IRS Publication 527, Residential Rental Property (Including Rental of Vacation Homes), irs.gov/publications/p527
- Consumer Financial Protection Bureau, mortgage and amortization guidance, consumerfinance.gov
- Fannie Mae Selling Guide, investment property underwriting standards, selling-guide.fanniemae.com
Also consulted: National Association of Realtors, Commercial Real Estate Research and Investor Reports.