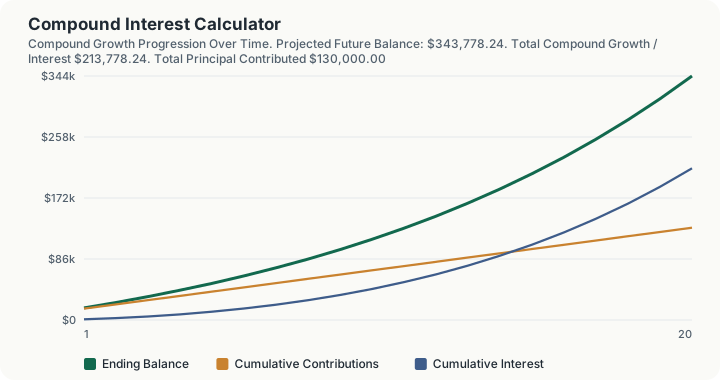
Quick Answer: Enter your starting deposit, monthly contribution, expected annual return, and time horizon to see your projected future balance, how much of that balance is interest versus your own contributions, and what it is worth in present purchasing power.
Overview
Compound interest is the mechanism by which a savings or investment account grows faster over time, because interest earned in earlier periods starts earning its own interest in later periods. The gap between a static back-of-envelope estimate and the real compounded outcome widens every year, which is why long-horizon savings goals, retirement accounts, and college funds are so sensitive to starting early rather than starting with a larger amount later.
This calculator is built for anyone projecting a savings or investment account forward with a fixed monthly contribution schedule, an emergency fund, a retirement account, a taxable brokerage account, or a dedicated savings goal. It takes an initial deposit, a monthly contribution amount, an expected annual return, an investment horizon in years, and an assumed inflation rate, and returns the projected future balance, the total interest earned, the total principal you actually contributed out of pocket, the inflation-adjusted real purchasing power of that future balance, and the effective annual yield your monthly-compounding rate translates to.
Unlike a simple interest estimate, this tool compounds monthly and adds your recurring contribution at the end of each month, which mirrors how most real-world savings and brokerage accounts with automatic monthly transfers actually accumulate. It also separates principal from interest in the output specifically so you can see how much of your eventual balance came from your own money versus growth.
How This Is Calculated
The calculator solves for future value using the standard time-value-of-money future value formula, applied monthly, with both a lump-sum principal and a level recurring monthly contribution:
FV = PV × (1 + i)^n + PMT × [((1 + i)^n − 1) ÷ i]
Where PV is the initial deposit, PMT is the monthly contribution, i is the monthly periodic rate (annual rate divided by 12), and n is the total number of months (years times 12). This is the solveFV function from the time-value-of-money primitive, run with contributions applied at the end of each period.
Total principal invested is simply the initial deposit plus the sum of every monthly contribution made over the horizon:
Total Principal = Initial Deposit + (Monthly Contribution × Total Months)
Total interest earned is the difference between the nominal future value and that total principal, which isolates the pure compounding effect from the money you actually put in:
Total Interest = Future Value − Total Principal
Real purchasing power discounts the nominal future value back to today's dollars using the entered inflation rate compounded over the same horizon, so a large nominal balance decades from now is shown alongside what it would actually buy at today's prices. Effective Annual Yield (APY) converts the nominal annual rate, compounded monthly, into the single annualized rate that produces the same growth over one year, which is always slightly higher than the stated nominal rate because of intra-year compounding. Every step runs through Decimal.js to avoid floating-point drift across the hundreds of compounding periods in a multi-decade projection.
Worked Example
Someone opening a taxable brokerage account wants to know what a modest but relentless habit turns into: $10,000 down, $500 every month, an 8.0% assumed annual return, 20 years, and 2.5% inflation to keep the answer honest.
Step 1 -- The monthly periodic rate. 8.0% / 12 = 0.666667% a month
Step 2 -- The number of compounding periods. 20 years x 12 = 240 months
Step 3 -- Month one interest on the opening balance. $10,000 x 0.666667% = $66.67
Step 4 -- Balance at the end of the first year. $10,000 grown for 12 months with $500 added each month = $17,054.96
Step 5 -- Interest earned in year one alone. $17,054.96 - $16,000 contributed to date = $1,054.96
The Second Year, and the Running Total
The whole argument for compounding is that year two is not a repeat of year one, because the interest itself now earns.
Step 6 -- Balance at the end of the second year. Year one's $17,054.96 carried forward, plus another $6,000 of contributions and a year of growth = $24,695.47
Step 7 -- Cumulative contributions after two years. $10,000 + ($500 x 24) = $22,000
Step 8 -- Cumulative interest after two years. $24,695.47 - $22,000 = $2,695.47
Step 9 -- Interest earned in year two by itself. $2,695.47 - $1,054.96 = $1,640.51
Year two produced 55% more interest than year one on only the same $6,000 of new money. Nothing changed except the size of the base.
Running It Out to Twenty Years
Step 10 -- Total principal contributed. $10,000 + ($500 x 240) = $130,000
Step 11 -- Nominal future value after 240 months. = $343,778.24
Step 12 -- Total interest earned. $343,778.24 - $130,000 = $213,778.24
Step 13 -- Effective annual yield. 8.0% nominal compounded monthly = 8.30% APY
Step 14 -- Real value in today's dollars. $343,778.24 discounted at 2.5% for 20 years = $209,797.87
The crossover is the number worth carrying away: at 20 years, $213,778.24 of interest exceeds the $130,000 actually deposited. Compounding has become the larger contributor. But step 14 is the discipline check -- in the purchasing power of today, that $343,778.24 buys what $209,797.87 buys now, so roughly 39% of the headline is inflation rather than wealth.
What This Does Not Account For
- Taxes on investment gains. The projected future value is a pre-tax figure. Interest, dividends, or capital gains in a taxable account will be reduced by income or capital gains taxes depending on account type; a tax-advantaged account like a 401(k) or IRA defers or eliminates that drag differently than a standard brokerage account.
- Variable or negative returns. The calculator assumes one constant annual return rate applied every month for the entire horizon. Real markets do not compound smoothly; sequence-of-returns risk means the actual path (not just the average rate) affects the real-world outcome, especially if withdrawals happen later.
- Investment fees and expense ratios. Fund management fees, advisory fees, or account maintenance charges are not deducted from the projected return; a fund with a 1% expense ratio effectively reduces your real annual return by roughly that amount.
- Contribution changes over time. The monthly contribution is held constant across the entire horizon; it does not model raises, contribution increases, or temporary pauses in saving.
- Employer matching or other outside contributions. If this models a retirement account with an employer match, that match should be added into the monthly contribution figure manually; the calculator does not add it automatically.
Common Pitfalls
- Confusing nominal return with effective annual yield. An 8% "annual return" compounded monthly actually produces about 8.30% in effective annual growth because interest earned in month one starts earning its own interest starting in month two; ignoring this understates true growth over long horizons.
- Overestimating a sustainable long-term return rate. Using an aggressive equity-market return assumption (10%+) uncritically for a multi-decade projection can produce a future balance far more optimistic than what a diversified, risk-appropriate portfolio is likely to actually deliver.
- Forgetting to account for inflation when setting a savings goal. A $1,000,000 nominal target 30 years from now buys meaningfully less than $1,000,000 today; the real purchasing power output exists specifically so you are not anchored to the larger, more impressive-looking nominal number.
- Treating the monthly contribution as static when income grows. Most savers increase their contribution amount over their career; modeling only a flat contribution understates realistic long-term outcomes for someone whose income is rising.
- Starting the projection late and trying to compensate with a higher assumed return. Because compounding is exponential in time, a longer horizon at a modest, realistic return usually outperforms a shorter horizon at an unrealistically high assumed return.
Frequently Asked Questions
Why is my total interest earned larger than my total contributions?
What is the difference between nominal future value and real purchasing power?
How does the monthly contribution timing affect the result?
What annual return rate should I use for a realistic projection?
Does this calculator account for FDIC or SIPC insurance limits?
Sources
- U.S. Securities and Exchange Commission, Investor.gov compound interest calculator methodology and investor education materials. investor.gov
- Federal Reserve Bank of St. Louis (FRED), historical CPI-U data used for inflation-adjusted purchasing power calculations. bls.gov/cpi
- Internal Revenue Service (IRS), Publication 590-A/B for tax treatment of retirement account growth. irs.gov/publications/p590a
Also consulted: Financial Industry Regulatory Authority (FINRA), guidance on effective annual yield and APY disclosure conventions.