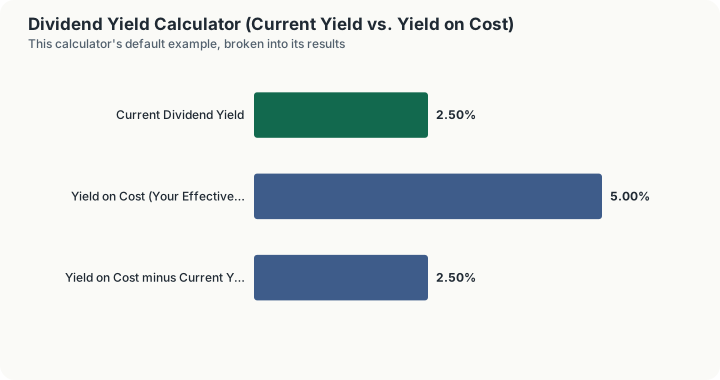
Quick Answer: A stock paying a $2.00 annual dividend at today's $80 share price has a 2.5% current yield, but an investor who bought the same stock years ago at $40 per share is earning a 5.0% yield on cost, twice the yield a new buyer receives today, purely because the share price rose after they bought.
Overview
Dividend yield is one of the most quoted, and most frequently misunderstood, numbers in investing. In its standard form, it answers a simple question: for every dollar you'd spend buying the stock today, how much annual dividend income would you receive? That makes it a snapshot measured against today's market price, useful for comparing how much income different stocks currently offer relative to their cost, but it says nothing about the yield an existing shareholder is actually experiencing on the money they already invested.
That is where yield on cost comes in. It uses the exact same formula, annual dividend divided by a share price, but divides by the investor's original purchase price instead of today's market price. If a stock's price has risen substantially since purchase, a long-term holder's yield on cost can be dramatically higher than the current yield a new buyer would receive, simply because the dividend is being measured against a much smaller original cost basis. This is a completely mechanical result of price appreciation and dividend growth over time, not a sign that the company is somehow paying existing shareholders more than new ones; every shareholder receives the same dividend per share regardless of when they bought.
Confusing the two is a common and consequential mistake. A stock quoted as having a "2.5% dividend yield" today might be delivering an effective 5% or higher return on a long-term holder's original investment, and conversely, a stock that looks attractively yield-rich today might represent a much smaller effective return for someone who bought in near a price peak.
How This Is Calculated
Current Dividend Yield:
Yield on Cost:
Both formulas use the identical annual dividend per share figure; the only difference is which price appears in the denominator. This calculator computes both using the platform's shared dividend yield function, simply passing a different price each time, which is why the two results move together whenever the dividend itself changes but diverge whenever the share price has moved since purchase.
Worked Example
Two investors hold the same stock and see two different yields, because yield is a ratio and only one of its two terms is shared. An investor bought at $40 a share some years ago; the stock trades at $80 today and pays $2.00 a share a year.
Step 1 -- The numerator, shared by both measures. Annual dividend per share = $2.00
Step 2 -- Current yield, using today's price. $2.00 / $80.00 = 0.025 = 2.50%
Step 3 -- Yield on cost, using the price actually paid. $2.00 / $40.00 = 0.05 = 5.00%
Step 4 -- The gap between them. 5.00% - 2.50% = 2.50 percentage points
Step 5 -- What drove the gap. ($80.00 - $40.00) / $40.00 = 100% price appreciation since purchase
Step 6 -- Annual income on a 1,000-share position. $2.00 x 1,000 = $2,000.00
The dividend did not change between steps 2 and 3. Only the denominator did, and it changed for one investor and not the other. This is why yield on cost is a record of a past decision rather than a fact about the stock.
Step 7 -- Now the company raises the dividend to $2.50 while the price stays at $80. Current yield: $2.50 / $80.00 = 3.125% Yield on cost: $2.50 / $40.00 = 6.25% Gap: 3.125 percentage points
Both figures rise together and the gap widens in proportion, because the price ratio between the two denominators is fixed at 2:1. Income on 1,000 shares rises from $2,000.00 to $2,500.00.
Step 8 -- The case nobody puts in a brochure: a stock that fell. Bought at $50, now trading at $30, paying $1.50 a share Current yield: $1.50 / $30.00 = 5.00% Yield on cost: $1.50 / $50.00 = 3.00% Gap: -2.00 percentage points, a 40% decline in price
Step 8 inverts the usual story. The 5.00% current yield here looks more attractive than the 2.50% in step 2, and it exists precisely because the price fell 40%. A yield that rose because the market marked the shares down is not the same object as a yield that rose because the company raised its payout, even though the arithmetic is identical.
Interpreting the Numbers
A high current yield is not automatically a good sign. Dividend yield rises whenever the share price falls (with the dividend held constant), which means unusually high yields sometimes signal a stock in distress, where the market has pushed the price down anticipating trouble, rather than an unusually generous company. This pattern is sometimes called a "dividend yield trap," where an attractive-looking yield precedes a dividend cut once the underlying business can no longer support the payout. Conversely, a low current yield is not automatically bad; younger or faster-growing companies often pay small or no dividends by design, reinvesting cash into growth instead, and can still deliver strong total returns through price appreciation.
Yield on cost is a backward-looking measure of an individual investor's personal outcome, not a market signal at all. It is useful for tracking how an income-focused investment has performed over the holding period, but it should never be compared against another investor's current yield or used to evaluate whether to buy more of the stock today; that decision should be based on the current yield and the company's outlook, not on a number that reflects a purchase price that is no longer available to anyone.
What This Does Not Account For
This calculator uses a static annual dividend per share figure; it does not project future dividend growth or account for the possibility of a dividend cut or suspension, both of which happen and can sharply change actual realized income going forward. It does not account for the tax treatment of dividends, which varies by account type (qualified dividends in a taxable account receive preferential tax rates versus ordinary dividends, while dividends inside tax-advantaged retirement accounts are generally not taxed in the year received). It does not include reinvested dividends compounding into additional shares over time (a DRIP), which changes the total income trajectory substantially from a simple static yield calculation. It does not account for currency effects on foreign dividend-paying stocks, where dividends declared in a foreign currency can fluctuate in dollar terms independent of the stated per-share amount.
Common Pitfalls
- Chasing unusually high current yields without checking sustainability. An abnormally high yield relative to a company's historical range or its sector peers often reflects a falling stock price pricing in a dividend cut, not a bargain.
- Comparing your yield on cost to someone else's current yield. These are not comparable numbers; yield on cost reflects your personal purchase price, while current yield reflects today's market price for a new buyer.
- Assuming yield on cost means you're earning that rate on your current holding's market value. Yield on cost measures return relative to your original cost basis, not relative to what the position is worth today; your total return also includes any price appreciation or decline.
- Ignoring dividend growth trends in favor of the current snapshot yield. A company with a lower current yield but a strong history of raising its dividend can produce a higher yield on cost within a few years than a company with a higher current yield but flat or declining payouts.
- Forgetting that yield alone ignores total return. A stock's total return includes both dividend income and price change; focusing exclusively on yield can lead to overlooking capital losses that offset or exceed the dividend income received.
Frequently Asked Questions
Why is my yield on cost so much higher than the stock's current yield?
Is a higher current dividend yield always better?
Does yield on cost change over time even if I don't buy more shares?
Should I use current yield or yield on cost to decide whether to buy more shares?
Are qualified and ordinary dividends taxed differently?
Sources
- U.S. Securities and Exchange Commission, Investor.gov, Dividend Yield. investor.gov
- Internal Revenue Service, Publication 550, Investment Income and Expenses (qualified vs. ordinary dividend treatment). irs.gov/publications/p550
- CFA Institute, Equity Valuation: Dividend Discount Models, CFA Program Curriculum. cfainstitute.org