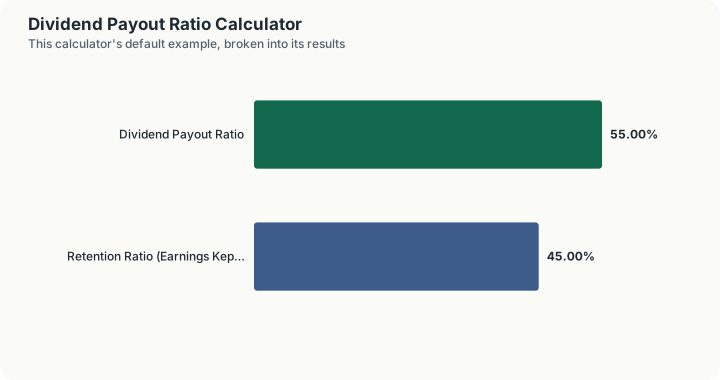
Quick Answer: A company paying $2.20 in annual dividends per share against $4.00 in earnings per share has a 55% dividend payout ratio, meaning it distributes 55% of its earnings to shareholders and retains the remaining 45%, generally within the range considered sustainable for a mature company outside specialized sectors like REITs and utilities.
Overview
The dividend payout ratio measures what share of a company's earnings it distributes to shareholders as dividends rather than retaining for reinvestment, debt paydown, or cash reserves. It is a direct window into a company's capital allocation priorities and, importantly, into how much cushion the dividend has if earnings decline. A company paying out nearly all of its earnings has very little room to absorb a bad year without cutting the dividend, while a company paying out a smaller share has considerably more flexibility.
The ratio can be calculated two mathematically equivalent ways: total dividends paid divided by total net income, or dividends per share divided by earnings per share (EPS). Both produce the identical percentage, since the number of shares outstanding cancels out of the ratio either way; use whichever figures are more readily available.
There is no single universally "correct" payout ratio, and this is the detail investors most often get wrong when applying a single rule of thumb across every company. What counts as a normal, sustainable payout ratio varies enormously by industry, business maturity, and even legal structure. A payout ratio that would be alarmingly high for a fast-growing technology company can be entirely normal, even required, for a real estate investment trust.
How This Is Calculated
Equivalently, using company-wide totals instead of per-share figures:
The complement of the payout ratio is the retention ratio (sometimes called the plowback ratio): the share of earnings the company keeps rather than distributes.
Worked Example
An analyst is checking whether a mature industrial's dividend has room to survive a bad year. The company reported $4.00 of trailing twelve-month diluted earnings per share and declared $2.20 per share in dividends over the same period.
Step 1 -- Dividends per share. = $2.20
Step 2 -- Earnings per share. = $4.00
Step 3 -- The payout ratio. $2.20 / $4.00 x 100 = 55.0%
Step 4 -- The retention ratio. 100% - 55.0% = 45.0%
Step 5 -- How far earnings could fall before the dividend is uncovered. $4.00 - $2.20 = $1.80 a share of cushion, which is a 45% drop in EPS
Step 5 is the reading that makes the ratio useful rather than decorative. Fifty-five percent does not mean "a bit more than half"; it means earnings can be cut almost in half before the dividend stops being funded by current profit. That is the number to hold against the company's own worst recent year.
The other 45% stays in the business, for reinvestment, debt reduction, buybacks or cash. A 55% payout sits in a broadly moderate band for an established company, but the band itself is sector-specific, and comparing this figure to a REIT's or a software company's would be meaningless.
What Counts as "Normal" Varies by Sector
Applying one fixed payout-ratio threshold across every company is one of the most common analytical mistakes in this area. As a general, sector-broad guide rather than a precise rule:
- Growth-oriented sectors (technology, biotech, early-stage companies) frequently retain nearly all earnings, running payout ratios near 0%, since reinvesting in growth typically produces a higher return than a cash dividend at that stage of the business.
- Mature, stable-cash-flow sectors (consumer staples, established industrials) often sustain payout ratios roughly in the 40-70% range over long periods, reflecting slower but steadier growth and less need to retain every dollar of earnings.
- Regulated utilities commonly run payout ratios well above 60%, sometimes 65-80% or higher, supported by comparatively predictable, regulated cash flows that make a high, stable payout more sustainable than it would be for a cyclical business.
- Real Estate Investment Trusts (REITs) are legally required to distribute at least 90% of taxable income to shareholders to maintain their favorable REIT tax status, so a payout ratio near or above 90% is structurally normal and expected for this sector, not a red flag the way it would be almost anywhere else.
Because of this sector variation, a payout ratio should generally be compared against a company's own historical range and its direct industry peers, not against a single fixed number applied indiscriminately across the whole market.
What This Does Not Account For
This calculator computes a single-period payout ratio from a snapshot of dividends and earnings; it does not account for earnings volatility, meaning a company with historically lumpy or cyclical earnings might show a misleadingly high or low ratio in any single year that does not reflect its typical sustainable payout over a full business cycle. It uses net income (or EPS) as the earnings base, which can be distorted in a given period by one-time charges, write-downs, or accounting items that do not reflect ongoing cash-generating ability; some analysts prefer a cash-flow-based payout ratio (dividends divided by free cash flow) for exactly this reason, which this calculator does not compute. It does not account for share buybacks, which many companies use alongside or instead of dividends to return capital to shareholders, and which are not reflected in a dividend-only payout ratio at all.
Common Pitfalls
- Applying one payout-ratio threshold to every company regardless of sector. A 90% payout ratio is a red flag for most companies but structurally required and normal for REITs; sector context matters enormously.
- Treating a single bad year's ratio as a permanent trend. A temporary earnings dip can spike the payout ratio for one period even if the underlying dividend and business are both healthy and sustainable over a full cycle.
- Ignoring the difference between an earnings-based and a cash-flow-based payout ratio. Net income can include non-cash items; a company can have a comfortable earnings-based payout ratio while actually straining its free cash flow to fund the dividend, or vice versa.
- Assuming a payout ratio above 100% always means an imminent dividend cut. It signals the dividend is not currently covered by reported earnings and deserves scrutiny, but companies can and do sustain this temporarily by funding the gap from cash reserves, provided it does not persist indefinitely.
- Overlooking buybacks as a form of capital return. A company with a modest or declining payout ratio may still be returning substantial capital to shareholders through share repurchases, which this ratio does not capture.
Frequently Asked Questions
What is considered a "good" dividend payout ratio?
What does a payout ratio above 100% mean?
Why do REITs have such high payout ratios?
Is a 0% payout ratio a bad sign?
Should I use net income or free cash flow to calculate payout ratio?
Sources
- CFA Institute, Dividends and Share Repurchases: Analysis, CFA Program Curriculum. cfainstitute.org
- Internal Revenue Code, Section 857 (REIT distribution requirements). irs.gov
- U.S. Securities and Exchange Commission, Investor.gov, Dividends. investor.gov