Quick Answer: The EV/EBITDA multiple divides a company's enterprise value by its EBITDA, giving a capital-structure-neutral way to compare valuation across companies with different debt levels.
Overview
The EV/EBITDA multiple is the workhorse valuation metric in private equity, M&A, and cross-company comparable analysis. Its appeal over the more commonly quoted Price-to-Earnings ratio comes down to one structural advantage: EBITDA sits above the interest line, so the multiple is unaffected by how a company chooses to finance itself. Two operationally identical companies, one funded mostly with equity and one funded mostly with debt, will show very different P/E ratios because of their different interest expense, but comparable EV/EBITDA multiples because both use enterprise value in the numerator and pre-interest earnings in the denominator.
This makes EV/EBITDA the default multiple for leveraged buyout analysis, since PE sponsors are actively choosing the leverage level as part of the deal and want a valuation yardstick that isn't distorted by that choice. It's also standard in sell-side M&A comparables, where target companies frequently have wildly different balance sheets going into a transaction.
The multiple is not a substitute for a full discounted cash flow analysis, but it is fast, requires only a handful of inputs, and is universally understood across investment banking, private equity, and corporate development, which is exactly why it shows up in nearly every deal teaser and comparable companies table.
How This Is Calculated
Step 1: Enterprise Value.
Enterprise Value represents the total cost to acquire the entire company, both its equity and its debt, netted against the cash the acquirer would immediately recoup. It is the "sticker price" for the whole operating business, independent of how that business happens to be financed today.
Step 2: The Multiple.
EBITDA (Earnings Before Interest, Taxes, Depreciation, and Amortization) approximates the cash-generating power of the core business before financing decisions, tax jurisdiction, and non-cash accounting charges enter the picture.
Worked Example
A target company reports:
- Equity Value (Market Cap): $40,000,000
- Total Debt: $15,000,000
- Cash & Equivalents: $5,000,000
- EBITDA: $6,250,000
Step 1: Enterprise Value:
Step 2: Multiple:
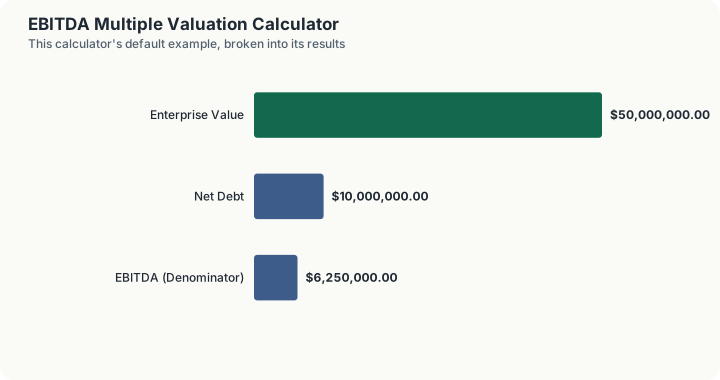
This company trades at 8.0x EV/EBITDA, squarely in the typical range for a stable, mid-market private company (roughly 5x-12x, depending on industry, growth rate, and competitive position). Net debt on this deal is $10,000,000 ($15,000,000 debt minus $5,000,000 cash), meaning debt-holders would need to be repaid before equity-holders in any sale of the underlying business.
Where the Valuation Bands Break
This calculator emits no tier schedule, so the sweep here is the input sweep. The one discontinuity in the outputs is the valuation band, and it sits on the multiple rather than on any dollar figure.
The band edges, walked. Hold enterprise value at $50,000,000 and move EBITDA. At $12,500,000 of EBITDA the multiple is 4.00x and the band reads Below-Average Multiple (Value/Distressed Range). At $8,333,333 the multiple is 6.00x and the band reads Mid-Market Multiple. At $6,250,000, the baseline, the multiple is 8.00x and the band is still Mid-Market. At $5,000,000 the multiple is 10.00x and the band remains Mid-Market. At $3,000,000 the multiple is 16.67x and the band reads Premium Multiple (Growth/Strategic Range). The label is the only output that steps; the multiple itself moves continuously.
Enterprise value is where the arithmetic actually happens. The engine adds total debt to equity value and subtracts cash: $40,000,000 plus $15,000,000 minus $5,000,000 gives $50,000,000, with net debt of $10,000,000. Each $1,000,000 of additional debt raises enterprise value by $1,000,000 and the multiple by 0.16x: at $16,000,000 of debt the engine returns $51,000,000 and 8.16x. Each $1,000,000 of additional cash lowers both: at $6,000,000 of cash it returns $49,000,000 and 7.84x.
Equity and debt move the multiple identically. Raising equity value by $1,000,000, to $41,000,000, returns the same $51,000,000 of enterprise value and the same 8.16x that an extra $1,000,000 of debt produced. That is the point of an enterprise value multiple and it is worth seeing demonstrated: the measure is indifferent to capital structure, which is exactly why it is preferred to a price-to-earnings ratio when comparing a leveraged business to an unleveraged one.
The reverse question. At the baseline enterprise value of $50,000,000, a target multiple of 6.00x requires $8,333,333 of EBITDA and a target of 10.00x requires $5,000,000. The distance between those two EBITDA figures, $3,333,333, is what four turns of multiple are worth at this size of business.
What the multiple does not tell you, and this engine cannot supply. There is no adjustment for EBITDA quality: owner compensation add-backs, one-off legal costs, deferred maintenance and capitalised software all change the denominator and none of them has an input here. Working capital normalisation, which is negotiated separately in almost every transaction and routinely moves consideration by more than a turn, is absent. Operating lease liabilities under IFRS 16 and ASC 842 are not added to net debt, so a lease-heavy business is understated against an owned-asset one. And the bands are labels rather than comparable-company evidence: a 16.67x software business and a 16.67x restaurant group both read Premium here.
What This Does Not Account For
- EBITDA quality and add-backs. EBITDA is not a GAAP-defined metric, and reported or "adjusted" EBITDA figures in deal materials frequently include seller-friendly add-backs (one-time expenses, owner compensation normalization, pro forma synergies) that inflate the denominator and understate the effective multiple actually being paid.
- Capital expenditure requirements. EBITDA excludes depreciation and amortization, but it does not exclude the actual cash capital expenditure a business needs to sustain itself. A capital-intensive business (manufacturing, telecom infrastructure) can show the same EBITDA multiple as an asset-light business (software, services) while requiring dramatically more reinvestment to sustain that earnings level.
- Working capital swings. The multiple says nothing about how much cash is tied up in receivables, inventory, or payables timing, which can materially affect the actual free cash flow available to equity holders even at a fixed EBITDA level.
- Growth rate differences. A static multiple treats a fast-growing company and a stagnant one identically if their trailing EBITDA happens to match, even though the market typically pays a growth premium reflected in a higher justified multiple.
- Minority interest and preferred equity. A fully rigorous enterprise value calculation also adds minority interest and preferred stock to the bridge from equity value to enterprise value; this calculator uses the simplified two-item bridge (debt and cash) appropriate for companies without significant minority or preferred claims.
Common Pitfalls
- Using net income multiples and EBITDA multiples interchangeably. P/E and EV/EBITDA are not directly comparable numbers; P/E sits below interest, taxes, depreciation and amortization while EV/EBITDA sits above all four. Confusing the two produces valuation conclusions that are simply wrong.
- Not normalizing EBITDA before applying the multiple. Buyers who apply a market multiple to unadjusted, seller-reported EBITDA without their own quality-of-earnings review routinely overpay, since EBITDA add-backs in a confidential information memorandum are prepared by a party with an incentive to maximize the reported figure.
- Forgetting the enterprise-to-equity bridge runs both directions. EV/EBITDA gets you to enterprise value; to determine what an equity holder actually receives, you still need to subtract net debt (and any preferred or minority interest) back out.
- Applying a public-market multiple to a private, illiquid business without a discount. Public comparable multiples typically embed a liquidity premium that a private, harder-to-sell business should trade at a discount to, all else equal.
- Ignoring the multiple's sensitivity to leverage assumptions in an LBO context. In a leveraged buyout, the entry multiple, exit multiple, and leverage level interact; a small change in assumed exit multiple can swing projected equity returns dramatically more than a similarly sized change in operating performance.
Frequently Asked Questions
What is a "good" EV/EBITDA multiple?
Why use Enterprise Value instead of just Equity Value (Market Cap)?
Why subtract cash when computing Enterprise Value?
Is EBITDA the same as free cash flow?
How does the EV/EBITDA multiple relate to a leveraged buyout?
Sources
- U.S. Small Business Administration, the official authority for the business this calculator relates to. sba.gov
Also consulted: Investopedia, "Enterprise Value (EV): Formula and Why It Matters in M&A"; Corporate Finance Institute (CFI), "EV/EBITDA Multiple"; Investopedia, "EBITDA: Meaning, Formula, and History".