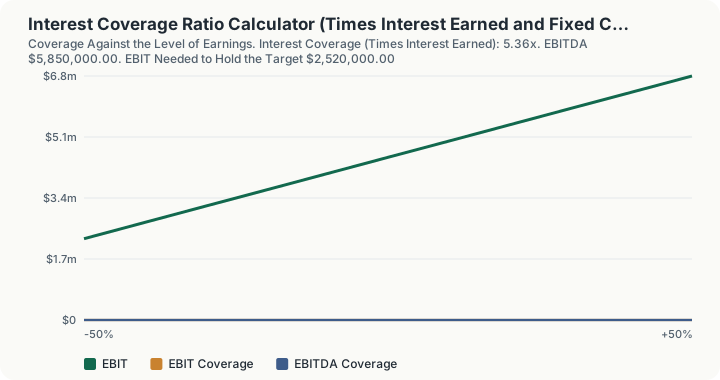
Quick Answer: A company with $4.5m of EBIT against $840,000 of interest covers its interest 5.36 times. On the same figures the EBITDA version is 6.96x, fixed charge coverage is 4.05x, and coverage including principal repayments is 4.06x. All four are called "coverage" and they span a range of nearly three turns, so the one being quoted matters as much as the number itself.
What does this calculator do?
Interest coverage asks a single question: how many times over could this year's earnings pay this year's interest bill? A ratio of 1.0 means every dollar of operating profit goes to the lender. Below 1.0 the company is funding interest from cash reserves, asset sales or new borrowing.
The complication is that "coverage" names at least four different fractions, and the differences between them are not cosmetic:
- Times interest earned uses EBIT. It is the conservative and most commonly cited version.
- EBITDA coverage adds depreciation and amortisation back, on the grounds that interest is paid in cash and depreciation is not. It is always the higher figure.
- Fixed charge coverage adds rent to both halves of the fraction, so a company that leases its premises is not flattered relative to one that mortgaged them.
- Debt service coverage adds scheduled principal repayments to the denominator, because principal is what actually forces a refinancing.
This page computes all four from one set of inputs rather than letting you pick the flattering one, then inverts the first to answer the two questions a covenant actually raises: how far can earnings fall before the ratio breaks, and how much debt would these earnings support?
How is this calculated?
- Build EBITDA from EBIT. Depreciation and amortisation are added to operating profit. Nothing else is added back.
EBITDA = EBIT + D&A
- Divide EBIT by the interest expense. This is times interest earned, the headline figure.
TIE = EBIT/Interest
- Divide EBITDA by the same interest expense. The numerator changes; the denominator does not.
Coverage_EBITDA = (EBIT + D&A)/Interest
- Add lease and rent expense to both halves for fixed charge coverage. Rent appears in the numerator because it was already deducted in reaching EBIT, and in the denominator because it is a contractual charge like interest.
FCCR = (EBIT + Rent)/(Interest + Rent)
- Add scheduled principal to the denominator for debt service coverage. EBITDA over the full year's debt service.
DSCR = EBITDA/(Interest + Principal)
- Multiply the interest bill by the target coverage to get the EBIT floor. The cushion is current EBIT less that floor, and the percentage is the cushion divided by current EBIT.
EBIT_floor = Target × Interest
- Divide EBIT by the target coverage times the borrowing rate to get the debt ceiling. The same inversion evaluated at the current coverage gives the debt the present interest bill implies, and the headroom is the difference between the two. Because one function produces both, they cannot disagree with each other.
Debt_max = EBIT/(Target × r)
The table repeats steps 2 and 3 with EBIT moved from 50% below to 50% above its entered level, holding the interest bill fixed.
Worked Example
A mid-market company reports EBIT of $4,500,000, depreciation and amortisation of $1,350,000, interest of $840,000, rent of $360,000 and $600,000 of principal falling due. It borrows at an average 7% and its covenant requires 3.0x coverage.
Step 1: Times interest earned. $4{,}500{,}000 / 840{,}000 =$ 5.36x
Step 2: On EBITDA instead. $(4{,}500{,}000 + 1{,}350{,}000) / 840{,}000 = 5{,}850{,}000 / 840{,}000 =$ 6.96x
Adding back depreciation improves the ratio by 1.6 turns, or 30%, without a single dollar changing hands. This is why the definition needs stating whenever the number is quoted.
Step 3: Fixed charge coverage. $(4{,}500{,}000 + 360{,}000) / (840{,}000 + 360{,}000) = 4{,}860{,}000 / 1{,}200{,}000 =$ 4.05x
Step 4: Including principal repayments. $5{,}850{,}000 / (840{,}000 + 600{,}000) = 5{,}850{,}000 / 1{,}440{,}000 =$ 4.06x
The four measures span 4.05x to 6.96x on identical figures. Nothing about the company changed between step 1 and step 4.
Step 5: The EBIT floor for a 3.0x covenant. $3.00 \times 840{,}000 =$ $2,520,000
Step 6: The cushion. $4{,}500{,}000 - 2{,}520{,}000 = 1{,}980{,}000$, which is 44.0% of current EBIT.
That is the number to carry away. Earnings can fall by 44% before the covenant is breached, which for a stable business is comfortable and for a cyclical one is not.
Step 7: The debt the interest bill implies. $840{,}000 / 0.07 =$ $12,000,000
Step 8: The debt these earnings would support at 3.0x. $4{,}500{,}000 / (3 \times 0.07) = 4{,}500{,}000 / 0.21 =$ $21,428,571.43
Step 9: Borrowing headroom. $21{,}428{,}571.43 - 12{,}000{,}000 =$ $9,428,571.43
Now the two shocks that actually happen.
Step 10: Earnings fall 40%. $2{,}700{,}000 / 840{,}000 =$ 3.21x. Coverage falls in exact proportion to EBIT, because the interest bill does not fall with it. That proportionality is the reason coverage ratios deteriorate so quickly in a downturn.
Step 11: The interest bill doubles on refinancing. A borrower moving from a 3.5% legacy fixed rate to 7% sees interest go from $840,000 to $1,680,000, and coverage halve to 2.68x, below the covenant. Nothing operational changed. The implied debt is now $24,000,000 against a $21,428,571 ceiling, so the headroom is negative $2,571,428.57.
Steps 10 and 11 are the two ways a covenant breaks, and only the first is about the business.
What does this calculator not account for?
- Cash interest versus accrued interest. Payment-in-kind interest and capitalised interest do not leave the business this year but appear in the expense line. Coverage on accrued interest understates the cash position.
- Interest income. Gross interest expense is used. A company with large cash balances earning interest has better net coverage than this shows.
- Seasonality. These are annual figures. A business that earns its profit in one quarter and pays interest quarterly can breach a covenant on a testing date while comfortably covering interest for the year.
- Undrawn facilities and cash on hand. Liquidity is not coverage. A company with thin coverage and a large committed facility is in a different position from one with neither.
- The maturity wall. Only the principal you enter is counted. A bullet repayment two years out is invisible here.
- How the covenant is actually defined. Credit agreements define EBITDA with their own list of permitted add-backs, and those definitions routinely allow more than depreciation and amortisation. The figure your lender tests may differ from any of the four here.
- Tax. Interest is generally deductible, so the after-tax cost is lower than the expense line, and some jurisdictions cap that deductibility.
- A borrowing rate that varies by tranche. One average rate translates the ratio into a debt balance, so the implied debt figure will differ from the balance sheet where several loans carry different rates.
What mistakes do people make with this?
- Quoting EBITDA coverage as "interest coverage". It is systematically higher, by 30% in the example above. Both are legitimate; using one label for the other is not.
- Taking EBIT after interest. If interest has already been deducted, the ratio is understated by exactly one turn. Start from operating profit.
- Netting interest income against interest expense. Some definitions allow it and some do not. Decide which you are using before comparing against a benchmark.
- Reading a high ratio as a strong balance sheet. Coverage is a flow measure. A company with 8x coverage and a bullet maturity next year is in more trouble than one with 3x coverage and a ten year amortising loan.
- Comparing across industries. A regulated utility runs comfortably at 3x. A software company at 3x would be considered heavily borrowed. The ratio is only meaningful against sector peers.
- Forgetting that leases are debt in substance. A company that sold and leased back its premises reports lower interest and higher rent, which flatters times interest earned and leaves fixed charge coverage unchanged. That is exactly what the fixed charge version is for.
- Testing the covenant only at year end. Most agreements test quarterly on a rolling twelve month basis, so a weak quarter can breach long before the annual figures show it.
Frequently Asked Questions
What is a good interest coverage ratio?
Why is the EBITDA version always higher?
Which ratio do lenders actually test?
Why does the implied debt not match my balance sheet?
What does the EBIT cushion percentage tell me?
Does interest coverage measure solvency?
Sources
- U.S. Small Business Administration, the official authority for the business this calculator relates to. sba.gov
There is no statutory or regulatory source for these formulas, and none is invented here. Times interest earned, EBITDA interest coverage, fixed charge coverage and debt service coverage are conventions of credit analysis rather than legal constructs, and each is defined slightly differently by different users. Where a definition does bind, it is the one written into a particular credit agreement, which supersedes every general convention for that borrower and is not something this page can know.
The implementations are interestCoverageRatio, ebitdaInterestCoverage, fixedChargeCoverage, ebitdaToDebtService, maxDebtAtInterestCoverage and ebitRequiredForCoverage in engine/primitives/ratios.ts, proven against hand-derived vectors in engine/vectors/ratios.test.ts and in this calculator's own vectors.test.ts. Related pages: the DSCR loan calculator for the property lending version of the same idea, the operating leverage calculator for why earnings move faster than revenue in the downturn case above, and the DuPont analysis calculator for where the leverage shows up in returns.