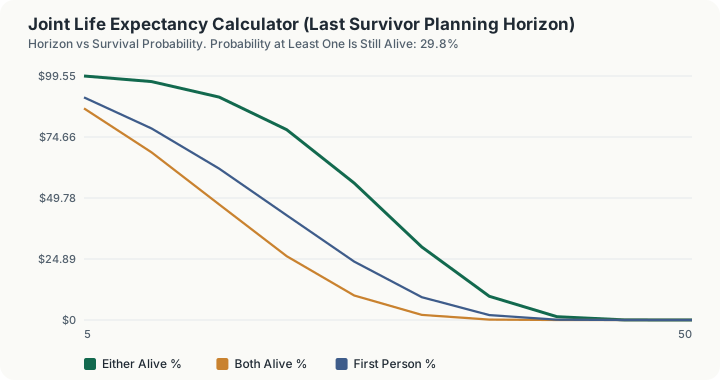
Quick Answer: For a male aged 65 and a female aged 63, there is a 29.8% chance at least one of them is alive in thirty years: at ages 95 and 93. Individually the odds are only 9.3% and 22.6%. The couple's horizon is 7.2 percentage points longer than the stronger individual's, which is exactly the longevity risk single-life planning misses.
What does this calculator do?
For a couple, the money has to last until the last survivor dies, not until either individual's life expectancy. Those are very different horizons, and planning to the wrong one is a systematic error.
The arithmetic is unintuitive. Two people each with a modest chance of reaching a given age have a substantially higher combined chance that at least one of them does. Here, a 9.3% and a 22.6% individual probability combine to 29.8%.
The gap widens as the horizon shortens. Over twenty-five years the joint probability is 55.9%: better than even that one of them is still alive, and still spending.
This page reads mortality from the SSA period life table held in the engine rather than assuming a fixed horizon.
How is this calculated?
Individual survival to a target age is the product of annual survival rates drawn from the SSA table:
pᵢ = ∏(t = 0 to n − 1) (1 − q_(age + t))
The two lives are then combined assuming independence:
P(both) = p₁ × p₂
P(at least one) = 1 − (1 − p₁)(1 − p₂)
So for the default couple: both alive is 0.093 × 0.226 = 2.1%, and at least one alive is 1 − (0.907 × 0.774) = 29.8%.
Worked Example
A husband of 65 and a wife of 63 are setting the horizon for a withdrawal plan. The question is not how long each expects to live but how long the money has to last.
Step 1: His chance of reaching 95. Chaining thirty annual survival rates from the SSA table, age 65 male: 9.3%
Step 2: Her chance of reaching 93. The same product over thirty years, age 63 female: 22.6%
Step 3: Both still alive at that point. 0.093 x 0.226 = 2.1%
Step 4: Neither still alive. (1 - 0.093) x (1 - 0.226) = 0.907 x 0.774 = 70.2%
Step 5: At least one still alive. 1 - 0.702 = 29.8%
Step 6: The uplift over the stronger individual. 29.8% - 22.6% = 7.2 percentage points
Step 6 is the number a single-life plan throws away. It is the portion of longevity risk that exists only because there are two people.
Now watch the same couple year by year, because the shape matters more than any single figure:
Step 7: At ten years, ages 75 and 73. At least one alive: 97.26%, both alive: 68.36%
Step 8: At twenty years, ages 85 and 83. At least one alive: 77.65%, both alive: 26.05%
Step 9: At twenty-five years, ages 90 and 88. At least one alive: 55.86%, both alive: 10.01%
Step 10: At thirty years, the figure from Step 5. At least one alive: 29.80%, both alive: 2.10%
Step 11: Where the coin flip actually falls. Between years 25 and 30. At year 25 it is still more likely than not that one of them is living, and a plan built to either partner's own life expectancy has been exhausted for years by then: his runs to age 83.1 (18.1 remaining years), hers to 85.3 (22.3 remaining), and the later of those two, 85.3, arrives at year 22 of a horizon that has not yet reached even odds.
Three variations on the same arithmetic:
Step 12: The same couple over twenty-five years. At least one alive 55.9%, both 10.0%, an uplift of 13.8 pts over her 42.1% alone
Step 13: Two 55-year-olds over forty years. At least one alive 22.3%, individual odds 8.4% and 15.2%, uplift 7.1 pts
Step 14: Two women aged 65 and 63 over thirty years. At least one alive 35.1% rather than 29.8%, and the uplift widens to 12.5 pts, because female mortality is lower at every age in the table
What does this calculator not account for?
- Independence. The calculation assumes the two lives are statistically independent. In reality couples share environment, habits and healthcare access, and there is a well-documented widowhood effect. True joint survival is slightly different from the product of two independent probabilities.
- Individual health. Population tables say nothing about your own circumstances. Smoking status, chronic conditions and family history move these figures far more than the averages suggest.
- Socioeconomic gradient. Life expectancy varies substantially by income and education, and the SSA table is a national average across all of them.
- Future mortality improvement. Period tables use current rates. If mortality continues improving, these probabilities understate survival.
- Annuity and pension pricing, which uses insurer tables with different assumptions and loadings.
- Required Minimum Distribution joint tables, which are prescribed by the IRS and differ from these figures.
- The financial consequences. This gives a horizon, not a plan. Pair it with the retirement Monte Carlo simulator to test whether the money lasts that long.
What mistakes do people make with this?
- Planning to one person's life expectancy. For a couple this is the single most common and most expensive error. Money is needed until the last survivor dies.
- Planning to the average of the two. The relevant figure is the maximum, not the mean, and probabilistically it is longer than either.
- Treating life expectancy as a deadline. It is a median. Roughly half of people outlive it, which is precisely the risk being planned against.
- Ignoring the survivor's changed finances. The last survivor typically loses one Social Security benefit and may lose pension income, while household costs fall by much less than half.
- Assuming the joint figure is just the higher individual one. It is meaningfully higher: 29.8% against 22.6% here.
- Using population averages for an individual in poor or excellent health. These are national averages and should be adjusted by judgement.
Frequently Asked Questions
Why is the joint probability higher than either individual one?
What planning horizon should a couple use?
Does this assume the two deaths are independent?
Why do the sexes differ so much?
Is this the same as the IRS joint life table?
Should I use this instead of my own health information?
Sources
- Social Security Administration, Office of the Chief Actuary, Actuarial Life Table: the 2023 period life table used in the 2026 Trustees Report, held in engine/tables. ssa.gov/oact/STATS/table4c6.html
- IRS Publication 590-B, Distributions from Individual Retirement Arrangements (life expectancy tables). irs.gov/publications/p590b
- Social Security Administration, Office of the Chief Actuary, Actuarial Life Table. ssa.gov/oact/STATS/table4c6.html
Also consulted: Joint survival is computed as one minus the product of the two individual failure probabilities, the standard independence assumption; Remaining life expectancy figures are read from the same table by age and sex.