Quick Answer: Jensen's Alpha measures whether a portfolio manager beat the return predicted by the Capital Asset Pricing Model for the amount of market risk taken, calculated as Alpha = Portfolio Return minus [Risk-Free Rate plus Beta times (Market Return minus Risk-Free Rate)].
Overview
Jensen's Alpha, sometimes written as Jensen's Performance Index, was introduced by Michael Jensen in 1968 as a way to separate genuine stock-picking or timing skill from returns that a portfolio would have earned simply by taking on more market risk. Two managers can both post a 12% return in a given year, but if one did it with a beta of 0.8 and the other with a beta of 1.6, the first manager delivered far more value per unit of risk. Raw return numbers hide this difference. Jensen's Alpha corrects for it.
The calculation rests on the Capital Asset Pricing Model (CAPM), which states that the expected return of any asset or portfolio is the risk-free rate plus a risk premium proportional to its beta. Jensen's Alpha is simply the gap between what a portfolio actually earned and what CAPM said it should have earned given its beta. A positive alpha means the manager generated abnormal return above the CAPM benchmark. A negative alpha means the manager underperformed what pure market exposure at that beta would have delivered, and investors would have been better off in a low-cost index fund scaled to match the same beta.
This calculator is built for analysts, financial advisors, and individual investors who want to check a fund's reported "alpha" against the underlying CAPM math rather than trusting a marketing brochure. It takes four inputs, the portfolio's realized return, the risk-free rate, the market's return, and the portfolio's beta, and returns the alpha along with the intermediate CAPM expected return so you can see exactly how the number was built.
How This Is Calculated
Jensen's Alpha follows directly from the Capital Asset Pricing Model. CAPM defines the expected return of a portfolio as:
Where $R_f$ is the risk-free rate, $\beta_p$ is the portfolio's beta relative to the market, and $R_m$ is the market's return. The term $(R_m - R_f)$ is the market risk premium, the extra return investors demand for holding market risk instead of a risk-free asset.
Jensen's Alpha is then the difference between the portfolio's actual realized return and this CAPM-predicted expected return:
The calculator performs this in three steps. First it computes the market risk premium by subtracting the risk-free rate from the market return. Second it multiplies that premium by beta and adds the risk-free rate back in to get the CAPM expected return. Third it subtracts the CAPM expected return from the portfolio's actual return to get alpha. All arithmetic runs on arbitrary-precision Decimal values so percentage inputs never accumulate binary floating-point rounding error.
Worked Example
Consider a portfolio with the following annualized figures for the period under review:
- Portfolio Return ($R_p$): 12.5%
- Risk-Free Rate ($R_f$): 4.0% (approximating a 3-month Treasury bill yield)
- Market Return ($R_m$): 9.0% (approximating the S&P 500 total return)
- Portfolio Beta ($\beta_p$): 1.2
Step 1: Market risk premium.
Step 2: CAPM expected return.
Step 3: Jensen's Alpha.
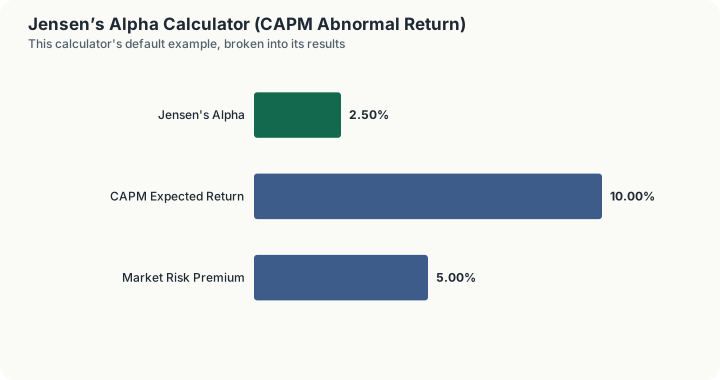
The portfolio earned 2.5 percentage points more than a CAPM-consistent benchmark with the same beta would have predicted. That 2.5% is the abnormal return attributable to the manager's decisions rather than to market exposure.
What This Does Not Account For
Jensen's Alpha is a single-factor model built on beta as the only measure of risk, and it carries real limitations. It does not separate skill from luck over a single measurement period; a positive alpha in one year can easily reverse the next. It assumes beta is stable over the measurement window, when in practice a fund's market sensitivity can drift as its holdings change. It ignores other priced risk factors such as size, value, and momentum that multi-factor models like Fama-French capture but CAPM does not. It does not adjust for fees, taxes, or trading costs unless you net those out of the portfolio return before entering it. It also assumes the chosen benchmark is the correct proxy for "the market" for that portfolio's strategy, which is often untrue for sector funds, international funds, or alternative strategies benchmarked against a broad domestic index.
Common Pitfalls
- Using an inconsistent measurement period. Beta, portfolio return, and market return must all be calculated over the same time window, or the alpha figure is meaningless.
- Mismatching the risk-free rate's tenor to the horizon. A 10-year Treasury yield used for a 1-month alpha calculation introduces a subtle but real error; match the risk-free proxy's maturity to your measurement period.
- Treating a single-period alpha as proof of skill. Statistical significance requires many periods of data and an estimate of the standard error, not one calculation.
- Using a stale or mismatched beta. A beta pulled from a data provider that used a different lookback window or benchmark than the one used for the market return input will distort the result.
- Forgetting that alpha is relative to a specific benchmark. A fund can show positive alpha against one index and negative alpha against another; always state which benchmark was used.
Frequently Asked Questions
What does a negative Jensen's Alpha mean?
Is a higher beta always better if alpha stays positive?
How is Jensen's Alpha different from the Sharpe Ratio?
What risk-free rate should I use?
Can Jensen's Alpha be negative even when the portfolio's raw return is positive?
Sources
- CFA Institute. Capital Asset Pricing Model and Portfolio Performance Evaluation, CFA Program Curriculum. cfainstitute.org
- U.S. Department of the Treasury. Daily Treasury Par Yield Curve Rates (risk-free rate reference data). home.treasury.gov/resource-center/data-chart-center/interest-rates/TextView
- U.S. Securities and Exchange Commission, Investor.gov, the official authority for the investing this calculator relates to. investor.gov
Also consulted: Jensen, Michael C. "The Performance of Mutual Funds in the Period 1945-1964." Journal of Finance, 1968; Sharpe, William F. "Capital Asset Prices: A Theory of Market Equilibrium under Conditions of Risk." Journal of Finance, 1964.