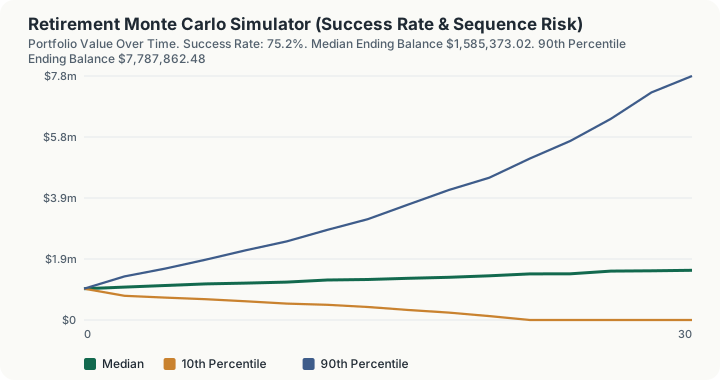
Quick Answer: Withdrawing $40,000 a year from a $1,000,000 portfolio over thirty years, with a 7% expected return and 15% volatility, succeeds in 75.2% of 2,000 simulated runs. Drop the volatility to 8% and the same average return succeeds 97.0% of the time. That gap is sequence-of-returns risk: the order of returns matters as much as their average.
What does this calculator do?
A Monte Carlo simulation runs a retirement plan thousands of times against randomly generated return sequences and reports how often the money lasts. It answers a question a simple average cannot: not what happens on average, but how often the plan fails.
The central insight is that the order of returns matters enormously. Two retirements with identical average returns can end very differently depending on when the bad years arrive. A crash in year two, while the portfolio is large and withdrawals have barely begun, is far more damaging than the same crash in year twenty-five.
The scenarios on this page demonstrate that directly. Holding the 7% average return constant and cutting volatility from 15% to 8% raises the success rate from 75.2% to 97.0%. Nothing about the expected return changed.
How is this calculated?
The engine runs 2,000 simulated retirements. Each one works as follows:
Step 1: Start. The portfolio opens at your retirement balance, and the first year's withdrawal is set at the amount you entered.
Step 2: Draw a return. For each year the engine samples a standard normal variate and converts it to an annual return using geometric Brownian motion:
rₜ = e^((μ − σ²/2) + σzₜ) − 1
where μ is the expected return, σ the volatility, and zₜ a standard normal draw.
Step 3: Apply the return, then withdraw. The balance grows by that return and the year's withdrawal is taken at the end of the year:
Bₜ = B_(t − 1)(1 + rₜ) − Wₜ
Step 4: Inflate next year's withdrawal. W_(t + 1) = Wₜ × (1 + i), so spending power is held constant.
Step 5: Test for ruin. If the balance reaches zero or below in any year, the run is marked failed, its balance is pinned at zero for every remaining year, and the failure year is recorded.
Step 6: Aggregate. The success rate is the share of the 2,000 runs that never hit zero. The ending balances are sorted and the 10th, 50th and 90th percentiles reported, and the same percentiles are taken for every year to produce the trajectory table.
This simulation is deterministic. The random numbers come from a Mulberry32 generator running from a fixed seed, and the run count is fixed at 2,000, so the same inputs always return the same success rate: reload the page and 75.2% is still 75.2%. That is a deliberate choice, and the vectors pin it. A retirement projection that produced a different number on every page load would not be worth acting on, and would make two people comparing plans unable to tell a real difference from noise.
Worked Example
Consider the textbook case: a $1,000,000 portfolio, $40,000 drawn in year one, a thirty-year horizon, 7% expected return, 15% volatility and 2.5% inflation.
Step 1: The withdrawal rate. $40,000 / $1,000,000 = 4.00%
Step 2: Runs that never hit zero. 1,504 of 2,000 = 75.2% success rate
Step 3: The middle outcome. Median ending balance after thirty years = $1,585,373.02
Step 4: The unlucky tail. 10th percentile ending balance = $0, which is to say a failed run
Step 5: The lucky tail. 90th percentile ending balance = $7,787,862.48
The verdict the calculator returns is Workable but exposed: roughly one run in four fails. The spread is the real finding. The same plan, the same withdrawals, the same average return, can plausibly end with nothing or with nearly eight million dollars. That range, not the median, is what a retirement decision actually has to accommodate.
Where the paths separate
Because the engine records percentiles for every year, you can watch the fan open. Taking the median and the two tails straight from the computed trajectory:
Step 6: Year 0. Median $1,000,000, 10th percentile $1,000,000, 90th percentile $1,000,000
Step 7: Year 10. Median $1,209,803, 10th percentile $524,545, 90th percentile $2,507,630
Step 8: Year 20. Median $1,411,847, 10th percentile $126,030, 90th percentile $4,540,990
Step 9: Year 30. Median $1,585,373, 10th percentile $0, 90th percentile $7,787,862
Notice what the median does: it barely moves. Over thirty years it rises from $1,000,000 to $1,585,373, because a 4% withdrawal against a 7% return leaves only a thin margin once inflation lifts the withdrawal every year. Meanwhile the 10th percentile falls the whole way, crossing into ruin somewhere after year 20. The plan is not slowly winning or slowly losing; it is doing both, in different runs, and the average conceals it.
The three variations worth running
Step 10: Withdraw $50,000 instead. A 5% rate gives a 55.9% success rate and a median ending balance of $383,739.62
Step 11: Retire for forty years rather than thirty. Success rate 60.0%, median ending balance $1,097,272.42
Step 12: Keep the 7% return but cut volatility to 8%. Success rate 97.0%, and the 10th percentile stops being zero: $559,542.64
Step 12 is the most important number on the page. Nothing about the expected return changed. Only the variability around it did, and the failure rate fell from roughly one in four to roughly one in thirty-three. That is sequence-of-returns risk stated as plainly as it can be: what kills a retirement is not the average, it is the order in which the good and bad years arrive.
The First Two Years, and the Year the Tail Fails
Step 13: Year two. Median $1,050,872, 10th percentile $773,558, 90th percentile $1,391,078. Two years in, the spread between the tails is already $617,520, roughly 62% of the starting portfolio.
Step 14: Year four. Median $1,101,792, 10th percentile $714,719, 90th percentile $1,641,252. The unlucky decile has lost more than a quarter of its capital while the median is up.
Step 15: Year 22, where the 10th percentile reaches zero. Median $1,472,093, 10th percentile $0, 90th percentile $5,153,169. This is the first recorded year in which the unlucky decile is ruined.
The failing runs are identifiable within the first four years and terminal by year 22. That is the practical use of the fan: a retiree who is in the bottom decile at year four is not experiencing noise that will average out, and the eight years between year 14, where the 10th percentile still holds $415,460, and year 22, where it holds nothing, are the entire window in which cutting spending would still change the outcome.
What does this calculator not account for?
- Why this shows 75% where the 4% rule is often quoted at 95%. Those figures come from historical sequences of US returns, which include mean reversion and specific correlations. This model draws returns independently from a lognormal distribution, which produces harsher tails. Neither is wrong; they answer slightly different questions, and the difference is worth knowing before comparing the two.
- Flexible spending. Real retirees cut back after a bad year. Every model that assumes rigid inflation-adjusted withdrawals overstates failure.
- Taxes, which differ by account type and materially change the sustainable withdrawal.
- Social Security, pensions and annuities, which provide income floors that dramatically raise success rates.
- Fees. Subtract your all-in cost from the expected return before entering it.
- Changing asset allocation over time, including glide paths.
- Long-term care and other lumpy late-life expenses.
- Mean reversion and valuation. Returns are drawn independently, so the model does not know that poor decades often follow expensive markets.
- Mortality. The simulation runs the full term regardless of whether you are alive for it.
What mistakes do people make with this?
- Treating the success rate as a probability of the future. It is the share of runs under one set of assumptions. Change the expected return by a point and the number moves substantially.
- Chasing 100%. A plan with a 100% success rate is usually one that underspends badly. Most planners treat 80% to 90% as sound, given that real retirees adjust spending.
- Ignoring volatility. It is not a secondary input. At the same 7% average return, moving from 15% to 8% volatility changes the success rate by nearly 22 percentage points.
- Using nominal returns with real withdrawals, or vice versa. Here the return is nominal and withdrawals are inflated each year, which is internally consistent. Mixing conventions is not.
- Forgetting fees. A 7% gross return with 1% of fees is a 6% net return, and the difference over thirty years is large.
- Reading the median as the expected outcome. The distribution is wide and right-skewed. The 10th percentile matters far more for planning than the median does.
Frequently Asked Questions
What success rate should I aim for?
Why does this show 75% when the 4% rule is usually quoted at 95%?
What is sequence-of-returns risk?
Why does lowering volatility help so much?
Does this include taxes?
Will I get the same answer twice?
Sources
- Metropolis, N. and Ulam, S. (1949), "The Monte Carlo Method," Journal of the American Statistical Association 44(247). doi.org/10.1080/01621459.1949.10483310
- Milevsky, M. A. and Robinson, C. (2005), "A Sustainable Spending Rate without Simulation," Financial Analysts Journal 61(6). doi.org/10.2469/faj.v61.n6.2776
Also consulted: Standard Monte Carlo methodology for retirement portfolio sustainability, using lognormal return draws with a specified mean and volatility; The simulation uses a seeded Mulberry32 generator for full reproducibility, and runs 2,000 paths per calculation; No jurisdictional or statutory data is involved; all inputs are user-supplied assumptions.