Quick Answer: The Treynor Ratio measures how much excess return a portfolio earned for every unit of market risk (Beta) it carried, making it the right tool for comparing already-diversified portfolios where company-specific risk has largely been eliminated.
Overview
Jack Treynor introduced this measure in 1965, a few years before William Sharpe published his own risk-adjusted return ratio. Both formulas divide a portfolio's excess return, meaning its return above the risk-free rate, by some measure of risk. The difference is entirely in the denominator.
The Sharpe Ratio divides by total volatility, the standard deviation of all returns. That includes both systematic risk (the risk shared by the whole market) and unsystematic risk (risk specific to individual holdings, like a single company's earnings miss). Total volatility is the right yardstick for a portfolio that is not fully diversified, because unsystematic risk still matters to that investor.
Beta stands in for that denominator in the Treynor Ratio: a single number that captures only systematic risk, the portion of a portfolio's movement that is explained by the broader market. This makes Treynor the more appropriate measure once a portfolio is diversified enough that unsystematic risk has largely been averaged away, the working assumption behind modern portfolio theory: a fully diversified investor is compensated for taking on market risk, not for taking on risk that could have been diversified away for free.
Because Treynor's denominator is a single coefficient rather than a full standard deviation calculation, this calculator only needs three numbers: the portfolio's return, the risk-free rate, and its Beta.
How This Is Calculated
The formula is:
Treynor Ratio = (Portfolio Return − Risk-Free Rate) / Beta
The numerator, Portfolio Return minus Risk-Free Rate, is called the excess return, the same excess return used in the Sharpe Ratio and in the Capital Asset Pricing Model. It represents the reward an investor earned above what they could have earned risk-free by, for example, holding short-term Treasury bills.
Beta measures how sensitive a portfolio is to overall market movement. A Beta of 1.0 means the portfolio tends to move in lockstep with the market. A Beta above 1.0 means the portfolio amplifies market moves, rising more than the market in up periods and falling more in down periods. A Beta below 1.0 means the portfolio is more muted than the market in both directions. Beta is typically estimated by regressing a portfolio's historical returns against a market benchmark, such as the S&P 500, though for a well-known stock or fund it is usually already published by data providers and can simply be looked up.
The engine underneath this calculator computes the ratio with calculateTreynorRatio(), which mirrors the structure of the existing calculateSharpeRatio() function, excess return divided by a risk measure, with Beta substituted in as that risk measure instead of total volatility.
Worked Example
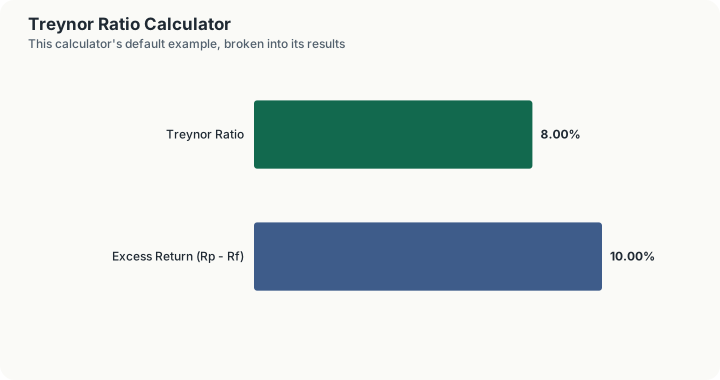
Consider an actively managed growth fund with a 14% annual return, a 4% risk-free rate, and a Beta of 1.25.
Step 1: Compute excess return. 14% − 4% = 10%.
Step 2: Divide by Beta. 10% / 1.25 = 8.00%.
The Treynor Ratio is 8.00%, meaning the fund generated 8 percentage points of excess return for every full unit of market risk it carried.
Now compare that fund against two others.
Fund A tracks the market almost exactly: a 10% return, the same 4% risk-free rate, and a Beta of 1.0. Its Treynor Ratio is (10% − 4%) / 1.0 = 6.00%.
Fund B is a defensive, low-volatility fund: an 8% return, the same 4% risk-free rate, and a Beta of just 0.6. Its Treynor Ratio is (8% − 4%) / 0.6 = 6.67%.
Even though Fund B's raw return of 8% is lower than Fund A's 10%, Fund B's Treynor Ratio is higher, because it achieved that return while carrying far less systematic risk. This is the central insight the ratio is built to surface: the highest raw return is not automatically the best risk-adjusted performer once you account for how much market risk was taken to earn it.
What This Does Not Account For
- Unsystematic risk. Treynor deliberately ignores company-specific or sector-specific risk. For a concentrated or undiversified portfolio, this makes the ratio misleadingly favorable, since real risk exists that Beta does not capture.
- The quality of the Beta estimate. Beta is itself a statistical estimate from historical data, sensitive to the benchmark used, the time period measured, and whether it is a raw or adjusted (shrunk toward 1.0) Beta. A different data provider can report a meaningfully different Beta for the same fund.
- Negative Beta portfolios. The ratio's interpretation breaks down for a portfolio with negative Beta (one that tends to move opposite the market, like some hedging strategies), where a negative denominator flips the usual "higher is better" logic.
- Changing risk over time. Beta calculated over the last three years may not reflect the fund's risk profile going forward, especially after a strategy change or manager turnover.
- Fees and taxes. As with any return-based ratio, using pre-fee or pre-tax returns overstates what an investor actually captures.
Common Pitfalls
- Using Treynor to evaluate an undiversified portfolio. If a portfolio holds only a handful of stocks, unsystematic risk is still very real, and the Sharpe Ratio or standard deviation is a more honest risk measure than Beta alone.
- Comparing Treynor Ratios calculated against different market benchmarks. Beta measured against the S&P 500 is not directly comparable to Beta measured against a small-cap or international index. Confirm the benchmark before comparing two published Treynor figures.
- Forgetting the sign convention with negative Beta. Dividing a positive excess return by a negative Beta produces a negative ratio that does not mean what a negative Treynor Ratio normally implies (underperformance). Treat negative-Beta cases separately rather than ranking them alongside positive-Beta funds.
- Assuming a higher Treynor Ratio always means a "safer" fund. The ratio measures return per unit of systematic risk, not the total riskiness of the fund. A fund can have an excellent Treynor Ratio and still carry meaningful risk that Beta simply does not price in.
- Using a stale Beta. Beta drifts as a company's business mix, leverage, or the market environment changes. A Beta pulled from several years ago may no longer describe the fund's current risk profile.
Frequently Asked Questions
How is the Treynor Ratio different from the Sharpe Ratio?
Where do I find a fund or stock's Beta?
Can the Treynor Ratio be negative?
What counts as a "good" Treynor Ratio?
Should I use Treynor or Sharpe when picking between two mutual funds for my portfolio?
Sources
- CFA Institute Curriculum: Portfolio Risk and Return, Risk-Adjusted Performance Measures. cfainstitute.org
- Sharpe, W. F. (1964), "Capital Asset Prices: A Theory of Market Equilibrium under Conditions of Risk," The Journal of Finance. The CAPM paper that defines the beta the Treynor ratio divides by. doi.org/10.1111/j.1540-6261.1964.tb02865.x
Also consulted: Treynor, J.L. (1965). "How to Rate Management of Investment Funds." Harvard Business Review.; Sharpe, W.F. (1966). "Mutual Fund Performance." Journal of Business.; Bodie, Kane, and Marcus, Investments, chapters on performance evaluation and the Capital Asset Pricing Model.