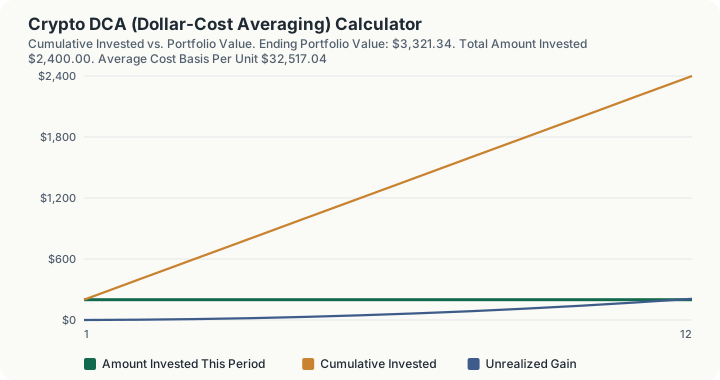
Quick Answer: Investing $200 every month for 12 months into an asset starting at $30,000/unit, assuming a smooth 1.5% price increase per month, buys 0.07380745 units for $2,400 total, at an average cost basis of $32,517.04 per unit. Valued at an ending price of $45,000/unit, that position is worth $3,321.34, a gain of $921.34, or 38.39%.
Overview
Dollar-cost averaging (DCA) means investing a fixed dollar amount at regular intervals, weekly or monthly, regardless of what the price is doing that period. Instead of trying to time a single lump-sum entry, you buy more units when the price is low and fewer units when the price is high, purely as a mechanical byproduct of investing the same dollar amount every time.
This calculator models that mechanic directly. You enter a fixed periodic investment, how many purchases you plan to make, a starting price, and an assumed price growth rate per period. The calculator builds out the full purchase schedule, computes the total units accumulated and the resulting average cost basis, and then values the position at an ending market price you choose separately, so you can stress-test different exit scenarios against the same purchase history.
The most important thing to understand about this calculator, and about DCA generally, is what it is not. DCA is a purchasing discipline, not an investment strategy that guarantees a profit or protects against loss. If the price of the asset declines throughout the entire period and never recovers, DCA does not save you from a loss, it only means your average entry price is somewhat better than if you had put the entire amount in on day one at the starting price. This calculator computes the arithmetic of that mechanic; it does not predict, and should not be read as predicting, what any real asset's price will actually do.
How This Is Calculated
- Build the per-period price path. Starting from your entered starting price, each subsequent period's price is the prior period's price compounded by your assumed growth rate per period. This produces a smooth, deterministic curve; it is a simplifying assumption, not a model of real price volatility.
- Buy a fixed dollar amount each period. Units purchased in a period = (periodic investment) ÷ (that period's price). A lower price in a given period buys more units; a higher price buys fewer.
- Sum total units and total invested. Total units accumulated = the sum of units bought across every period. Total invested = periodic investment × number of purchases.
- Compute the average cost basis the correct way. Average cost basis = total invested ÷ total units. This is the unit-weighted average price you actually paid, and it is not the same as the simple arithmetic average of the period prices, since periods where you bought more units (lower prices) should count for more in the average. This calculator, via the shared
simulateDCAengine primitive, always computes the correct unit-weighted figure. - Value the position at a separate ending price. Ending value = total units × ending market price, where the ending market price is an independent input from the assumed per-period growth rate used to build the purchase schedule. This lets you ask "what if I stopped buying and the price ended up here" without needing the entire purchase history to have followed that same trajectory to the end.
Worked Example
Using the calculator's own defaults: $200 invested monthly, 12 purchases, starting at $30,000/unit, assuming 1.5% price growth per month, valuing the final position at $45,000/unit.
- Month 1: price = $30,000. Units bought = $200 ÷ $30,000 = 0.00666667 units.
- Month 2: price = $30,000 × 1.015 = $30,450. Units bought = $200 ÷ $30,450 = 0.00656814 units.
- This continues for all 12 months, with the price compounding 1.5% higher each period, reaching roughly $35,338 by month 12.
- Total invested across all 12 purchases: 12 × $200 = $2,400.
- Total units accumulated across all 12 purchases: 0.07380745 units.
- Average cost basis: $2,400 ÷ 0.07380745 = $32,517.04 per unit, notably below the month-12 price of roughly $35,338, because the earlier, cheaper purchases pull the weighted average down.
- Ending value at the chosen $45,000/unit exit price: 0.07380745 × $45,000 = $3,321.34.
- Total gain: $3,321.34 − $2,400 = $921.34, a 38.39% total return.
Notice that the ending price ($45,000) used for the final valuation is deliberately higher than where the assumed growth curve would have naturally landed (~$35,338 by month 12). That gap is intentional: the calculator lets you test what your accumulated position would be worth under a different market outcome than the one used to generate the purchase schedule.
What Dollar-Cost Averaging Actually Buys You
DCA's real, mechanical benefit is smoothing your entry price and removing the emotional and practical burden of trying to pick a single best moment to buy. It systematically buys more units during price dips and fewer during price run-ups, which mathematically lowers your average cost basis relative to a lump sum invested entirely at a local high. It also converts an intimidating, irregular decision (when do I buy?) into an automatic, repeatable habit, which is a large part of why brokerages and exchanges promote recurring-buy features.
What it does not do is outperform a lump sum investment in every scenario. Historically, in assets that trend upward over the long run, investing the full lump sum immediately has, on average, outperformed DCA into the same asset over the same period, simply because more money was exposed to the (eventually) rising price for longer. DCA's advantage is behavioral and risk-management, not a guaranteed higher expected return.
What This Does Not Account For
- Real price volatility. The assumed growth rate produces a smooth curve. Real crypto prices move in sharp, unpredictable swings, and the actual sequence of ups and downs, not just the average trend, materially affects your real average cost basis and ending value.
- Price prediction of any kind. Nothing in this calculator forecasts what any cryptocurrency will actually do. The growth rate and ending price are user-supplied "what if" scenario inputs, not projections.
- Trading fees and spreads. Real exchange purchases typically carry a percentage fee or bid-ask spread per transaction, which slightly reduces the effective units purchased each period; this calculator assumes fee-free purchases.
- Taxes. Selling or converting the position later is a taxable event under current IRS crypto guidance (see this platform's Crypto Capital Gains & Loss Calculator for FIFO/HIFO tax-lot mechanics). This calculator does not compute tax liability.
- A change in periodic investment amount over time. The calculator assumes a constant dollar amount every period; real DCA plans sometimes scale contributions up or down.
Common Pitfalls
- Treating "DCA lowers your average cost" as "DCA guarantees a profit." A lower average cost basis than a lump-sum entry at the peak still does not protect you from an asset that keeps declining past your final purchase.
- Confusing the assumed growth rate with a forecast. The growth rate input exists to model scenarios, not to predict outcomes. Running the calculator with several very different growth rates, including negative ones, is the intended way to use it.
- Averaging period prices arithmetically instead of by unit weight. A simple average of the prices you bought at overstates your true cost basis whenever prices trended in one direction across the period, because it ignores that more units were bought at the cheaper prices.
- Ignoring fees compounding across many small purchases. A trading fee that looks negligible on one purchase adds up meaningfully across dozens or hundreds of periodic buys.
- Assuming DCA is always superior to a lump sum. In a market that trends upward over the relevant period, a lump sum invested immediately has historically outperformed a DCA schedule into the same trend, because DCA keeps part of the money in cash (and out of the market) longer.
Frequently Asked Questions
Does dollar-cost averaging guarantee I won't lose money?
Is DCA better than investing a lump sum all at once?
Why does the calculator ask for a separate ending market price instead of just using the last price in the growth curve?
How is the average cost basis different from just averaging the prices I bought at?
Can I use this calculator for assets other than crypto?
Sources
- U.S. Securities and Exchange Commission, Investor.gov, "Dollar Cost Averaging." investor.gov/introduction-investing/investing-basics/glossary/dollar-cost-averaging
- Internal Revenue Service, Notice 2014-21 (virtual currency treated as property for federal tax purposes). irs.gov/pub/irs-drop/n-14-21.pdf
- Internal Revenue Service, Digital Assets guidance hub. irs.gov/filing/digital-assets
Also consulted: Vanguard Research, "Dollar-cost averaging just means taking risk later," on the historical lump-sum-versus-DCA performance comparison.