Quick Answer: Your FIRE number is your annual spending divided by your safe withdrawal rate, and this calculator projects how many years of saving at your current rate it will take to reach it.
Overview
FIRE, short for Financial Independence, Retire Early, is a target net worth at which your investment portfolio can sustainably fund your annual spending indefinitely without depleting, based on a chosen safe withdrawal rate. The concept traces back to the 4% rule popularized by the 1998 Trinity Study, which examined historical stock and bond returns and found that a portfolio withdrawing 4% of its starting value annually, adjusted for inflation each year, survived a 30-year retirement horizon in the overwhelming majority of historical scenarios tested. Inverted, that 4% figure implies a target portfolio of 25 times annual spending, the math this calculator runs directly.
The safe withdrawal rate you choose materially changes your target. A more conservative 3.5% withdrawal rate (implying roughly 28.6 times annual spending) is often favored by people planning unusually long retirement horizons, given that early retirees frequently face 40-50+ year withdrawal periods rather than the 30-year window the original Trinity Study examined, a distinction popularized in later safe-withdrawal-rate research such as the "Early Retirement Now" SWR series. A more aggressive 4.5-5% rate shrinks the target but increases the historical probability of portfolio depletion in a bad sequence of market returns.
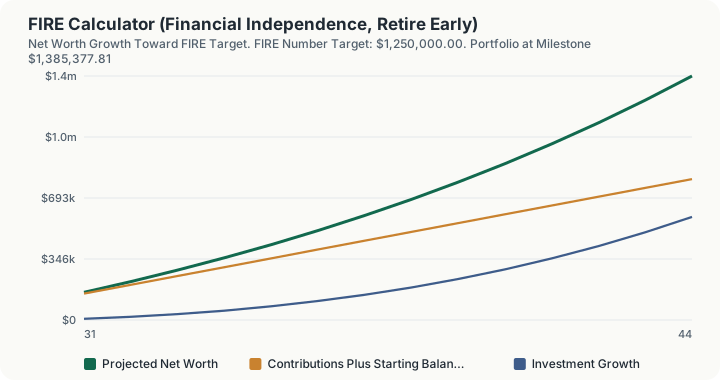
This calculator does not just compute your FIRE number as a static target; it also projects a year-by-year accumulation path from your current net worth, applying your expected real (inflation-adjusted) rate of return and your annual savings contribution each year until your portfolio crosses the target. That path length, expressed in years and as a projected retirement age, is often more motivating than the dollar target alone, because it converts an abstract number into a concrete timeline you can pressure-test against different savings rates.
How This Is Calculated
Step 1: FIRE number target. Annual spending divided by your chosen safe withdrawal rate:
At a 4% withdrawal rate this is mathematically identical to 25 times annual spending; at 3.5% it is roughly 28.6 times annual spending.
Step 2: Year-by-year accumulation simulation. Starting from your current net worth, each year applies your expected real return to the existing balance, then adds your annual savings contribution, repeating until the balance meets or exceeds the FIRE number:
Step 3: Years to FIRE and projected retirement age. The loop counts the number of years required and adds that to your current age to produce a projected retirement age.
Because the expected return input is described as a "real" return, it is meant to already be net of inflation, so the FIRE number and the accumulation path are expressed in consistent, today's-dollar terms throughout.
Worked Example
Using this calculator's baseline inputs: a 30-year-old with $100,000 in current net worth, $50,000 in annual spending, $50,000 in annual savings, a 4.0% safe withdrawal rate, and a 7.0% expected real return.
- FIRE number: $50,000 ÷ 4.0% = $1,250,000
- Year 1: growth = $100,000 × 7% = $7,000; balance = $100,000 + $7,000 + $50,000 = $157,000
- Year 2: growth = $157,000 × 7% = $10,990; balance = $157,000 + $10,990 + $50,000 = $217,990
- The same compounding process repeats annually; by year 13 the balance reaches roughly $1,248,017, still just short of target.
- Year 14: growth = $1,248,017 × 7% ≈ $87,361; balance = $1,248,017 + $87,361 + $50,000 ≈ $1,385,378, which crosses the $1,250,000 target.
- Years to FIRE: 14 years
- Projected FIRE age: 30 + 14 = 44
- Projected net worth at FIRE (overshoot from annual step size): approximately $1,385,377.81
The final balance overshoots the $1,250,000 target because the simulation checks the balance once per year rather than solving continuously for the exact crossing point; the actual crossover happens partway through year 14. A second data point from this calculator's own test suite shows the sensitivity to inputs clearly: a 35-year-old with $200,000 net worth, $70,000 in annual spending, $40,000 in annual savings, a more conservative 3.5% withdrawal rate, and a 6.0% real return produces a $2,000,000 FIRE number and takes more than 15 years to reach, since both the higher spending level and the more conservative withdrawal rate push the target substantially higher than the baseline scenario.
What This Does Not Account For
- Sequence-of-returns risk. A flat annual real return is applied every year of both the accumulation and (implicitly) the withdrawal phase; real markets deliver volatile returns, and a bad sequence of returns early in retirement can deplete a portfolio faster than the average return would suggest, even at a nominally "safe" withdrawal rate.
- Healthcare costs before Medicare eligibility. Early retirees lose employer-sponsored health coverage well before age 65 Medicare eligibility, and marketplace insurance premiums can be a substantial, underestimated line item in "annual spending" for anyone retiring in their 30s, 40s, or 50s.
- Taxes on withdrawals. The FIRE number and the safe withdrawal rate research it derives from generally assume gross portfolio withdrawals; actual after-tax spending power depends on account type (taxable, traditional, Roth), tax-loss harvesting strategy, and applicable capital gains or income tax rates.
- Social Security and pension income. This calculator does not net out any future guaranteed income streams that might reduce the portfolio withdrawal needed later in retirement.
- One-time large expenses. Major future costs like a home purchase, a child's education, or long-term care are not modeled as distinct events; they must be reflected by adjusting the annual spending or savings inputs manually.
Common Pitfalls
- Using a nominal return instead of a real (inflation-adjusted) return. Because the FIRE number is calculated in today's dollars, mixing a nominal (non-inflation-adjusted) return assumption into the accumulation projection will overstate how quickly you reach your target.
- Setting the safe withdrawal rate too aggressively for a long retirement horizon. The original 4% rule research assumed a 30-year retirement window; someone retiring at 35 facing a 55+ year horizon carries materially more sequence-of-returns risk than the historical studies behind the 4% figure directly support.
- Underestimating "annual spending" by excluding irregular costs. Annual spending figures built only from routine monthly bills often miss irregular but real expenses like car replacement, home maintenance, and travel, understating the true FIRE number needed.
- Ignoring the effect of even small savings rate changes. Because savings compound alongside investment growth, a relatively modest increase in annual savings can meaningfully shorten the years-to-FIRE figure, an effect that is easy to underestimate intuitively.
- Treating the FIRE number as a fixed target rather than an ongoing plan. Actual spending needs, market returns, and life circumstances evolve; a FIRE number calculated once at age 30 should be revisited periodically, not treated as permanently fixed.
Frequently Asked Questions
What is the difference between Lean FIRE, standard FIRE, and Fat FIRE?
Where does the 4% withdrawal rate come from?
Why would someone use a 3.5% withdrawal rate instead of 4%?
Does reaching my FIRE number mean I have to stop working?
How sensitive is the years-to-FIRE figure to my expected return assumption?
Can I reach FIRE faster by increasing savings instead of cutting spending?
Sources
- Trinity Study (1998), "Retirement Savings: Choosing a Withdrawal Rate That Is Sustainable," AAII Journal, aaii.com/journal/199802/feature.pdf
- Early Retirement Now, Safe Withdrawal Rate Series (extended historical and Monte Carlo analysis of withdrawal rate sustainability), earlyretirementnow.com/safe-withdrawal-rate-series
- U.S. Bureau of Labor Statistics, Consumer Price Index data used for real-return and inflation-adjustment context, bls.gov/cpi
Also consulted: Bengen, William P., "Determining Withdrawal Rates Using Historical Data," Journal of Financial Planning (1994), the original SWR research predating the Trinity Study.