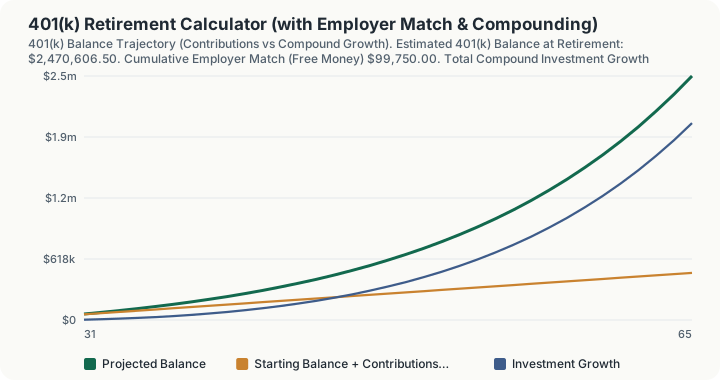
Quick Answer: Your projected 401(k) balance at retirement is your current balance plus every future year of employee contributions, employer match, and compound investment growth, compounded annually until your target retirement age.
Overview
A 401(k) is a payroll-deducted, tax-advantaged retirement account, and the two biggest levers you actually control are how much of your salary you defer and whether you are capturing the full employer match on offer. This calculator models both explicitly rather than collapsing them into a single "contribution rate" number, because the employer match is frequently described as the closest thing to a guaranteed return an investor will ever see: money that shows up in your account the moment you contribute, independent of market performance.
This calculator caps your own elective deferrals at $24,500 a year, the 2026 limit on how much salary you can direct into a 401(k) before employer contributions even enter the picture. That figure is set annually by the IRS under Internal Revenue Code Section 402(g) and was raised from $23,500 to $24,500 for 2026 by IRS Notice 2025-67; it applies only to your payroll deferrals and does not cap what your employer can add on top through matching. Employer matching itself is not standardized, so this calculator uses the two variables that describe the overwhelming majority of real-world match formulas: a match percentage (how many cents your employer contributes per dollar you defer) and a match cap (the percentage of your salary up to which that match applies). Together they reproduce common formulas like "50% match up to 6% of salary," the exact structure used in this calculator's baseline scenario.
Then there's compounding, the third lever, and the one most 401(k) participants underweight psychologically because its effect is invisible year to year and enormous over a career. This calculator runs a year-by-year simulation from your current age to your target retirement age, applying your expected annual return to the account balance before adding that year's combined employee and employer contributions. That lets you see exactly how much of your eventual balance came from your own paycheck, how much came from your employer's match, and how much came from investment growth compounding on both.
How This Is Calculated
Step 1: Annual contribution amounts. Employee contribution is your salary times your contribution percentage, capped at the $24,500 statutory elective deferral limit for 2026 (IRC 402(g)(1), set by IRS Notice 2025-67). The match then applies to the deferral you actually made, up to the stated cap on salary, so deferring less than the cap earns proportionally less match:
Step 2: Year-by-year compounding. Each plan year is one ordinary-annuity period solved by the shared time-value-of-money engine: investment growth is applied to the existing balance first, then that year's total contribution (employee plus employer) is credited at the end of the year.
Step 3: Decompose the final balance. The calculator separately tracks employee principal (your starting balance plus every year of your own deferrals), cumulative employer match, and the residual, which is pure compound investment growth:
Worked Example
Using this calculator's baseline inputs: a 30-year-old earning $95,000 annually with a $45,000 current balance, contributing 10% of salary, an employer match of 50% up to 6% of salary, a 7.5% expected annual return, retiring at 65 (35 years of growth).
- Annual employee contribution: $95,000 × 10% = $9,500 (well under the $24,500 cap)
- Salary matched by employer: $95,000 × 6% = $5,700
- Annual employer match: $5,700 × 50% = $2,850
- Total annual contribution: $9,500 + $2,850 = $12,350
- Year 1 growth: $45,000 × 7.5% = $3,375; balance becomes $45,000 + $3,375 + $12,350 = $60,725
- That same process repeats for 35 years, with growth compounding on an ever-larger base as contributions accumulate.
- Final projected balance at age 65: $2,470,606.50
- Cumulative employee principal (the $45,000 starting balance plus 35 years of $9,500 deferrals): $45,000 + $332,500 = $377,500
- Total employer match received over 35 years: $99,750
- Total compound investment growth: $2,470,606.50 − ($377,500 + $99,750) = $1,993,356.50
Notice that compound growth ($1,993,356.50) is more than five times the $377,500 of principal that ever entered the account from your own pocket, starting balance included. That gap is the entire argument for starting early: the same $9,500 annual contribution made at age 55 instead of age 30 would have only a decade to compound instead of 35 years, and would produce a dramatically smaller final balance despite identical contribution behavior.
What This Does Not Account For
- Catch-up contributions for savers age 50 and older. The IRS allows an additional catch-up deferral on top of the standard elective deferral limit for participants 50+, with an enhanced catch-up amount for ages 60-63 under SECURE 2.0. For 2026 those amounts are $8,000 for ages 50 and over and $11,250 for ages 60 through 63. This calculator applies a flat $24,500 cap regardless of age.
- Salary growth over time. Contributions are calculated as a fixed percentage of your current salary held constant for the entire projection; real salaries typically rise with promotions and inflation, which would increase both employee contributions and employer match in later years.
- Investment fees and expense ratios. The stated annual return is treated as a net figure; actual fund expense ratios, plan administrative fees, and advisory fees all reduce realized returns and are not separately modeled.
- Vesting schedules on employer contributions. Many employers require a period of service before matched funds fully vest; unvested match forfeited upon an early job change is not modeled here.
- Sequence-of-returns risk. A single flat annual return is applied every year; real markets deliver volatile, sequential returns, and the order in which good and bad years occur can affect a real portfolio's terminal value even at the same average return.
Common Pitfalls
- Contributing less than the full match threshold. Failing to contribute at least up to your plan's match cap (6% in this example) means leaving free employer money on the table, effectively taking a pay cut relative to a coworker who captures it.
- Assuming the elective deferral limit includes employer contributions. The $24,500 cap applies to your own payroll deferrals. Employer matching is a separate pool of money, bounded instead by the overall annual additions limit under IRC Section 415(c)(1)(A), which Notice 2025-67 set at $72,000 for 2026.
- Using an unrealistically high expected return. Historical long-run equity returns have generally landed in the 7-10% nominal range with meaningful year-to-year variance; entering an overly optimistic rate produces a projection that overstates likely retirement readiness.
- Ignoring vesting when changing jobs frequently. Job changes before employer contributions fully vest can forfeit thousands of dollars of matched funds that a static projection like this one assumes you keep.
- Forgetting that this models pre-tax growth. Traditional 401(k) withdrawals are taxed as ordinary income in retirement; the balance shown here is a pre-tax projection, not spendable after-tax income.
Frequently Asked Questions
What is the 2026 401(k) contribution limit used in this calculator?
How does employer match "up to 6% of salary" actually work?
How much should I have in my 401(k) by age 30, 40, 50, and 60?
Why does compound growth eventually dwarf my own contributions?
Should I contribute more than my employer's match cap?
Does this calculator account for taxes when I withdraw the money?
How much does a 1% higher expected return change my outcome?
Sources
- Internal Revenue Service, Retirement Topics - 401(k) and Profit-Sharing Plan Contribution Limits, irs.gov/retirement-plans/plan-participant-employee/retirement-topics-401k-and-profit-sharing-plan-contribution-limits
- Internal Revenue Service, IRC Section 402(g) Elective Deferral Limits. law.cornell.edu/uscode/text/26/402
- U.S. Department of Labor, Employee Benefits Security Administration, 401(k) Plan overview, dol.gov/general/topic/retirement/typesofplans
- IRS Notice on SECURE 2.0 Act catch-up contribution provisions. irs.gov