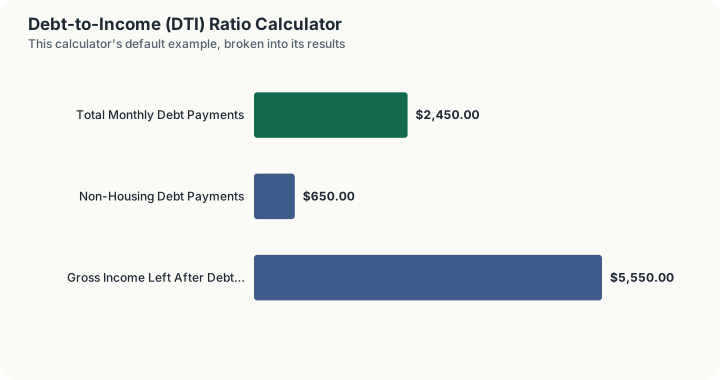
Quick Answer: A borrower with $8,000 in gross monthly income, an $1,800 housing payment, and $650 of other monthly debt has a 22.5% front-end ratio and a 30.6% back-end ratio, comfortably inside the traditional 28/36 benchmark that most conservative underwriting guidance uses.
Overview
Your debt-to-income ratio is the single number mortgage underwriters lean on hardest. It answers one question: of every dollar of gross income you earn each month, how many cents are already committed to required debt payments before you buy anything at all?
Lenders actually compute two ratios, not one. The front-end ratio (also called the housing ratio) counts only what the roof costs: principal, interest, property tax, and homeowners insurance -- the four components lenders abbreviate as PITI -- plus HOA dues if the property has them. The back-end ratio counts that housing payment plus every other recurring debt obligation: auto loans and leases, student loans, credit card minimum payments, personal loans, and legally obligated child support or alimony.
What does not count matters just as much. The Consumer Financial Protection Bureau is explicit that discretionary living expenses are not debt: utilities, groceries, phone and streaming subscriptions, health insurance premiums, gas, and childcare all sit outside the DTI calculation. Neither ratio is a budget. Two borrowers with identical DTI ratios can have wildly different amounts of real breathing room, which is exactly why the VA program looks at residual income instead of leaning on a DTI cap.
Both ratios use gross income, not take-home pay. That is income before taxes, before retirement contributions, and before health premiums come out. Using net pay by mistake will make your ratio look far worse than the one a lender computes.
How This Is Calculated
- Gross monthly income. Total household income before any deduction. Salary, self-employment income, and documented bonus, overtime, or rental income a lender would be willing to count.
- Monthly housing payment. Principal plus interest plus monthly property tax plus monthly homeowners insurance, plus HOA dues where they apply. Renters substitute their monthly rent.
- Front-end DTI. Monthly housing payment divided by gross monthly income, expressed as a percentage.
- Other monthly debt payments. Auto loan and lease payments, student loan payments, the sum of credit card minimum payments, personal loan payments, and court-ordered support obligations.
- Total monthly debt. Housing payment plus all other debt payments.
- Back-end DTI. Total monthly debt divided by gross monthly income, expressed as a percentage.
The calculator then places the resulting back-end ratio against a set of published reference guidelines. Those bands are descriptive context, not a verdict. Actual approval turns on the loan program, the automated underwriting decision, your credit score and reserves, and whatever overlays the individual lender stacks on top of the agency minimum.
The reference bands, and what they actually are
- The 28/36 rule. 28% front-end, 36% back-end. The standard conservative rule of thumb in financial-literacy content, historically traced to manual-underwriting norms. It is stricter than what the agencies themselves currently allow, so clearing it is a comfort signal rather than a requirement.
- Fannie Mae. Selling Guide B3-6-02 caps manually underwritten loans at 36%, extendable to 45% where credit score and reserves supply documented compensating factors. Loans run through Desktop Underwriter (DU) can be approved as high as 50% back-end DTI, because DU weighs the whole risk profile rather than the ratio alone.
- Freddie Mac. Functionally parallel. Loan Product Advisor (LPA) can reach roughly the same 50% maximum through automated risk analysis.
- FHA. HUD Handbook 4000.1 sets a standard 31% front-end and 43% back-end guideline. With documented compensating factors, manually underwritten FHA loans can go to about 40% front-end and 50% back-end. The TOTAL Scorecard, FHA's automated engine, sometimes clears higher still; figures around 55% to 57% circulate in industry practice commentary, but that is practice-based reporting, not a published hard ceiling.
- VA. No hard DTI cap at all. The 41% figure often quoted is a guideline threshold, not a limit. Above 41%, VA underwriting generally expects residual income -- income left after taxes, housing, debts, and estimated maintenance and utilities -- to exceed the regional, family-size-based table amount by 20%. Treating VA as a "41% cap" program misrepresents how it works.
- The 43% number. This one deserves care. The 43% back-end limit was a hard cap under the old Qualified Mortgage rule, and it was removed by the CFPB's December 2020 General QM Final Rule, which replaced it with a price-based test comparing the loan's APR to the Average Prime Offer Rate (mandatory compliance arrived in October 2022). DTI is no longer itself a bright-line QM disqualifier. The number persists across industry content as a practical rule of thumb, and it is reasonable to treat it that way -- just not as "the current CFPB rule."
Worked Example
A comfortable borrower. Gross monthly income of $8,000, with an $1,800 monthly housing payment (PITI):
- Front-end DTI: $1,800 / $8,000 = 22.5%
- Other monthly debt: auto loan $350 + student loan $200 + credit card minimums $100 = $650
- Total monthly debt: $1,800 + $650 = $2,450
- Back-end DTI: $2,450 / $8,000 = 30.625%, or 30.6%
Both ratios sit inside the conservative 28/36 benchmark, which means they also sit inside every looser agency reference band. This is the profile that qualifies broadly across programs.
A stretched borrower. Gross monthly income of $6,000 against a $2,100 housing payment:
- Front-end DTI: $2,100 / $6,000 = 35%
- Other monthly debt: auto loan $450 + student loan $300 + credit card minimums $250 + personal loan $150 = $1,150
- Total monthly debt: $2,100 + $1,150 = $3,250
- Back-end DTI: $3,250 / $6,000 = 54.1667%, or 54.2%
At 54.2%, this back-end ratio is above every reference band listed, including the roughly 50% ceiling that DU and LPA can reach. That does not automatically mean no loan exists; FHA's automated scorecard and some VA files with strong residual income do clear higher. It does mean this borrower is outside conventional automated approval territory and should expect the conversation to be about compensating factors, a smaller loan, or paying down the $1,150 of consumer debt first.
Notice how much leverage that consumer debt carries. Removing just the $450 car payment in the second example drops the back-end ratio to 46.7%, back inside the automated-underwriting range, without changing the house at all.
What This Does Not Account For
- Lender overlays. Agency maximums are floors for lenders, not ceilings. An individual bank can and often does impose a stricter internal DTI limit than Fannie Mae or FHA permits.
- Automated underwriting outcomes. DU, LPA, and FHA's TOTAL Scorecard weigh credit score, reserves, loan-to-value, and payment shock together. A ratio at 47% with 12 months of reserves and a 780 score reads very differently from the same ratio with no reserves and a 640 score.
- VA residual income. This calculator shows gross income remaining after debt payments, which is not the same thing. VA residual income is measured after federal and state taxes, Social Security, housing costs, and estimated utilities and maintenance, against a regional table keyed to family size.
- How the lender counts your student loans. Deferred, forbearance, and income-driven repayment loans are treated inconsistently across programs; several impute a percentage of the outstanding balance rather than accepting a $0 or reduced payment.
- Income the lender will not credit. Bonus, commission, overtime, and self-employment income generally need a two-year history to be counted, and rental income is usually haircut for vacancy.
- Non-mortgage uses. Auto lenders, credit card issuers, and personal loan underwriters all use DTI, but with different thresholds and different definitions of qualifying income.
Common Pitfalls
- Using net pay instead of gross. The most common error, and it inflates your ratio by roughly 20% to 30%. Lenders use pre-tax income.
- Entering full credit card payments instead of minimums. DTI counts the minimum payment due, not what you choose to pay. Someone paying $800 a month against a card whose minimum is $75 gets counted at $75.
- Adding living expenses. Utilities, groceries, phone bills, subscriptions, and health insurance premiums are not debt and do not belong in either ratio.
- Forgetting the tax and insurance halves of PITI. Estimating the front-end ratio from principal and interest alone understates it badly, especially in high-property-tax states such as New Jersey, Illinois, and Texas.
- Treating 43% as a legal cap. It was one under the old QM rule. It is now a widely cited rule of thumb, and the CFPB's General QM standard is price-based instead.
- Reading VA's 41% as a ceiling. It is a threshold above which residual income must clear the standard table amount by 20%, not a wall.
- Assuming DTI alone decides the outcome. It is one input among credit score, reserves, loan-to-value, and program type.
Frequently Asked Questions
What is a good debt-to-income ratio?
Does my rent count toward DTI if I am applying for a car loan or a credit card?
Do utilities, groceries, or my phone bill count?
Is 43% still the maximum DTI for a Qualified Mortgage?
How do I lower my DTI quickly?
Which ratio matters more, front-end or back-end?
Sources
- Consumer Financial Protection Bureau (CFPB), "What is a debt-to-income ratio?" -- definition of which obligations count as debt and which are discretionary living expenses. High confidence, primary source. consumerfinance.gov
- Consumer Financial Protection Bureau, "What is a debt-to-income ratio?" consumerfinance.gov/ask-cfpb/what-is-a-debt-to-income-ratio-en-1791
Also consulted: CFPB, General Qualified Mortgage Final Rule (December 2020; mandatory compliance October 1, 2022) -- removal of the 43% DTI cap and adoption of the price-based APR versus Average Prime Offer Rate test. High confidence, primary source; Fannie Mae Selling Guide B3-6-02, Debt-to-Income Ratios -- 36% manual underwriting maximum, 45% with compensating factors, and the Desktop Underwriter path to approximately 50%. High confidence, primary source; Freddie Mac Loan Product Advisor documentation -- parallel automated underwriting treatment reaching approximately 50%. High confidence, primary source; HUD Handbook 4000.1, FHA Single Family Housing Policy Handbook -- 31%/43% standard guideline. High confidence for the standard figures. Medium confidence for the 40%/50% compensating-factor maximums and for the informally cited 55% to 57% TOTAL Scorecard outcomes, which were taken from secondary summaries of the Handbook rather than a direct read of the primary text; VA Pamphlet 26-7, VA Lenders Handbook -- the 41% guideline threshold and residual income requirements. Medium confidence for the specific rule that residual income must exceed the regional table amount by 20% when DTI exceeds 41%, which came from secondary sources summarizing the Pamphlet.
Because program rules also vary by lender overlay, confirm any figure that is decision-relevant with the specific lender you are working with before relying on it.