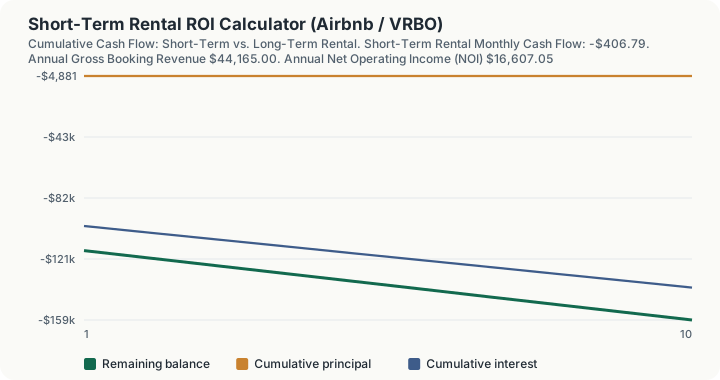
Quick Answer: A short-term rental's return depends heavily on occupancy, since STR operating costs (management, platform fees, cleaning, utilities) run well above a standard lease. On this calculator's baseline inputs ($350,000 purchase, $220/night, 55% occupancy), the property produces a -$406.79 monthly cash flow and a -4.42% cash-on-cash return, actually underperforming the same property run as a $2,200/month long-term rental by $552.95 a year, illustrating why occupancy and expense assumptions, not the nightly rate alone, decide whether an STR pencils out.
Overview
Short-term rentals (Airbnb, VRBO, and similar platforms) are frequently pitched on the strength of the nightly rate: a $220/night listing sounds like it should crush a $2,200/month lease on the same property, since 15 booked nights alone would already exceed a full month's long-term rent. The catch is the operating cost structure. A short-term rental owner typically pays a booking platform fee (commonly around 3% on Airbnb), a professional management fee if not self-managing (often 15-25% of gross revenue for full-service short-term management, well above the 8-10% typical of long-term rental management), cleaning and turnover costs between every stay, utilities and guest supplies the owner usually covers directly, and a higher maintenance reserve to account for heavier guest turnover wear. None of those costs exist, or exist at anywhere near the same scale, on a standard 12-month lease.
This calculator models the full short-term rental economics: gross booking revenue from nightly rate and occupancy, every major STR-specific operating cost, resulting NOI, cap rate, and cash-on-cash return, including furnishing and setup costs in the total cash invested figure since a short-term rental has to be fully furnished and photographed before it can list, unlike a typical long-term rental. It then runs the identical property, on the identical financing, as a standard long-term rental for direct comparison, so you can see the actual STR premium (or discount) in dollars and percentage points rather than guessing from the nightly rate alone.
Occupancy rate is the single most consequential assumption in this model, and deliberately, this calculator does not hardcode a "typical" occupancy percentage as though it were a verified statistic. Occupancy varies enormously by market, seasonality, regulatory environment, and listing quality. Treat the occupancy input as your own underwriting assumption, informed by local market data (platforms like AirDNA publish market-level STR occupancy and revenue benchmarks) rather than a number this calculator asserts as fact.
How This Is Calculated
Step 1: Annual gross booking revenue.
Step 2: Short-term rental operating expenses.
where platform fees and management fees are each a percentage of gross revenue, and the remaining items are entered as fixed monthly costs annualized.
Step 3: Net Operating Income and post-debt cash flow.
using a standard amortizing mortgage payment on the financed portion of the purchase price for the debt service figure.
Step 4: Cap rate and cash-on-cash return.
Total cash invested includes the down payment, closing costs, and furnishing/setup cost, since an STR cannot list without being furnished.
Step 5: Long-term rental comparison. The same purchase price and financing are run through a standard long-term rental calculation (gross rent, a flat operating expense ratio, and the same debt service), and the two annual cash flow and cash-on-cash figures are compared directly.
Worked Example
Using this calculator's baseline inputs: a $350,000 purchase, 25% down ($87,500 down, $262,500 loan) at 7.25% over 30 years, $15,000 in furnishing/setup cost, $8,000 in closing costs, a $220 average nightly rate, 55% occupancy, a 20% management fee, a 3% platform fee, $400/month cleaning, $350/month utilities, $200/month maintenance, and $6,000/year combined property tax and insurance, compared against a $2,200/month long-term rental at a 35% operating expense ratio.
- Annual gross revenue: $220 × 365 × 55% = $44,165
- Platform fees: $44,165 × 3% = $1,324.95; Management fees: $44,165 × 20% = $8,833.00
- Annual cleaning: $400 × 12 = $4,800; utilities: $350 × 12 = $4,200; maintenance: $200 × 12 = $2,400; tax & insurance: $6,000
- Total STR operating expenses: $1,324.95 + $8,833.00 + $4,800 + $4,200 + $2,400 + $6,000 = $27,557.95
- Net Operating Income: $44,165 − $27,557.95 = $16,607.05
- Monthly mortgage P&I on the $262,500 loan at 7.25% over 360 months: $1,790.71; annual debt service = $21,488.52
- Monthly cash flow: ($16,607.05 − $21,488.52) ÷ 12 = -$406.79
- Cap rate: $16,607.05 ÷ $350,000 × 100 = 4.74%
- Total cash invested: $87,500 + $8,000 + $15,000 = $110,500; cash-on-cash return: -$4,881.47 ÷ $110,500 × 100 = -4.42%
- Long-term comparison: at $2,200/month with a 35% expense ratio, annual NOI is $17,160, producing an annual cash flow of -$4,328.52, still negative, but $552.95 better than the STR scenario on the same financing.
A second reference point shows how sharply occupancy changes the picture: raising occupancy to 70% at a $250 nightly rate on a similarly sized property with a lower 15% management fee pushes annual gross revenue to $63,875, NOI to $37,777.50, and a 24.48% cash-on-cash return, a full 30.33 percentage points above the equivalent long-term rental comparison, which reads as -5.85% on the same underlying deal. The nightly rate matters, but occupancy and fee structure are what actually decide the outcome.
What This Does Not Account For
- Short-term rental regulatory and zoning risk. Many cities and homeowners associations restrict or outright prohibit short-term rentals, cap the number of permits issued, or require costly licensing. This calculator assumes the property can legally operate as a short-term rental at the occupancy you enter; verify local ordinances before underwriting a deal on this basis.
- Seasonality within the year. Occupancy and nightly rate are entered as single blended annual figures; actual STR performance is often highly seasonal, with occupancy and achievable rate swinging significantly between peak and off-peak periods.
- Income tax and Schedule C/E treatment. Short-term rentals with average stays under seven days and material owner involvement can be taxed differently than a standard long-term rental under IRS rules; this calculator reports pre-tax cash flow only and does not model that distinction.
- Platform algorithm and review-count ramp-up. New listings typically take months to reach a stabilized occupancy rate as reviews and search ranking build; this model assumes stabilized performance from day one.
- Insurance availability and cost differences. Standard homeowners or landlord insurance policies frequently exclude short-term rental use; a dedicated STR policy is usually required and often costs meaningfully more than modeled generically here.
Common Pitfalls
- Anchoring on the nightly rate instead of the occupancy-adjusted annual revenue. A high nightly rate at low occupancy can underperform a lower rate at high, consistent occupancy; always evaluate the two together.
- Underestimating the management fee if switching from self-managed to professional STR management. Full-service short-term rental management commonly runs 15-25% of gross revenue, roughly double a typical long-term rental management fee, and materially changes the cash-on-cash return.
- Forgetting furnishing and setup costs in the cash invested figure. A short-term rental cannot list without furniture, photography, and basic amenities; leaving this out of total cash invested overstates the cash-on-cash return.
- Treating a single quoted occupancy percentage as guaranteed. Occupancy is the most volatile input in this model and the most sensitive to market conditions, new local supply, and regulatory changes; stress-test a range of occupancy assumptions rather than underwriting to a single optimistic figure.
- Ignoring the long-term rental alternative entirely. Even a strong-looking STR cash-on-cash return should be weighed against what the same property would produce as a lower-effort, lower-regulatory-risk long-term rental; this calculator's built-in comparison exists specifically to keep that alternative in view.
Frequently Asked Questions
What occupancy rate should I use if I don't have local data?
Why did the short-term rental scenario underperform the long-term rental in the baseline example?
Does the management fee assume I am self-managing or using a property manager?
How does this differ from the rental property calculator on this site?
Should I include the guest-paid cleaning fee as revenue?
Sources
- IRS Publication 527 and Schedule C/E guidance on short-term rental income classification, irs.gov/publications/p527
- Consumer Financial Protection Bureau, investment property mortgage guidance, consumerfinance.gov
Also consulted: AirDNA, short-term rental market data and occupancy benchmarks (market-specific; verify for your target property's location); Airbnb, Host Service Fee structure.