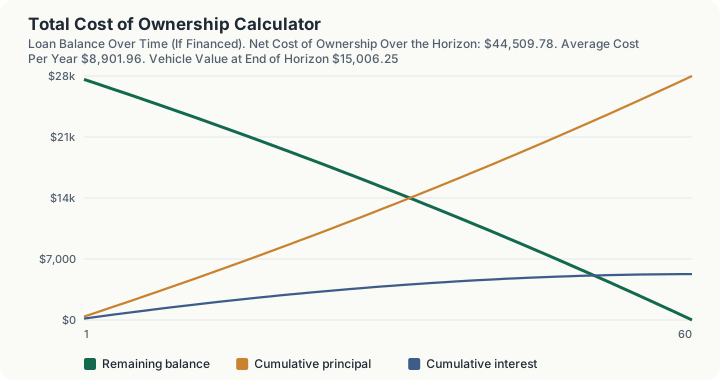
Quick Answer: A $32,000 vehicle financed with $4,000 down at 7.0% APR over 60 months, driven 12,000 miles a year at 28 MPG with $3.50/gal fuel, $1,800/yr insurance, $900/yr maintenance, and $250/yr registration, costs $44,509.78 net over a 5-year ownership horizon, once the vehicle's estimated $15,006.25 resale value at year 5 is subtracted out. That works out to $8,901.96 a year, or $741.83 a month, all-in.
Overview
The sticker price and even the loan payment only tell part of the story of what a vehicle actually costs to own. This calculator adds up every recurring cost of keeping the car on the road, financing or the cash outlay, fuel, insurance, maintenance, and registration, across a horizon you choose, then nets out the vehicle's estimated resale value at the end of that horizon. That last step matters: a car you still own is worth real money, and ignoring that would overstate the true cost of ownership by treating the entire purchase price as a sunk cost rather than partly an asset you still hold.
The result is a single net figure that lets you compare ownership scenarios on equal footing, financing versus cash, a 3-year hold versus a 7-year hold, a fuel-efficient commuter versus a larger vehicle, using the same complete cost framework each time.
How This Is Calculated
- Vehicle cash outlay. If financing, this is the down payment plus every loan payment that falls within the ownership horizon, plus any loan balance still owed if you plan to sell or trade before the loan is paid off. If paying cash, it's simply the full purchase price. This platform's standard fixed-rate amortization engine computes the loan schedule, reconciled to $0.00.
- Operating costs. Fuel cost is estimated as (annual miles ÷ MPG) × price per gallon, multiplied by the number of ownership years. Insurance, maintenance, and registration are each the annual estimate you enter, multiplied by the same number of years. This calculator does not apply inflation to these annual figures; it holds them flat across the horizon for simplicity.
- Vehicle value at the end of the horizon. Applies a documented-average depreciation curve, roughly 20% value loss in year 1, then roughly 12.5% per year afterward by default (see Sources), both of which you can edit. This produces the vehicle's estimated resale/trade-in value at the end of your ownership horizon.
- Net cost of ownership. Total cash outlay (financing or cash purchase, plus all operating costs) minus the vehicle's value at the end of the horizon. This is the number that should drive an apples-to-apples comparison between ownership scenarios, not the sticker price or the loan payment alone.
Worked Example
Using the calculator's default inputs, over a 5-year horizon:
| Cost Category | Amount |
|---|---|
| Down payment | $4,000.00 |
| Loan payments (60 months) | $33,265.79 |
| Vehicle cash outlay subtotal | $37,265.79 |
| Fuel (12,000 mi/yr ÷ 28 MPG × $3.50/gal × 5 yrs) | $7,500.00 |
| Insurance ($1,800/yr × 5) | $9,000.00 |
| Maintenance ($900/yr × 5) | $4,500.00 |
| Registration ($250/yr × 5) | $1,250.00 |
| Operating costs subtotal | $22,250.00 |
| Total cash outlay | $59,516.03 |
| Less: vehicle value at year 5 (est.) | −$15,006.25 |
| Net cost of ownership | $44,509.78 |
Divided across the horizon, that's $8,901.96 per year, or $741.83 per month, covering every dollar spent on the vehicle net of what it's still worth.
What This Does Not Account For
- Inflation on operating costs. Fuel, insurance, and maintenance prices tend to rise over a multi-year horizon; this calculator holds your entered annual figures flat. For a longer horizon, consider entering a modestly higher blended annual estimate to compensate.
- Unscheduled major repairs. The maintenance input is meant to cover routine service and typical repairs, not a low-probability, high-cost event like a transmission failure out of warranty.
- Financing costs beyond the loan itself, such as GAP insurance or extended warranties, if purchased.
- Sales tax on the purchase. Add your state's estimated sales tax to the vehicle price before entering it here if you want it reflected in the total.
- Opportunity cost / time value of money. This is a simple sum of nominal costs across the horizon, not a present-value calculation. A cash purchase ties up capital that could otherwise be invested; this calculator does not credit or debit that opportunity cost.
- Precise, model-specific depreciation. The default depreciation curve is a documented industry average, not a figure specific to your exact make, model, and trim. Vehicles vary significantly in how well they hold value; adjust the depreciation inputs if you have better data (for example, from iSeeCars' or Carfax's model-specific depreciation studies).
Common Pitfalls
- Comparing only the loan payment across vehicles. A lower monthly payment can still mean a higher total cost of ownership if the vehicle depreciates faster, costs more to insure, or gets worse fuel economy. Compare the net cost of ownership figure instead.
- Selling or trading in before the loan is paid off. If your realistic ownership horizon is shorter than the loan term, the remaining loan balance is still a real cost, this calculator includes it, but it's easy to forget when mentally budgeting only for the monthly payment.
- Using national-average insurance or maintenance figures uncritically. These vary enormously by driver, location, and vehicle. Use your own quote or actual spending history when you have it instead of a generic estimate.
- Ignoring fuel economy's actual dollar impact. A vehicle with dramatically worse MPG than an alternative can add thousands of dollars over a 5-year horizon at typical mileage, easy to underweight when comparing sticker prices side by side.
- Assuming financing is automatically "more expensive" than paying cash. Financing adds interest cost, but paying cash ties up capital that has its own opportunity cost, which this calculator doesn't model. The net-cost comparison here isolates ownership costs, not the separate question of how you'd otherwise deploy that cash.
Frequently Asked Questions
Why does the calculator subtract the vehicle's value at the end of the horizon?
What if my ownership horizon is shorter than my loan term?
How accurate is the default depreciation curve?
Should I use my actual insurance quote or the calculator's default?
Does paying cash mean the "cost of ownership" is lower?
Sources
- U.S. Department of Energy, fueleconomy.gov: Fuel cost estimation methodology. fueleconomy.gov
Also consulted: iSeeCars: Vehicle depreciation studies by make and model; Carfax: Vehicle history and depreciation data; Consumer Reports: Annual guidance on typical vehicle ownership and operating costs.