Quick Answer: Arkansas's cost of living is 11.0% below the U.S. national average (composite index 89.0), so a $75,000.00 national-average household budget costs about $66,750.00 a year in Arkansas.
Cheap in Every Published Category
Moving a household budget into Arkansas means scaling it by 89.0/100, which runs 11.0% below the U.S. average and places the state 45th of 50 on cost.
What separates Arkansas from most inexpensive states is that no published sub-index works against the discount. Housing is 73.8, groceries 93.5, utilities 94.2. All three sit under the national line, so the composite of 89.0 is not a netting of opposing forces the way it is in states where cheap rent is offset by expensive power.
Entering the default $75,000 baseline returns $66,750.00 and a differential of $8,250.00. That number comes from one multiplication against 89.0. The three sub-indices are reported next to it and are applied nowhere in the headline calculation.
Key Index Components for Arkansas:
- Composite Benchmark Index: 89.0 (Rank #45)
- Housing Cost Index: 73.8
- Utilities Cost Index: 94.2
- Grocery Cost Index: 93.5
How This Is Calculated
Housing is 73.8, groceries 93.5 and utilities 94.2, all below the national line, producing a composite of 89.0 and rank 45 of 50. The calculator takes that 89.0 and prices your national-average budget at it.
- Baseline budget. You enter annual household spending priced at the national benchmark, index 100.0.
- Composite lookup. Arkansas's composite index of 89.0 is read from the 2026 MERIC state table, along with its rank of #45 among the 50 states.
- Single-factor scaling. The baseline is multiplied by 89.0 and divided by 100. Nothing else happens. Housing 73.8, groceries 93.5 and utilities 94.2 are separate index ratios shown for orientation; the engine does not apportion your budget across them and applies no category weights.
- Differential. The dollar and percentage difference against the baseline come off the scaled result. The percentage is fixed at -11.0% for every budget the tool will accept.
Worked Example
Using this calculator's baseline scenario: a household needing $75,000.00 a year to sustain a standard basket of goods, priced at the U.S. national average (composite index 100.0).
- National baseline. $75,000.00 is the reference spending level at the national-average price level (index 100.0).
- Apply Arkansas's composite index. Arkansas's composite index of 89.0 (rank #45 nationally) means local prices run 11.0% below the national basket. Scaling: $75,000.00 × (89.0 ÷ 100) = $66,750.00.
- Dollar differential. The engine returns -$8,250.00, the amount by which the budget can shrink while holding the same basket.
- Percentage. That is -11.0%, unchanged at every budget size.
The Discount Is Linear All the Way Up
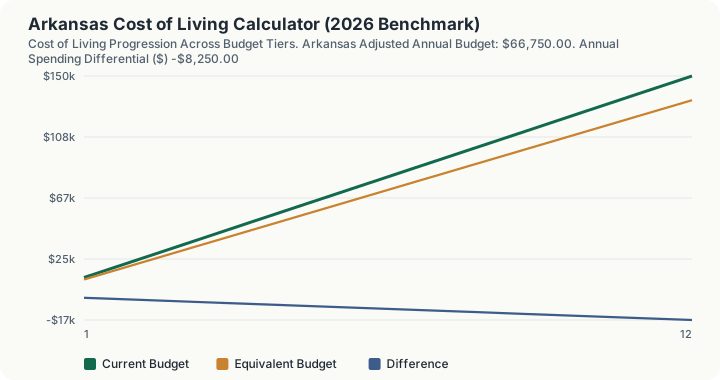
This calculator contains no bracket, no cliff and no cap. It is one multiplication, so the sweep is a straight line and the saving grows in exact proportion to the budget:
- $10,000 baseline returns $8,900.00, a differential of -$1,100.00.
- $50,000 returns $44,500.00, differential -$5,500.00.
- $75,000 returns $66,750.00, differential -$8,250.00.
- $120,000 returns $106,800.00, differential -$13,200.00.
- $200,000 returns $178,000.00, differential -$22,000.00.
The composite stays 89.0 and the percentage stays -11.0% across that whole range. A high earner does not get a proportionally larger discount here; they get the same 11.0% applied to a larger number, which is a different claim and the one the engine supports.
The next thousand dollars. A $75,000 baseline returns $66,750.00; a $76,000 baseline returns $67,640.00. That step is what each extra $1,000 of national-baseline spending costs in Arkansas, at every point on the sweep.
Working Backwards From an Arkansas Budget
Someone already spending $75,000 a year in Arkansas usually wants the opposite calculation: what national-average budget does that correspond to, and therefore what would the same life cost after a move out of state.
Running the engine to the dollar:
- A baseline of $84,269 returns $74,999.41.
- A baseline of $84,270 returns $75,000.30.
So $75,000 of Arkansas spending sits at roughly $84,270 of national-baseline spending. As a sanity anchor, an $85,000 baseline returns $75,650.00, already past the target.
Adding the Percentage Back Is Not the Inverse
The frequent error is treating the differential as symmetric. Arkansas is 11.0% cheaper, so it seems to follow that $75,000 of Arkansas spending equals $75,000 plus 11.0%, or $83,250 of national baseline.
Run $83,250 and the engine returns $74,092.50, below the $75,000 target rather than on it. The correct reversal divides by the index rather than adding the percentage back, and the verified pair is $84,270 in, $75,000.30 out. The gap between $83,250 and $84,270 is real money in a relocation negotiation, and it exists purely because a percentage discount and its reversal are taken against different bases.
What the Multiplier Schedule Is Really Doing
The 12-row table beneath the calculator varies one thing only, the budget, and applies the same composite 89.0 to every row. That makes the middle column a single series that can be read from top to bottom without correction.
Row i scales the baseline to budget × i ÷ 6. At the default $75,000 the tiers rise in $12,500.00 steps: row 1 prices $12,500.00 and returns $11,125.00; row 3 prices $37,500.00 and returns $33,375.00; row 6 prices the $75,000.00 you entered and returns $66,750.00, which is the headline figure exactly; row 12 prices $150,000.00 and returns $133,500.00. There is no row anywhere in the sweep where a larger budget produces a smaller equivalent.
Because Arkansas prices below the national line, the difference column is negative in all twelve rows, and it is always the same 11.0% of that row's tier: -$1,375.00 at row 1, -$5,500.00 at row 4, -$8,250.00 at row 6, -$16,500.00 at row 12. The discount is strictly proportional, so a household with twice the budget saves twice as much and the saving never accelerates or tapers.
None of the table's rows is a category figure. Arkansas publishes housing at 73.8, groceries at 93.5 and utilities at 94.2, and this page prints them so you can see which categories pull the composite down, but the engine multiplies by the composite and by nothing else. No output on this page mixes those three numbers together in any proportion.
What This Does Not Account For
- One index for the whole state. Little Rock, Fayetteville and a Delta county all receive the same 89.0 multiplier. There is no metro, county or ZIP input.
- No knowledge of your spending mix. The engine does not ask what share of your budget is rent, and applies no weighting to the sub-indices.
- No taxes. Arkansas income tax, the state and local sales tax stack, and property millage are all outside this number.
- No year and no inflation. The 89.0 is a static table value; this config is not tax-year sensitive and exposes no date input.
- No income side. A cost index says nothing about local wages. Arkansas prices 11.0% below national, but the tool has no salary input and makes no claim about earnings.
Common Pitfalls
- Assuming an 11.0% pay cut is neutral. Accepting $66,750.00 against a $75,000 national budget holds the basket only under this composite, and only if your spending mix matches the composite's, which the engine never checks.
- Adding the percentage back to reverse the calculation. $83,250 returns $74,092.50, not $75,000. The verified inverse is $84,270.
- Reading the housing index as the headline. Housing at 73.8 is far below the composite; the tool returns the 89.0 result regardless.
- Expecting a bigger discount at higher income. The rate is -11.0% at $10,000 and -11.0% at $200,000.
Frequently Asked Questions
Is Arkansas expensive to live in?
What is the biggest cost factor in Arkansas?
How much salary do I need to maintain my lifestyle in Arkansas?
Does the discount get larger with a bigger budget?
Sources
- U.S. Bureau of Economic Analysis (BEA): Regional Price Parities. bea.gov/data/prices-inflation/regional-price-parities-state-and-metro-area
- U.S. Bureau of Labor Statistics (BLS): Consumer Expenditure Survey. bls.gov/cex
- Arkansas Department of Finance and Administration, the official state tax authority for Arkansas rates, rules and forms. dfa.arkansas.gov
Also consulted: MERIC: Cost of Living Data Series (2025/2026), composite index 89.0, rank #45.