What is $100,000 really worth in other countries?
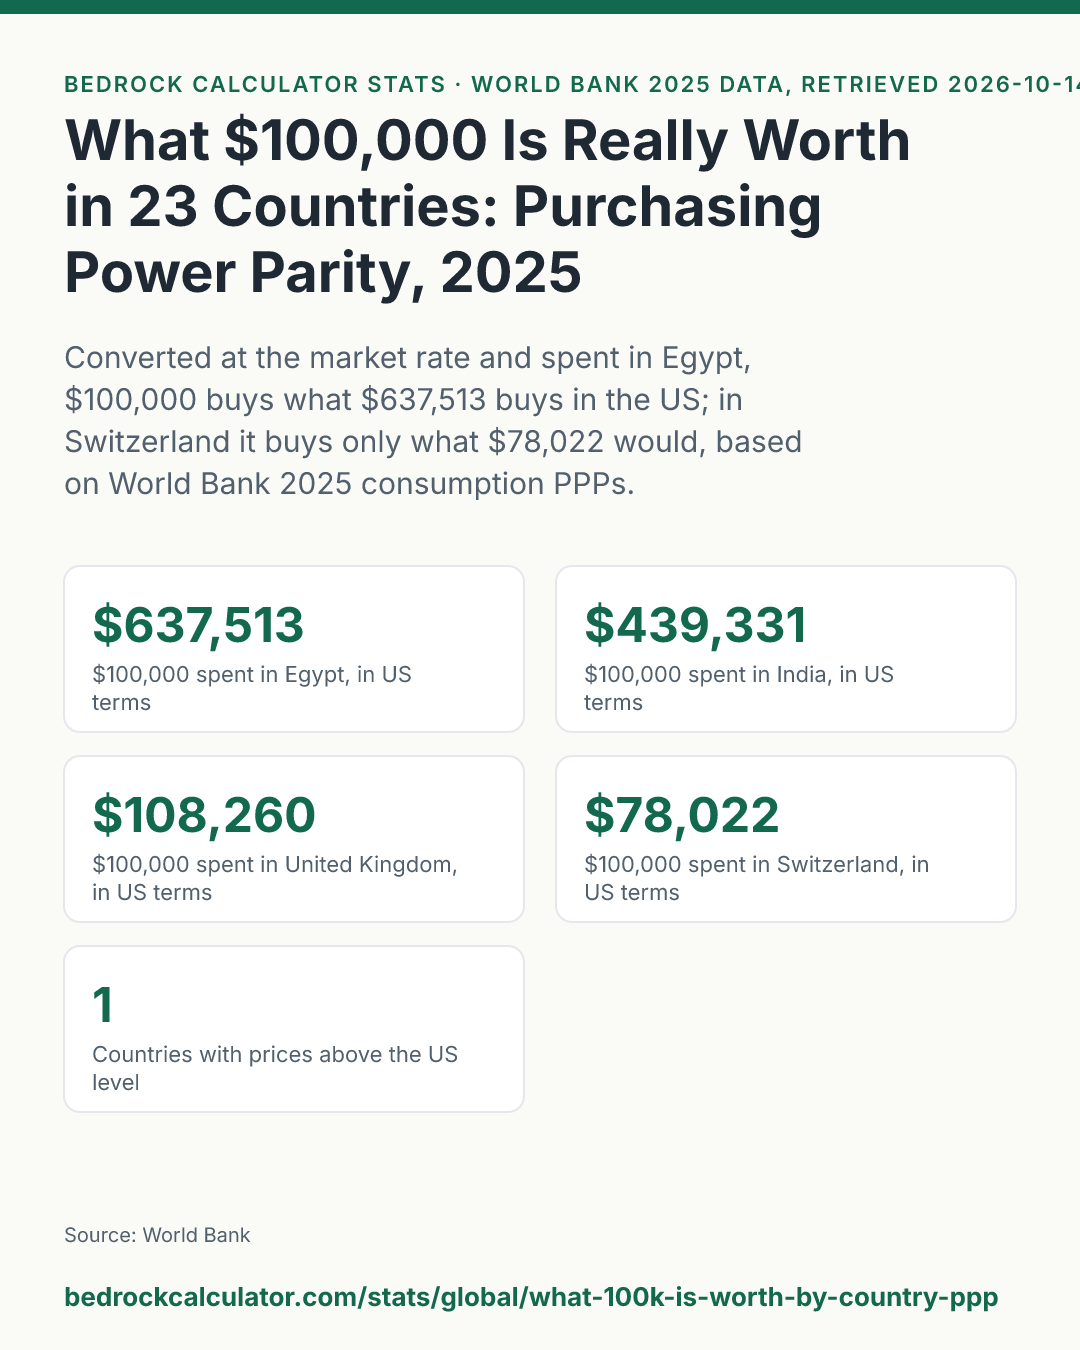
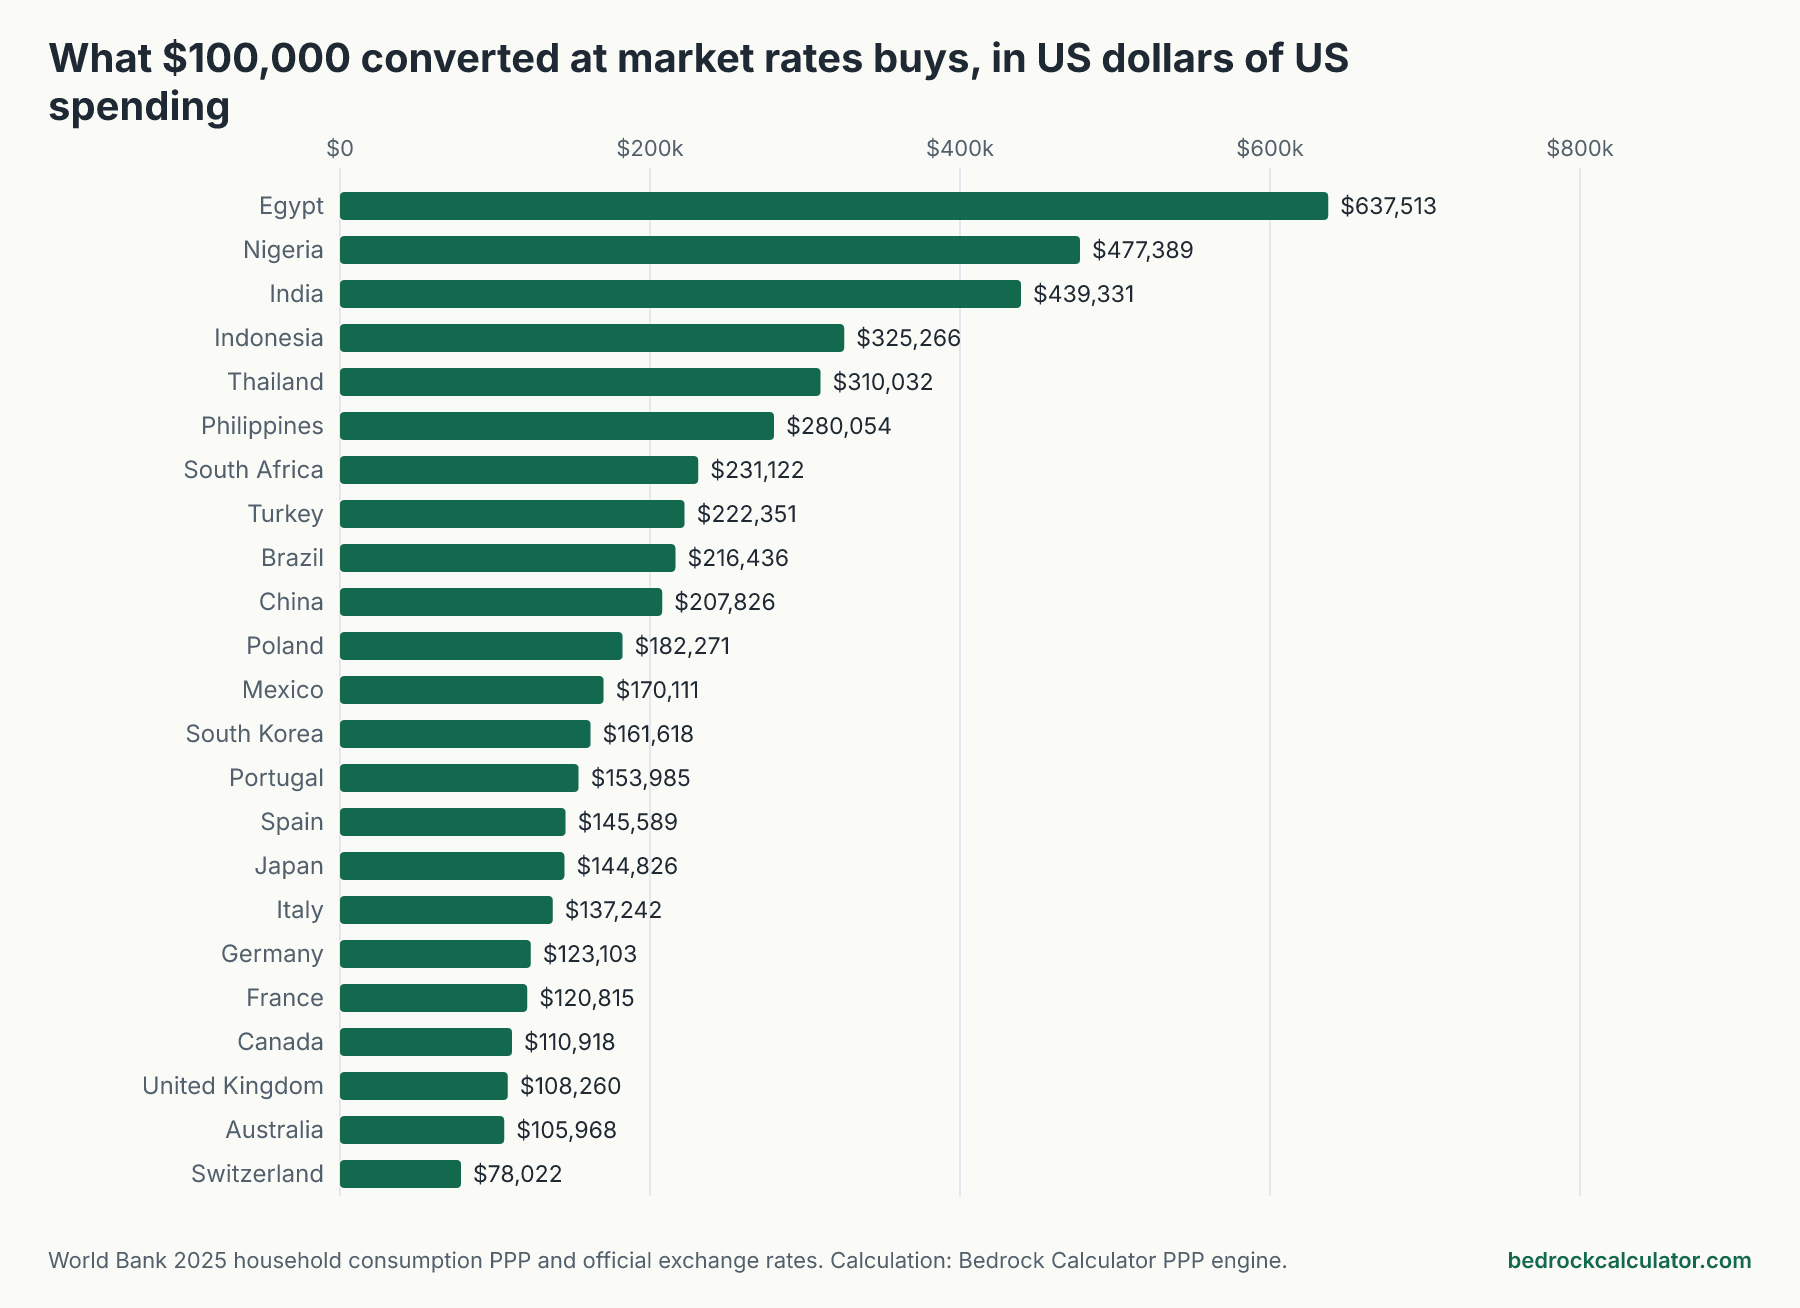
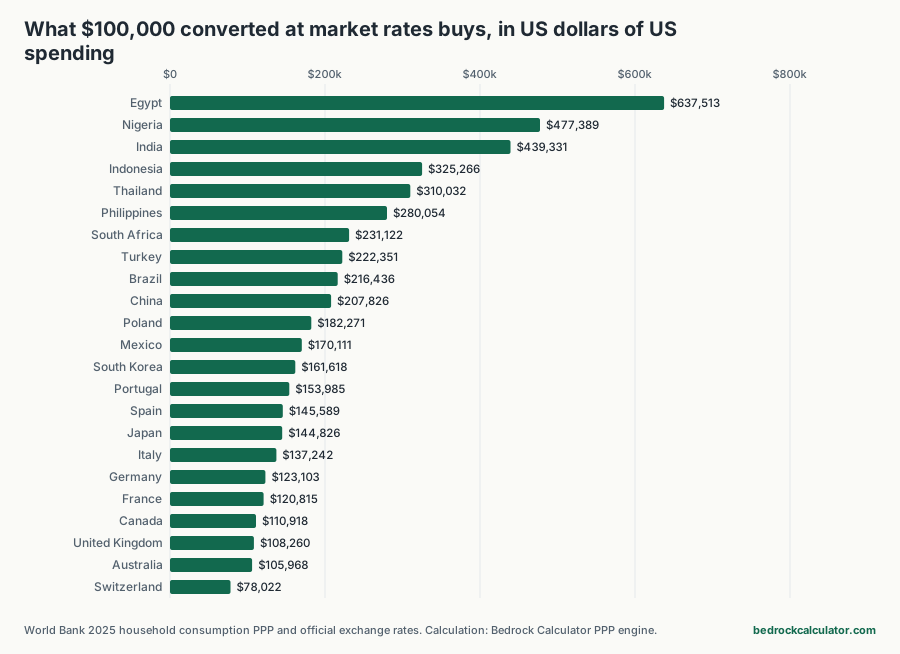
A US dollar doesn't buy the same amount everywhere. Take $100,000, convert it at the market exchange rate and spend it in Egypt, and by the World Bank's 2025 figures it buys what $637,513 buys in the United States. In India it buys what $439,331 would.
At the other end, in Switzerland, the same $100,000 buys only what $78,022 buys at home.
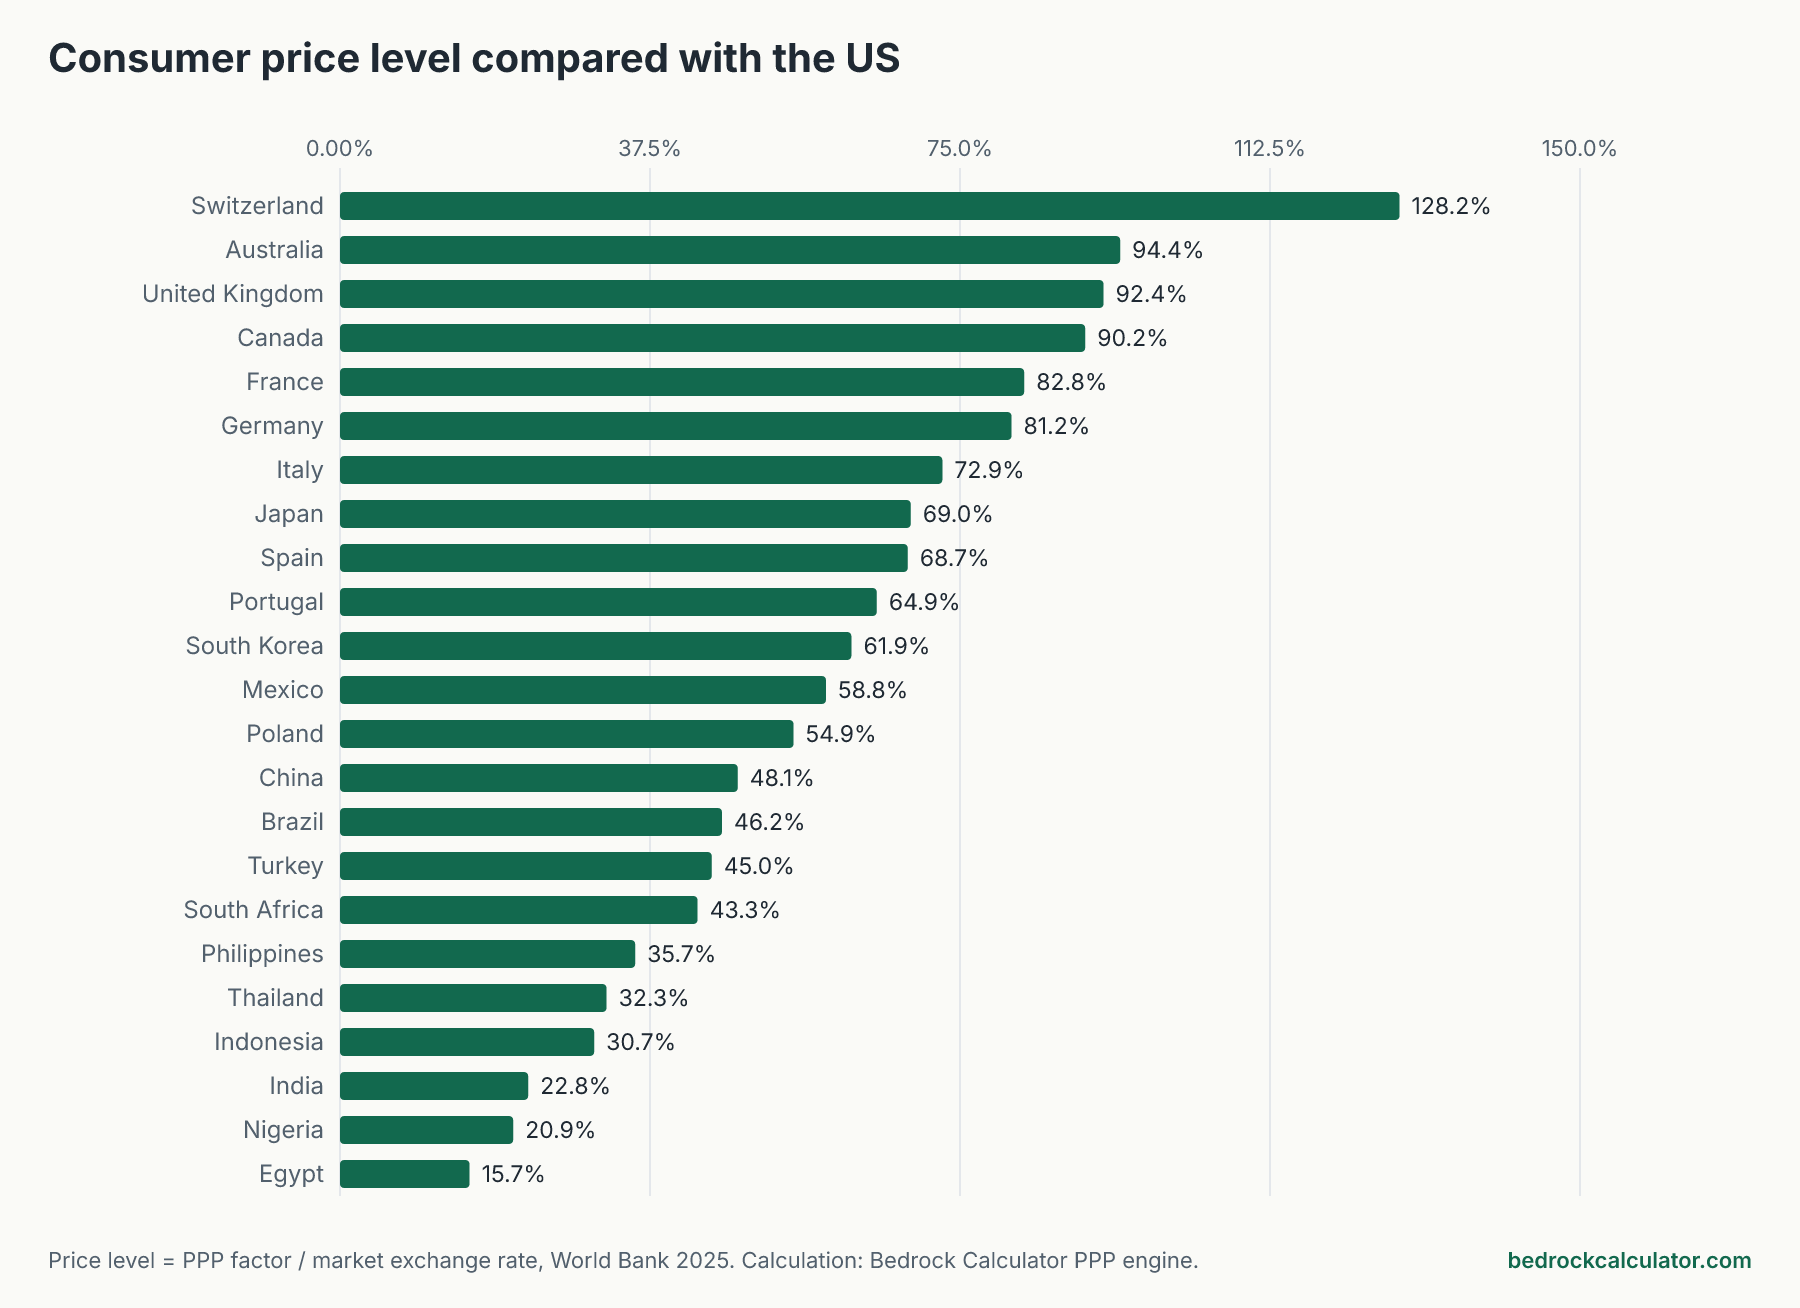
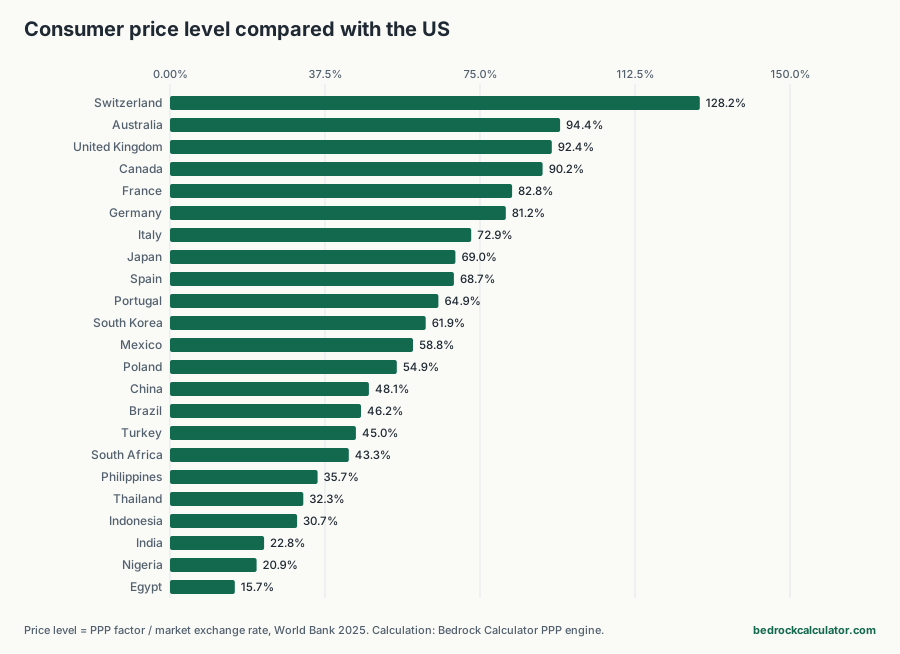
Of the 23 countries we looked at, 22 have consumer prices below the US level. The exception is Switzerland.
How we worked out these numbers
This page uses two series published by the World Bank in its World Development Indicators, both for 2025 and both measured in local currency per US dollar:
- The PPP conversion factor for household consumption. It's the amount of local currency that buys the same basket of household goods and services that one dollar buys in the US. The World Bank builds it from the International Comparison Program, which prices comparable items country by country.
- The official exchange rate, averaged over the year.
We downloaded both from the World Bank on 2026-10-14 (the dataset was last updated on 2026-10-08), stored the exact figures with the article, and stated every factor in the table below. Nothing was rounded before the calculation.
The arithmetic runs through the same functions as this site's purchasing power parity calculator. We treat the US as home and each country as abroad, price a $100,000 basket in both, and get the PPP exchange rate and the gap between it and the market rate. From that gap come the three numbers you'll see:
- Price level vs US: the PPP factor divided by the market rate. Below the US level means local prices are lower once you convert.
- Local currency that matches $100,000 of US spending: $100,000 times the PPP factor.
- US-equivalent value of $100,000 spent there: what your $100,000, converted at the market rate, buys in that country, expressed as the US spending it would take to buy the same things.
Each country's own figures stay in its own currency. We don't mix them. Dollar figures in the last column are US-equivalent values, not conversions.
What $100,000 is worth in 23 countries
Click any column heading to sort. The PPP factor and market rate columns are local currency per US dollar, so the currency column tells you how to read the two local-currency amounts on each row.
What $100,000 is worth in 23 countries, World Bank 2025 PPP
Download CSVPPP factor: household consumption PPP, local currency per US dollar. Market rate: official exchange rate, 2025 average, local currency per US dollar. Local-currency columns are in each country's own currency (see Currency). Source: World Bank World Development Indicators.
| Egypt | EGP | 7.72 | 49.23 | 15.7% | 772,184 | 4,922,776 | $637,513 |
| Nigeria | NGN | 318.06 | 1,518.38 | 20.9% | 31,805,958 | 151,838,095 | $477,389 |
| India | INR | 19.84 | 87.16 | 22.8% | 1,983,892 | 8,715,845 | $439,331 |
| Indonesia | IDR | 5,065.97 | 16,477.87 | 30.7% | 506,596,899 | 1,647,786,518 | $325,266 |
| Thailand | THB | 10.61 | 32.88 | 32.3% | 1,060,626 | 3,288,281 | $310,032 |
| Philippines | PHP | 20.53 | 57.51 | 35.7% | 2,053,355 | 5,750,510 | $280,054 |
| South Africa | ZAR | 7.74 | 17.89 | 43.3% | 773,996 | 1,788,875 | $231,122 |
| Turkey | TRY | 17.74 | 39.45 | 45.0% | 1,774,438 | 3,945,481 | $222,351 |
| Brazil | BRL | 2.58 | 5.59 | 46.2% | 258,149 | 558,729 | $216,436 |
| China | CNY | 3.46 | 7.19 | 48.1% | 345,956 | 718,985 | $207,826 |
| Poland | PLN | 2.06 | 3.76 | 54.9% | 206,316 | 376,054 | $182,271 |
| Mexico | MXN | 11.31 | 19.24 | 58.8% | 1,130,878 | 1,923,751 | $170,111 |
| South Korea | KRW | 880.13 | 1,422.44 | 61.9% | 88,012,536 | 142,244,083 | $161,618 |
| Portugal | EUR | 0.57 | 0.88 | 64.9% | 57,471 | 88,497 | $153,985 |
| Spain | EUR | 0.61 | 0.88 | 68.7% | 60,786 | 88,497 | $145,589 |
| Japan | JPY | 103.34 | 149.66 | 69.0% | 10,333,658 | 14,965,793 | $144,826 |
| Italy | EUR | 0.64 | 0.88 | 72.9% | 64,482 | 88,497 | $137,242 |
| Germany | EUR | 0.72 | 0.88 | 81.2% | 71,888 | 88,497 | $123,103 |
| France | EUR | 0.73 | 0.88 | 82.8% | 73,250 | 88,497 | $120,815 |
| Canada | CAD | 1.26 | 1.4 | 90.2% | 126,048 | 139,811 | $110,918 |
| United Kingdom | GBP | 0.7 | 0.76 | 92.4% | 70,153 | 75,947 | $108,260 |
| Australia | AUD | 1.46 | 1.55 | 94.4% | 146,459 | 155,200 | $105,968 |
| Switzerland | CHF | 1.07 | 0.83 | 128.2% | 106,554 | 83,136 | $78,022 |
Why the dollar goes so far in India and Egypt
PPP gaps are widest in countries where wages are lower. Much of what people spend money on, such as rent, meals out, haircuts and local transport, can't be shipped across borders, so its price tracks local pay rather than world prices.
In India, matching $100,000 of US spending takes INR 1,983,892 at the PPP factor of 19.8389. But $100,000 converted at the market rate of 87.1584 becomes INR 8,715,845, several times as much. That's why the price level comes out at 22.8% of the US and the US-equivalent value at $439,331.
Egypt shows the same pattern even more sharply, with a price level of 15.7%. A falling currency can widen the gap fast, because the market rate moves before local prices catch up.
Is $100,000 worth more in Europe?
Mostly, yes, though by less than many people expect. In Germany the price level is 81.2% of the US, so $100,000 buys what $123,103 would at home. In France it's $120,815, and in Spain $145,589. All three use the euro, so the market rate is the same and the differences come entirely from local prices.
In the United Kingdom the price level is 92.4%, giving $108,260. Canada is similar, at $110,918. Japan comes out well ahead of both at $144,826: its 2025 market rate of 149.6579 yen per dollar is far above its PPP factor of 103.3366.
Switzerland is the outlier. Its price level is 128.2% of the US, so you'd need $128,169 at market rates to buy what $100,000 buys in America.
What PPP doesn't tell you
A PPP factor is a national average across a broad consumption basket. That leaves out a lot of what matters if you're actually thinking of moving or retiring abroad.
City versus country. Prices in a capital or a big expat hub can be far above the national average. Rent in particular varies much more within a country than PPP shows.
Your own basket. If you'd spend heavily on imported goods, international schooling, private healthcare or travel, those cost closer to world prices everywhere, and PPP will flatter the cheaper countries.
Taxes and income. This page measures spending power, not earning power. Converting $100,000 of savings is one thing. Earning a local salary and paying local tax is another, and it changes the picture completely.
Timing. These are 2025 averages. Between the International Comparison Program's benchmark surveys, the World Bank extends the factors using national price data, so recent years are estimates. Exchange rates also move daily, and in countries with high inflation the gap can change a lot within a year.
Quality and availability. A PPP basket tries to price the same item everywhere, but the same item isn't always on the shelf.
Running your own numbers
If you're comparing two specific places, the PPP calculator lets you enter your own basket price at home and abroad along with the current exchange rate, and shows how far the currency sits from parity. To turn a dollar amount into another currency at a rate you choose, use the currency conversion calculator. For moves within the US, the cost of living calculator compares states.