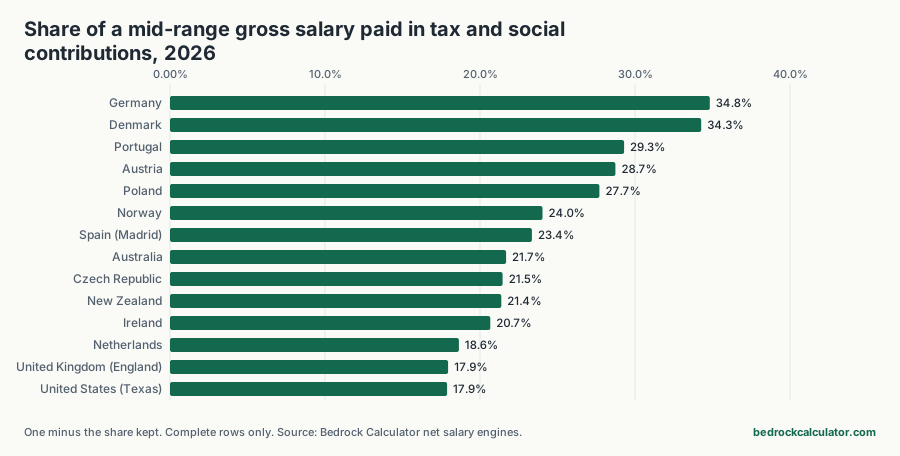
How much of a mid-range salary do you keep in each country?
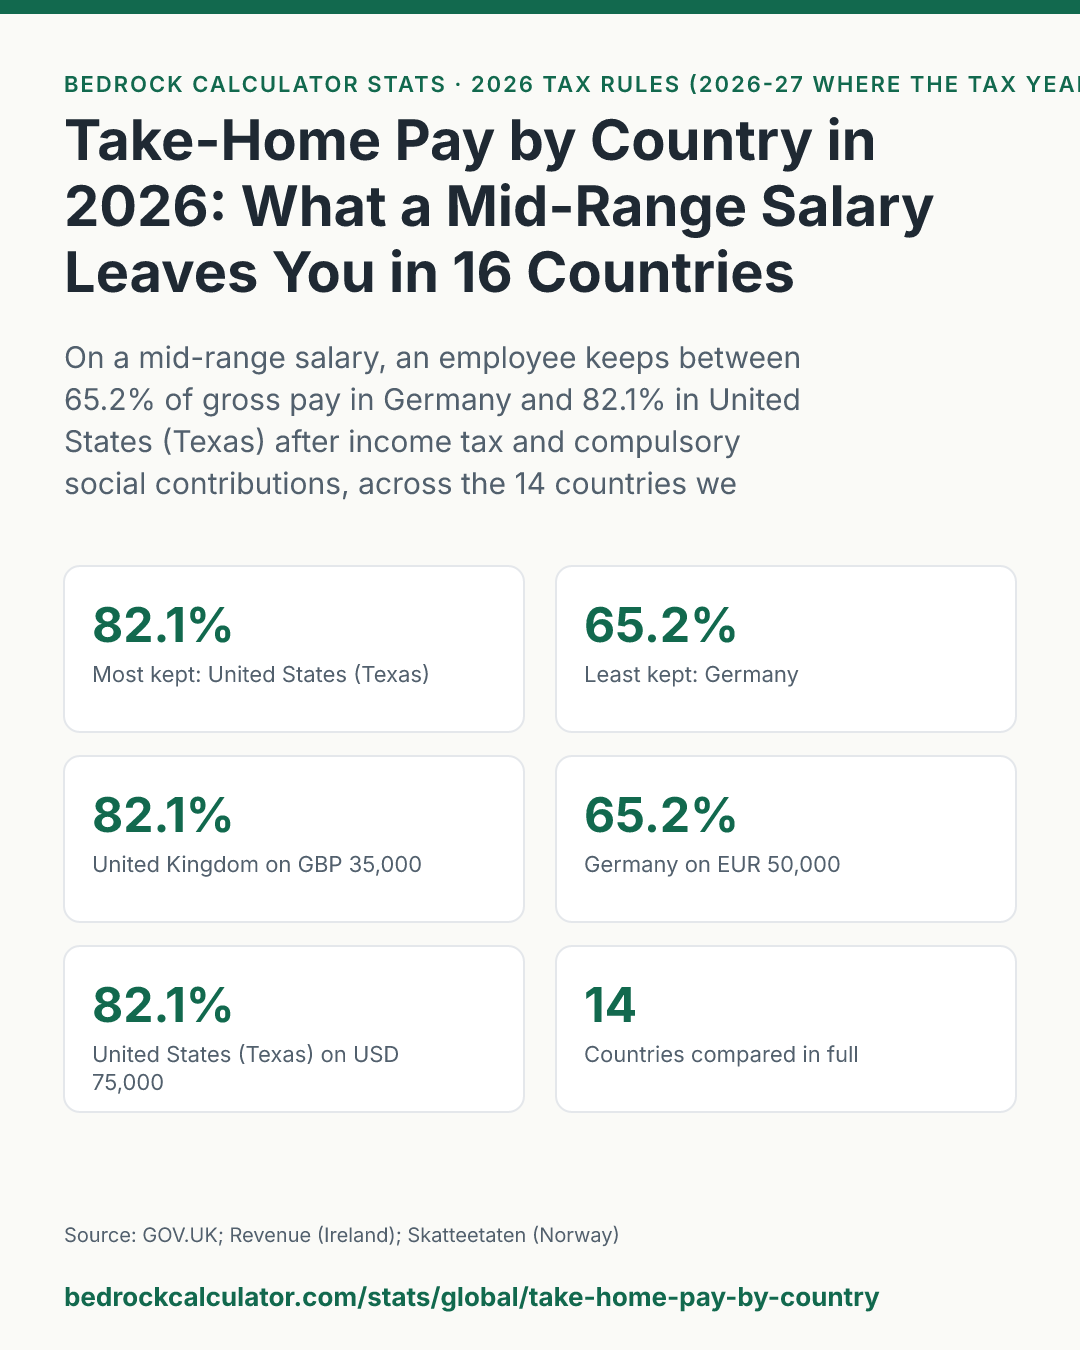
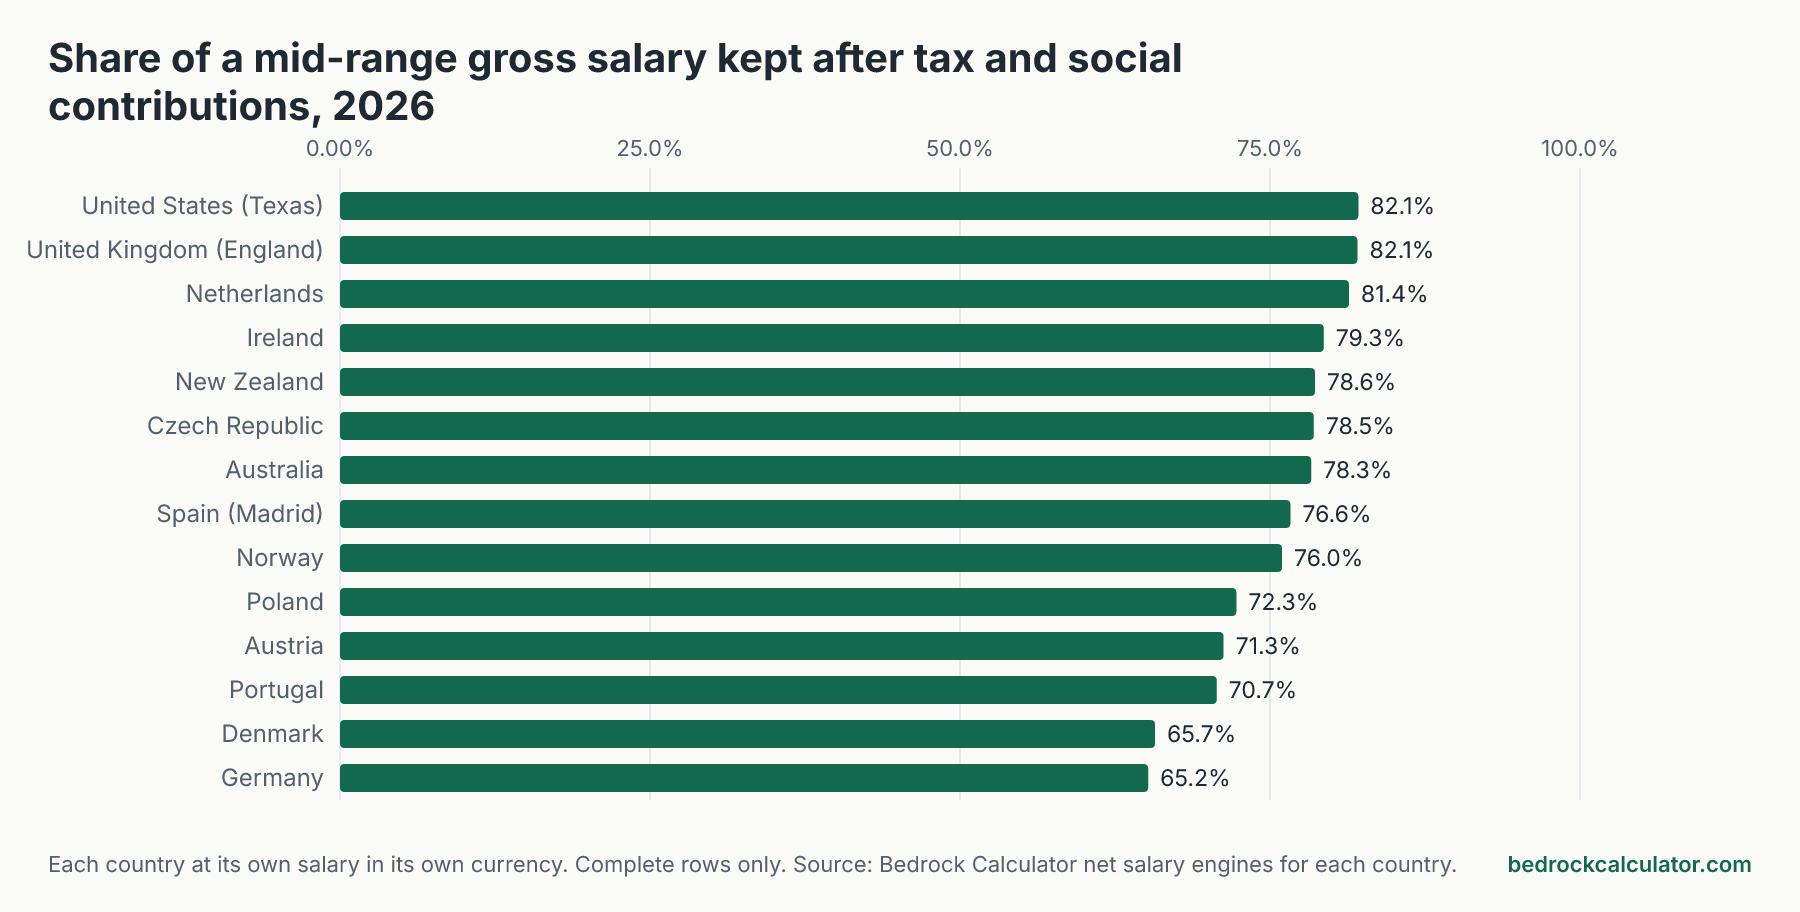
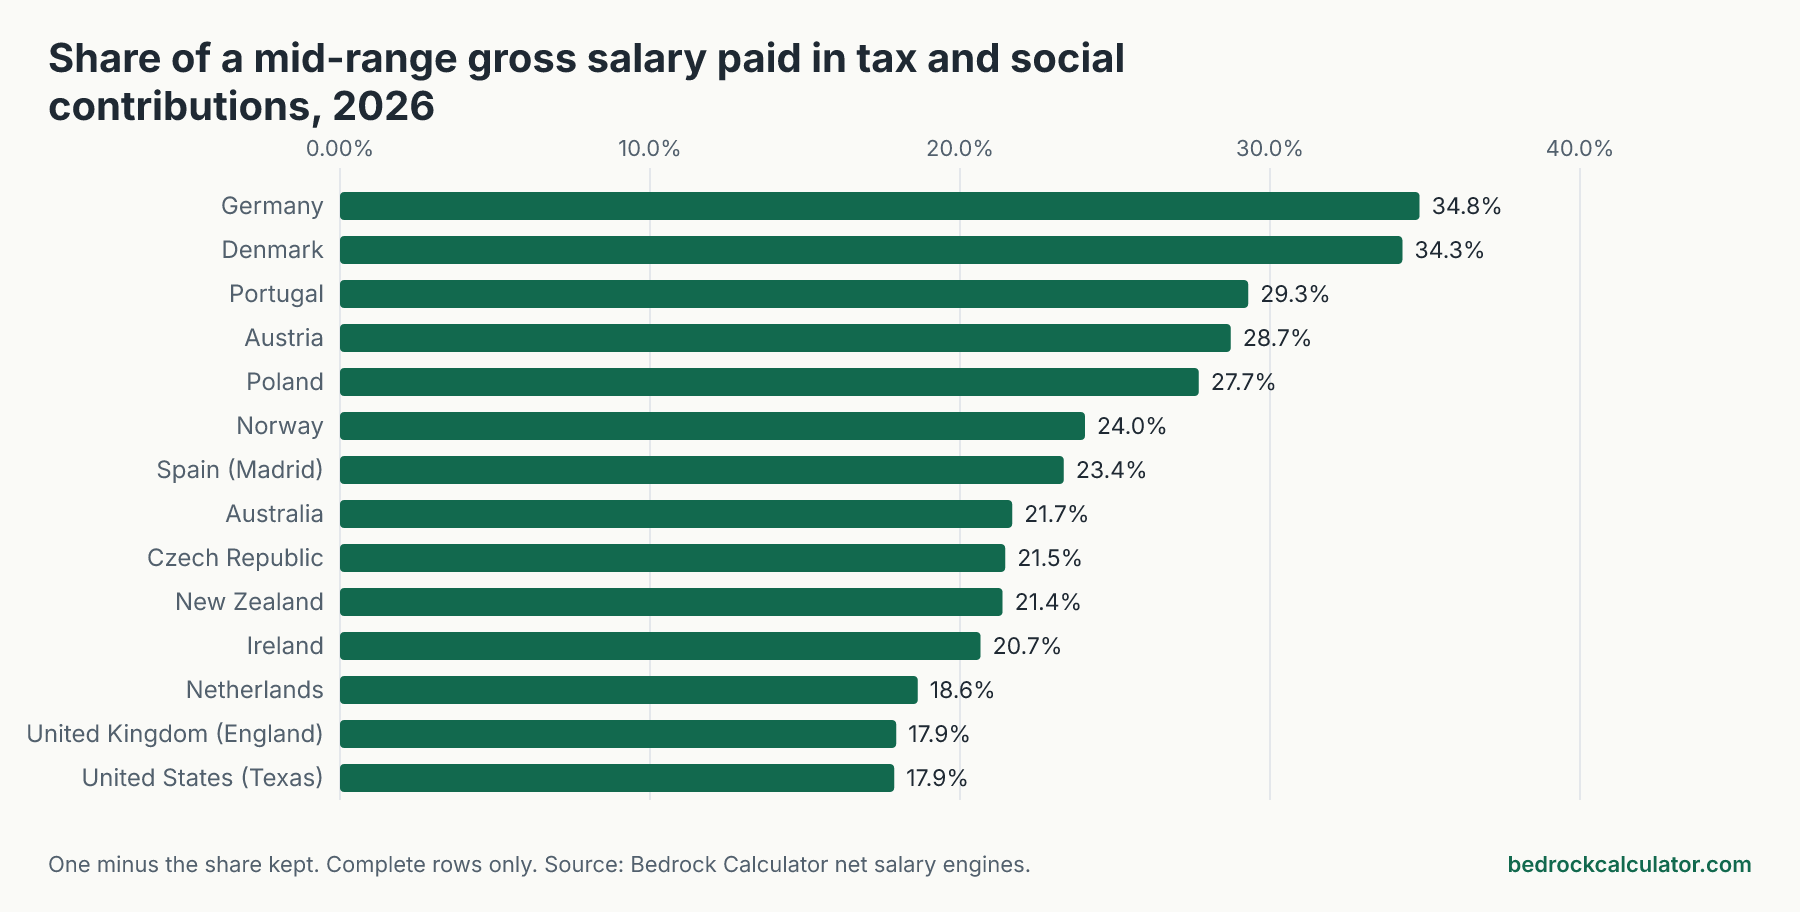
How much of your pay you keep depends a lot on where you work. On a mid-range salary, an employee in United States (Texas) keeps 82.1% of gross pay after income tax and compulsory social contributions. In Germany it's 65.2%. That's a gap of 17.0 percentage points.
Most of the 14 countries we could compare in full sit somewhere in between, with Spain (Madrid) in the middle at 76.6%. The UK and the Netherlands sit near the top, at 82.1% and 81.4%. Germany and Denmark are at the bottom, at 65.2% and 65.7%.
How we worked out these numbers
Every figure comes from the net-salary or income-tax calculator this site has for each country. We picked one round salary in the middle of each country's pay range, ran the calculator once, and recorded the take-home pay it returned. The salary is an input we chose for each country, not an official average, and it's stated in the table.
Each country stays in its own currency. We didn't convert anything to dollars, because a converted figure would mostly measure exchange rates rather than tax. What does compare across borders is the share of gross pay you keep, so that's what we rank.
Every run uses the same kind of person: a single employee with no children, no pension contributions beyond what the law requires, no student loan and no church membership. Where a country needs a region, we've named it: England for the UK, North Rhine-Westphalia for Germany, Madrid for Spain, Stockholm for Sweden and Texas for the US.
Spain is the one country built from two calculators. The Spain social security calculator gives the employee's contribution, and the Spain income tax calculator, which expects pay that's already net of social security, taxes what's left.
Complete and partial results
To compare fairly, a figure has to include both income tax and the social contributions an employee can't avoid. For 14 countries the calculator does that, and those are the ones we rank.
For 2 countries, Finland, Sweden (Stockholm), the calculator leaves something out. Finland's leaves out the earnings-related pension and unemployment insurance contributions. Sweden's leaves out the burial fee and uses approximations for two allowances. Their real take-home pay would be lower than shown, so we include them in the table for reference and keep them out of the ranking.
Take-home pay in 16 countries
Click any column heading to sort. Salary and take-home pay are in the currency shown on each row.
Take-home pay on a mid-range salary in 16 countries, 2026
Download CSVSalary and take-home are in each country's own currency (see Currency); nothing is converted. Single employee, no children, no pension or student loan deductions. Rows marked partial leave out a compulsory contribution and are not ranked.
| United States (Texas) | USD | 75,000 | 61,592.5 | 82.1% | Complete | Federal income tax, Social Security, Medicare (no state income tax in Texas) |
| United Kingdom (England) | GBP | 35,000 | 28,719.6 | 82.1% | Complete | Income Tax, National Insurance |
| Netherlands | EUR | 45,000 | 36,613.71 | 81.4% | Complete | Box 1 income tax including national insurance premiums, after tax credits |
| Sweden (Stockholm) | SEK | 480,000 | 388,105.11 | 80.9% | Partial | Municipal and state income tax after the job tax credit. Approximates two allowances and leaves out church and burial fees |
| Finland | EUR | 42,000 | 33,583.7 | 80.0% | Partial | State and municipal tax, health insurance contributions. Leaves out the TyEL pension and unemployment insurance contributions |
| Ireland | EUR | 50,000 | 39,667.18 | 79.3% | Complete | Income tax, USC, PRSI |
| New Zealand | NZD | 75,000 | 58,967 | 78.6% | Complete | PAYE income tax, ACC earners' levy (KiwiSaver opted out) |
| Czech Republic | CZK | 600,000 | 471,240 | 78.5% | Complete | Income tax after the taxpayer credit, social and health insurance |
| Australia | AUD | 95,000 | 74,400 | 78.3% | Complete | Income tax after offsets, Medicare levy (with private hospital cover) |
| Spain (Madrid) | EUR | 35,000 | 26,827.27 | 76.6% | Complete | Employee social security, then state and Madrid IRPF on the rest |
| Norway | NOK | 600,000 | 455,817.4 | 76.0% | Complete | Tax on general income, bracket tax, national insurance contribution |
| Poland | PLN | 96,000 | 69,402.33 | 72.3% | Complete | PIT, ZUS social insurance, health contribution (employment contract) |
| Austria | EUR | 49,000 | 34,918.61 | 71.3% | Complete | Wage tax and social insurance, 14 salary payments |
| Portugal | EUR | 35,000 | 24,745.74 | 70.7% | Complete | IRS income tax and the 11% employee social security contribution |
| Denmark | DKK | 450,000 | 295,773.04 | 65.7% | Complete | Labour market contribution, state and municipal tax at the national average rate |
| Germany | EUR | 50,000 | 32,586 | 65.2% | Complete | Income tax, solidarity surcharge, pension, health, care and unemployment insurance |
Why Germany and Denmark keep less
On a German salary of EUR 50,000, an employee takes home EUR 32,586. The big deduction isn't income tax. It's social insurance: pension, health, long-term care and unemployment contributions add up to EUR 10,875, against EUR 6,539 of income tax.
Denmark works differently but ends up close by. Almost everything runs through tax: a labour market contribution comes off the top, then state and municipal income tax. On DKK 450,000, an employee keeps DKK 295,773. There's no separate health insurance premium, because healthcare is paid for out of that tax.
Portugal (70.7%) is next. There income tax is the bigger deduction, with the employee's 11% social security on top. Austria (71.3%) and Poland (72.3%) follow, again mostly because of employee social insurance.
Why the UK and the US keep more
On GBP 35,000 in England, an employee keeps GBP 28,720. Income Tax and National Insurance are both charged at their basic rates at this salary, and the first slice of pay is covered by the Personal Allowance.
In the US, a single filer on USD 75,000 in Texas keeps USD 61,593, or 82.1%. Texas has no state income tax, so this is federal tax plus Social Security and Medicare only. In a state with an income tax the share would be lower. There's a big caveat here, though. Most Americans with workplace health cover also pay premiums out of their pay, and none of that is counted. In much of Europe, healthcare is funded through the contributions we do count.
The countries in the middle
Ireland keeps 79.3% of EUR 50,000. Australia keeps 78.3% of AUD 95,000, with the Medicare levy included and private hospital cover assumed, so the Medicare levy surcharge doesn't apply. New Zealand keeps 78.6% of NZD 75,000, with KiwiSaver switched off because it's a savings scheme rather than a tax. Norway keeps 76.0%, the Czech Republic 78.5% and Spain 76.6%.
What this comparison leaves out
A few things matter as much as the percentages.
Different salaries. Each country's salary sits somewhere in the middle of its own pay range, but not at exactly the same point. A country tested at a relatively lower salary will look a little better, because progressive taxes take less from lower pay.
What contributions buy. A German or Austrian employee is paying into pension and health insurance. A US employee's take-home looks higher partly because health insurance isn't in it. Comparing take-home pay alone doesn't tell you who's better off.
Local and personal details. Several calculators use a national average for municipal tax, as in Denmark and Finland, or model a few regions only, as in Spain and Sweden. Children, marriage, pension contributions, church tax and other personal circumstances change the result in every country.
Employer costs. In many European countries the employer pays substantial contributions on top of gross salary. None of that appears here.
Run your own numbers
For your own salary, use the calculator for your country: the UK take-home pay calculator, the Germany net salary calculator, the Ireland income tax, USC and PRSI calculator, the Australia take-home pay calculator, the Norway net salary calculator or the US paycheck calculator, which covers every state.