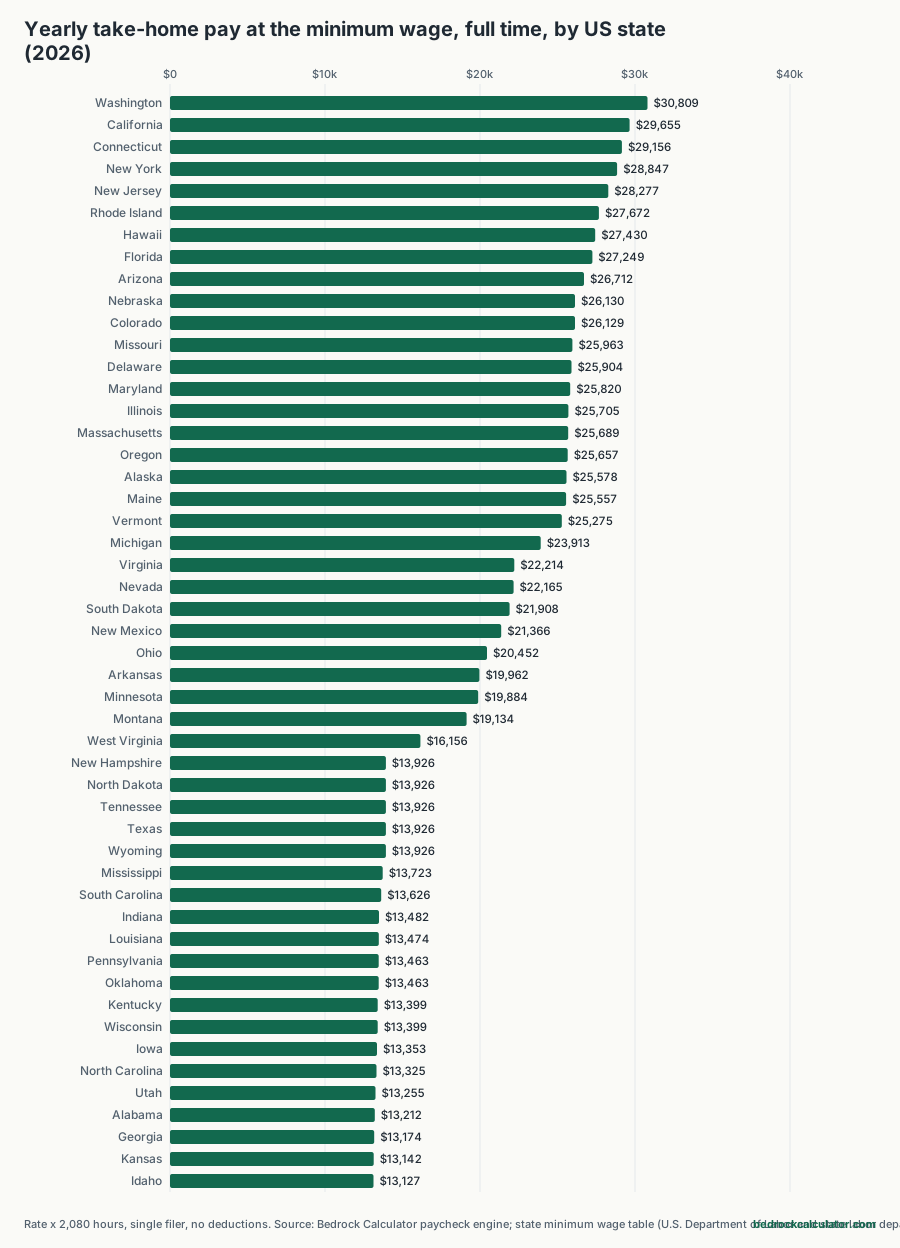
What is the minimum wage in each US state, and what does it pay after tax?
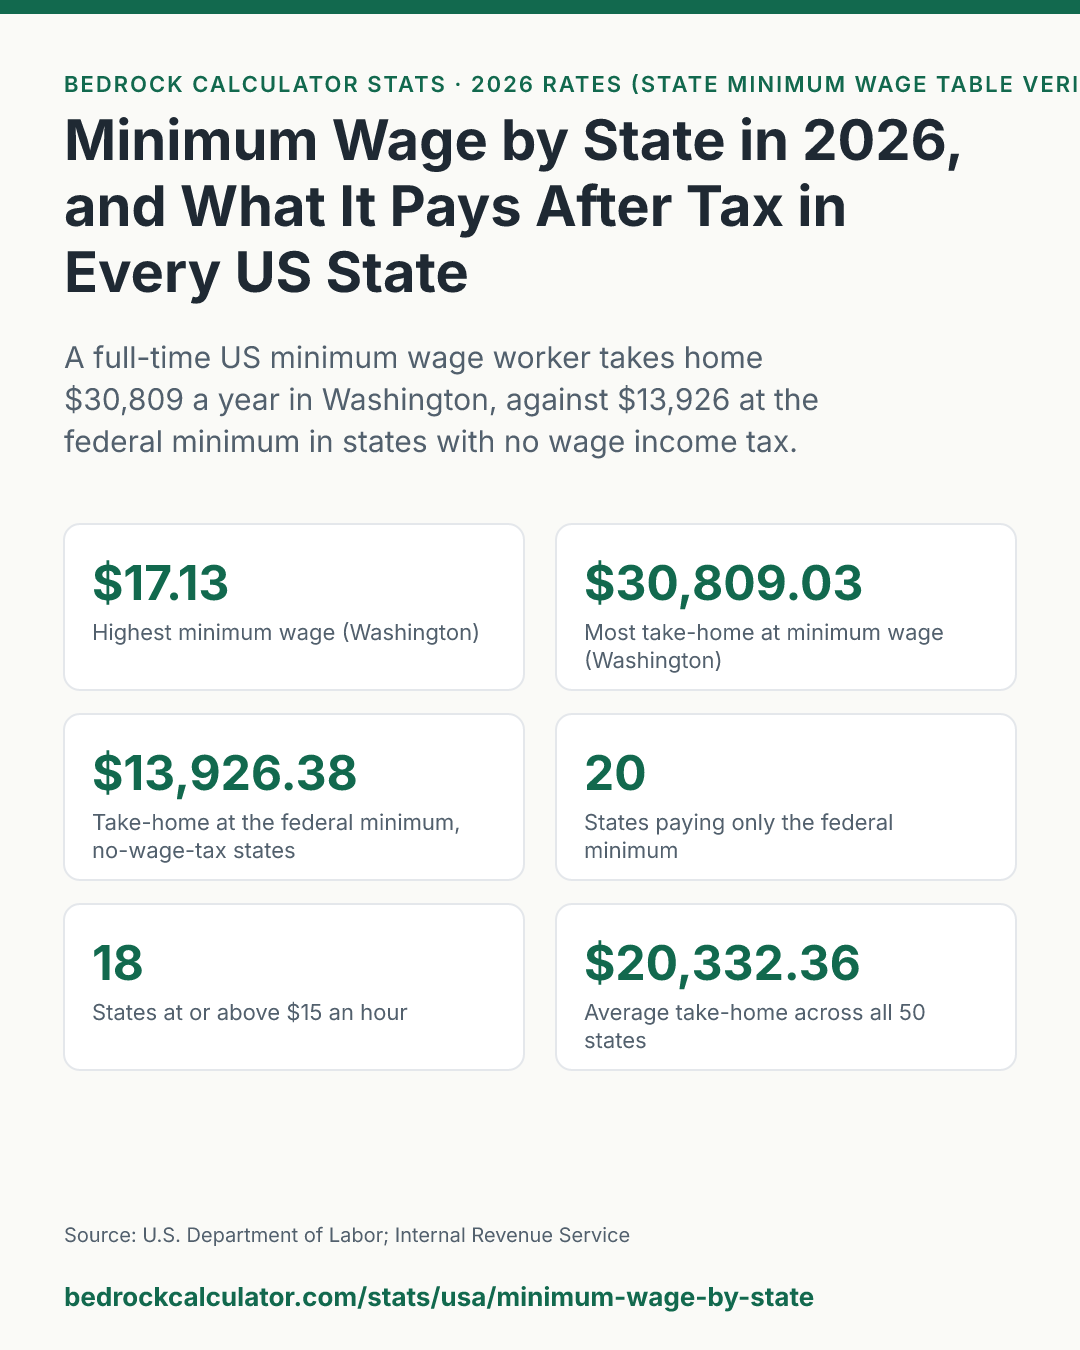
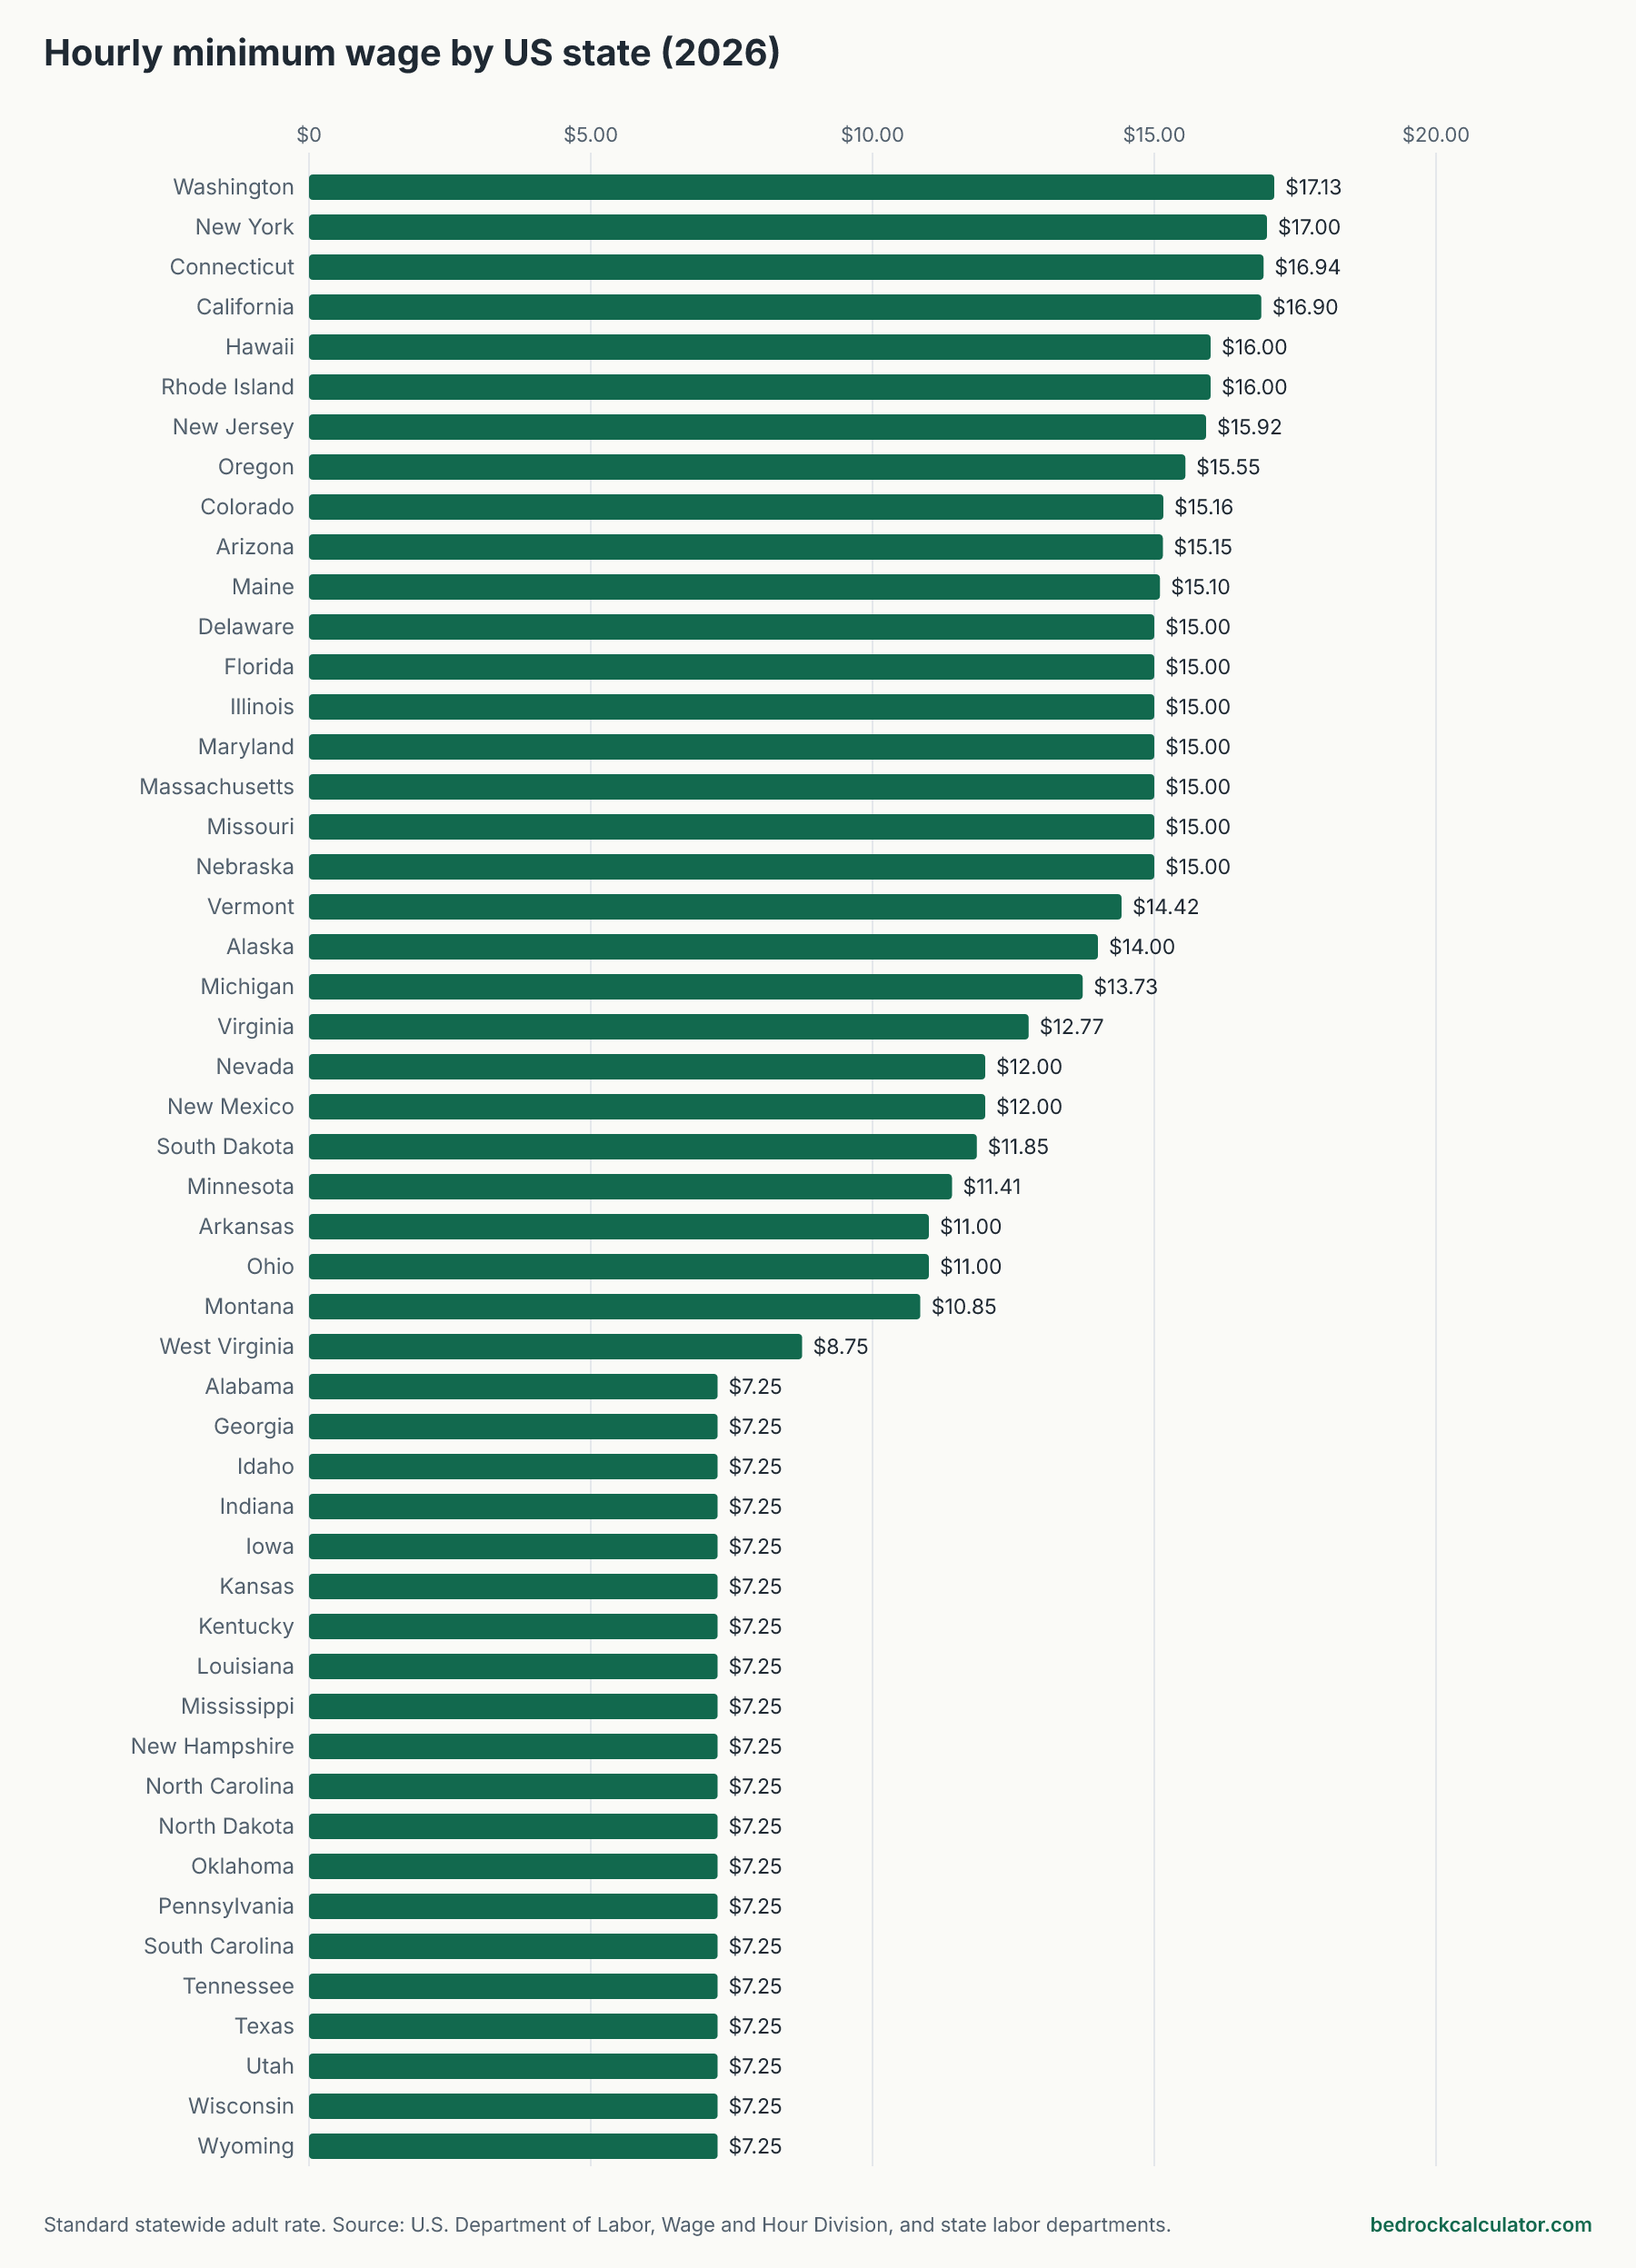
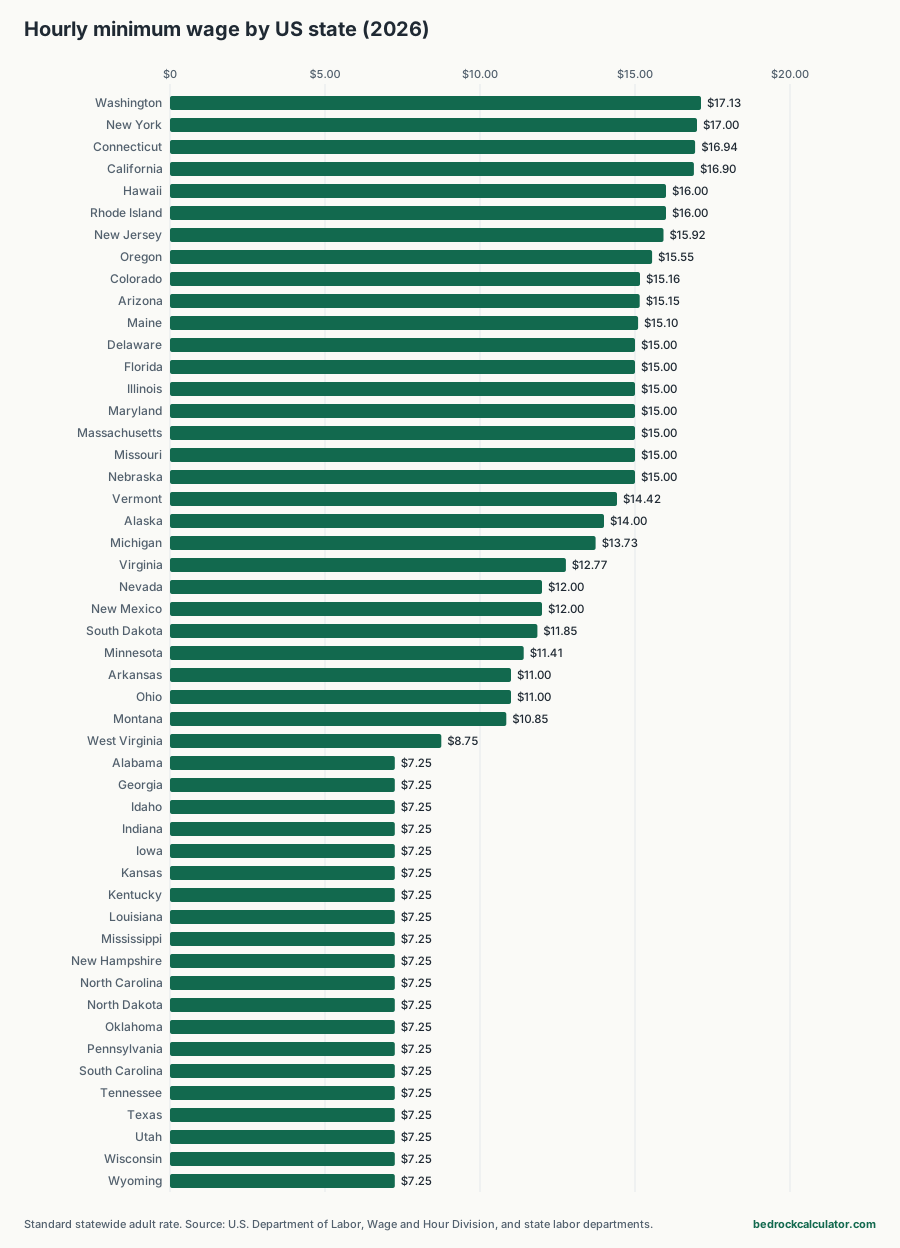
The US minimum wage in 2026 depends almost entirely on which state you work in. Washington has the highest standard rate at $17.13 an hour. 20 states still pay only the federal minimum of $7.25, a rate that hasn't changed since 2009.
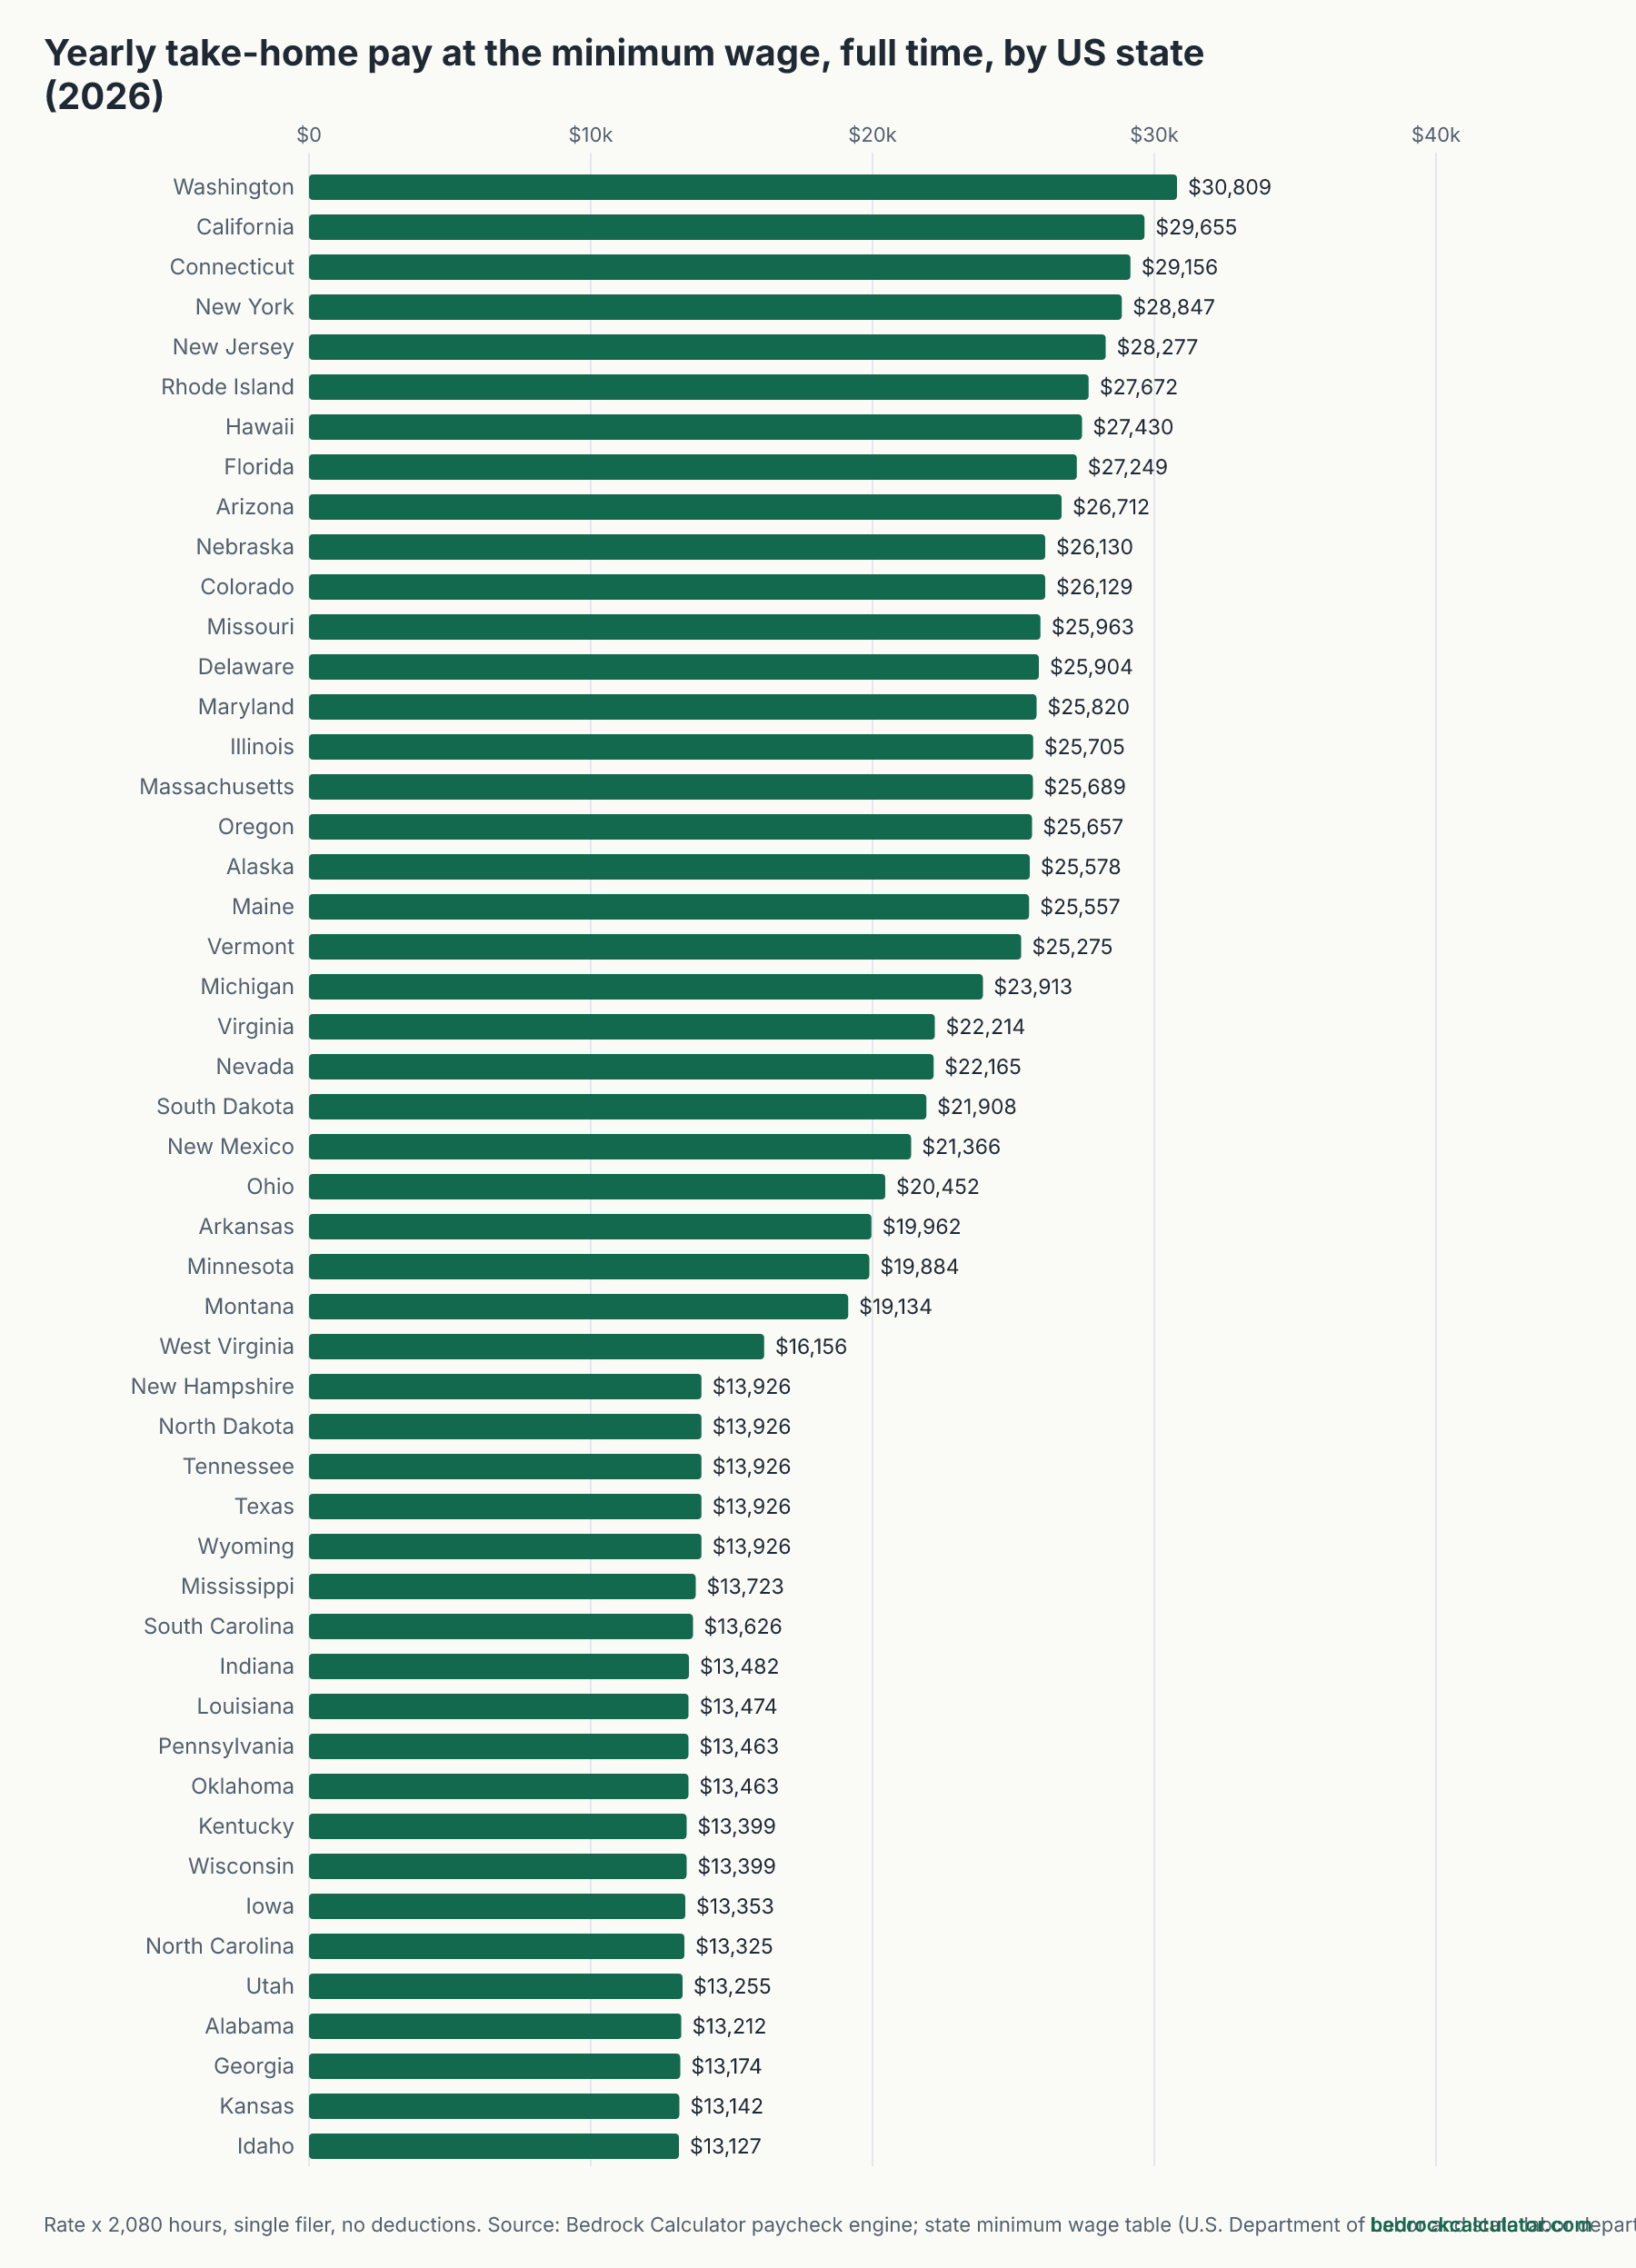
Work 40 hours a week all year at those rates and the difference in take-home pay is large. A full-time minimum wage worker in Washington keeps $30,809.03 after tax, about $2,567.42 a month. At the federal minimum in a state with no wage income tax, such as Texas or Tennessee, the same worker keeps $13,926.38.
How we worked out these numbers
The minimum wage for each state comes from the state minimum wage table behind this site's minimum wage calculator, which was checked against the U.S. Department of Labor and state labor departments. It records each state's standard statewide rate for adults.
To turn that into a yearly take-home figure, we ran the paycheck calculator in hourly mode for every state:
- The state's minimum wage, 40 hours a week, 52 weeks a year
- Single filer, paid every two weeks
- No 401(k), health insurance or other deductions
- 2026 federal brackets and standard deduction, Social Security and Medicare, and each state's income tax schedule
The rate in the table is the one in force when it was last checked, applied to a full year. A few states changed their rate partway through 2026. Alaska's rose on July 1, Oregon adjusts every July 1, and Florida's rose to its current rate on September 30. So for those states, the yearly figure is what a full year at today's rate pays, not what someone earned in calendar 2026.
What full-time minimum wage pays after tax in every state
Sort by any column. The rate note explains regional rates, small-employer rates and scheduled changes.
Minimum wage by state and full-time take-home pay, 2026
Download CSVRate x 40 hours x 52 weeks, single filer, no deductions. Federal income tax, Social Security, Medicare and state income tax with no state deductions or credits; no EITC or local tax.
| Washington | $17.13 | $35,630.40 | $4,821.37 | $0.00 | $30,809.03 | Yes | Indexed annually to CPI-W since Initiative 1433 (2016); one of the longest-running indexed state minimum wages, dating to 2001. |
| California | $16.90 | $35,152.00 | $4,727.36 | $770.01 | $29,654.63 | Yes | Indexed annually to CPI (capped at 3.5%/year) since reaching $15.00 in 2023. |
| Connecticut | $16.94 | $35,235.20 | $4,743.71 | $1,335.58 | $29,155.91 | Yes | Indexed annually to the percentage change in the federal employment cost index. |
| New York | $17.00 | $35,360.00 | $4,768.24 | $1,744.44 | $28,847.32 | No | Rate shown is for New York City, Long Island, and Westchester County; the rest of the state is $16.00. Legislated schedule; begins CPI indexing starting January 2027. |
| New Jersey | $15.92 | $33,113.60 | $4,326.82 | $509.49 | $28,277.29 | Yes | General-employer rate, indexed annually to CPI since reaching $15.00 in 2024. Seasonal and small employers (fewer than 6 employees) and agricultural employers use a lower statutory rate. |
| Rhode Island | $16.00 | $33,280.00 | $4,359.52 | $1,248.00 | $27,672.48 | No | Increased via annual legislative action, not an automatic CPI formula. |
| Hawaii | $16.00 | $33,280.00 | $4,359.52 | $1,490.24 | $27,430.24 | No | Legislated step schedule; next scheduled increase is to $17.00 in 2028. |
| Florida | $15.00 | $31,200.00 | $3,950.80 | $0.00 | $27,249.20 | No | Fla. Const. Art. X, s. 24(c): $1.00 annual steps under Amendment 2 (2020) 'until the Minimum Wage reaches $15.00 per hour on September 30th, 2026'. $15.00 from September 30, 2026 (was $14.00 from September 30, 2025 to September 29, 2026); the tipped cash wage is $11.98 ($3.02 fixed tip credit). From September 30, 2027 the rate is recalculated for inflation each year, taking effect the following January 1. Updated 2026-10-08. |
| Arizona | $15.15 | $31,512.00 | $4,012.10 | $787.80 | $26,712.10 | Yes | Indexed annually to inflation since Proposition 206 (2016). |
| Nebraska | $15.00 | $31,200.00 | $3,950.80 | $1,118.73 | $26,130.47 | No | Reaches the final step of its legislated schedule (Initiative 433, 2022) in 2026; begins CPI indexing starting January 2027. |
| Colorado | $15.16 | $31,532.80 | $4,016.20 | $1,387.44 | $26,129.16 | Yes | Indexed annually to inflation since Amendment 70 (2016). |
| Missouri | $15.00 | $31,200.00 | $3,950.80 | $1,285.77 | $25,963.43 | No | Reaches the final step of its legislated schedule (Proposition A, 2024) in 2026; begins CPI indexing starting January 2027. |
| Delaware | $15.00 | $31,200.00 | $3,950.80 | $1,345.10 | $25,904.10 | No | Flat statutory rate; no automatic inflation indexing. |
| Maryland | $15.00 | $31,200.00 | $3,950.80 | $1,429.50 | $25,819.70 | No | Flat statutory rate; no automatic inflation indexing. |
| Illinois | $15.00 | $31,200.00 | $3,950.80 | $1,544.40 | $25,704.80 | No | Reached the top of its legislated phase-in schedule in 2025; no automatic inflation indexing. |
| Massachusetts | $15.00 | $31,200.00 | $3,950.80 | $1,560.00 | $25,689.20 | No | Flat statutory rate; no automatic inflation indexing. |
| Oregon | $15.55 | $32,344.00 | $4,175.60 | $2,511.10 | $25,657.30 | Yes | Standard (non-metro, non-nonurban-county) rate, indexed annually to CPI-U effective each July 1. Portland metro rate is $16.80; nonurban-county rate is $14.55. |
| Alaska | $14.00 | $29,120.00 | $3,542.08 | $0.00 | $25,577.92 | Yes | Indexed annually to inflation; increased to $14.00 effective July 1, 2026. |
| Maine | $15.10 | $31,408.00 | $3,991.68 | $1,859.74 | $25,556.58 | Yes | Indexed annually to CPI since 2017. |
| Vermont | $14.42 | $29,993.60 | $3,713.74 | $1,004.79 | $25,275.07 | Yes | Indexed annually to inflation since 2021. |
| Michigan | $13.73 | $28,558.40 | $3,431.73 | $1,213.73 | $23,912.94 | No | Legislated catch-up schedule following a 2024 court ruling; transitions to CPI indexing starting February 2027. |
| Virginia | $12.77 | $26,561.60 | $3,078.12 | $1,269.79 | $22,213.69 | Yes | Indexed annually to CPI since the reenactment requirement was removed from the 2020 minimum-wage law. |
| Nevada | $12.00 | $24,960.00 | $2,795.44 | $0.00 | $22,164.56 | No | Flat statutory rate since scheduled increases ended in July 2024; no automatic inflation indexing. |
| South Dakota | $11.85 | $24,648.00 | $2,740.38 | $0.00 | $21,907.62 | Yes | Indexed annually to inflation since a 2014 constitutional amendment. |
| New Mexico | $12.00 | $24,960.00 | $2,795.44 | $798.28 | $21,366.28 | No | Flat statutory rate; no automatic inflation indexing. |
| Ohio | $11.00 | $22,880.00 | $2,428.32 | $0.00 | $20,451.68 | Yes | Indexed annually to CPI-W under a 2006 constitutional amendment. Applies to employers with annual gross receipts above a statutory threshold ($405,000 for 2026); smaller employers and 14-15 year-old workers use the federal $7.25 rate. |
| Arkansas | $11.00 | $22,880.00 | $2,428.32 | $489.92 | $19,961.76 | No | Flat statutory rate; no automatic inflation indexing. |
| Minnesota | $11.41 | $23,732.80 | $2,578.84 | $1,269.70 | $19,884.26 | Yes | Indexed annually to inflation since 2018, capped at a 2.5% annual increase. |
| Montana | $10.85 | $22,568.00 | $2,373.26 | $1,060.70 | $19,134.04 | Yes | Indexed annually to inflation since a 2006 ballot initiative. |
| West Virginia | $8.75 | $18,200.00 | $1,602.30 | $441.42 | $16,156.28 | No | Flat statutory rate; no automatic inflation indexing. |
| New Hampshire | $7.25 | $15,080.00 | $1,153.62 | $0.00 | $13,926.38 | No | State minimum wage is set equal to the federal rate. |
| North Dakota | $7.25 | $15,080.00 | $1,153.62 | $0.00 | $13,926.38 | No | State minimum wage is set equal to the federal rate. |
| Tennessee | $7.25 | $15,080.00 | $1,153.62 | $0.00 | $13,926.38 | No | No state minimum wage law; the federal minimum wage of $7.25 applies. |
| Texas | $7.25 | $15,080.00 | $1,153.62 | $0.00 | $13,926.38 | No | State minimum wage is set equal to the federal rate. |
| Wyoming | $7.25 | $15,080.00 | $1,153.62 | $0.00 | $13,926.38 | No | State statutory rate is $5.15, but the federal $7.25 rate governs almost all covered employers. |
| Mississippi | $7.25 | $15,080.00 | $1,153.62 | $203.20 | $13,723.18 | No | No state minimum wage law; the federal minimum wage of $7.25 applies. |
| South Carolina | $7.25 | $15,080.00 | $1,153.62 | $300.09 | $13,626.29 | No | No state minimum wage law; the federal minimum wage of $7.25 applies. |
| Indiana | $7.25 | $15,080.00 | $1,153.62 | $444.86 | $13,481.52 | No | State minimum wage is set equal to the federal rate. |
| Louisiana | $7.25 | $15,080.00 | $1,153.62 | $452.40 | $13,473.98 | No | No state minimum wage law; the federal minimum wage of $7.25 applies. |
| Pennsylvania | $7.25 | $15,080.00 | $1,153.62 | $462.96 | $13,463.42 | No | State minimum wage is set equal to the federal rate. |
| Oklahoma | $7.25 | $15,080.00 | $1,153.62 | $463.85 | $13,462.53 | No | State minimum wage is set equal to the federal rate. |
| Kentucky | $7.25 | $15,080.00 | $1,153.62 | $527.80 | $13,398.58 | No | State minimum wage is set equal to the federal rate. |
| Wisconsin | $7.25 | $15,080.00 | $1,153.62 | $527.80 | $13,398.58 | No | State minimum wage is set equal to the federal rate. |
| Iowa | $7.25 | $15,080.00 | $1,153.62 | $573.04 | $13,353.34 | No | State minimum wage is set equal to the federal rate. |
| North Carolina | $7.25 | $15,080.00 | $1,153.62 | $601.69 | $13,324.69 | No | State minimum wage is set equal to the federal rate. |
| Utah | $7.25 | $15,080.00 | $1,153.62 | $671.06 | $13,255.32 | No | State minimum wage is set equal to the federal rate. |
| Alabama | $7.25 | $15,080.00 | $1,153.62 | $714.00 | $13,212.38 | No | No state minimum wage law; the federal minimum wage of $7.25 applies. |
| Georgia | $7.25 | $15,080.00 | $1,153.62 | $752.49 | $13,173.89 | No | State statutory rate is $5.15, but it applies only to employers not covered by the federal Fair Labor Standards Act; in practice the federal $7.25 rate governs almost all Georgia employers. |
| Kansas | $7.25 | $15,080.00 | $1,153.62 | $784.16 | $13,142.22 | No | State minimum wage is set equal to the federal rate. |
| Idaho | $7.25 | $15,080.00 | $1,153.62 | $799.24 | $13,127.14 | No | State minimum wage is set equal to the federal rate. |
The big caveat: state tax at low incomes
This is the most important thing to know about these numbers. The paycheck calculator applies each state's tax rates to your wages but doesn't apply state standard deductions, personal exemptions or credits. For a high earner that makes a small difference. For a minimum wage worker it can be the whole state tax bill.
That's why some of the lowest figures in the table belong to states that pay the federal minimum and have an income tax. Idaho shows the largest state tax of those, $799.24, on a full-time federal minimum wage income of $15,080. In many states, a standard deduction or personal exemption would cut that tax sharply or erase it. The highest state tax in our runs at any minimum wage is $2,511.10, in Oregon, and it's likely overstated for the same reason.
The figures for states with no wage income tax are not affected by this. In New Hampshire, North Dakota, Tennessee, Texas and Wyoming, the federal minimum leaves $13,926.38 after federal income tax, Social Security and Medicare. On that income, federal tax and FICA together come to $1,153.62.
Federal credits are left out too. A low-income worker may qualify for the Earned Income Tax Credit, which can add a refund well beyond what was withheld. None of that is counted here, so for many minimum wage workers, real yearly income after tax is higher than the table shows.
Where the minimum wage stands in 2026
18 states now have a standard minimum wage of at least $15 an hour. The simple average across all 50 states is $11.41, but that average hides a wide spread, from the 20 states at the federal floor to Washington at the top.
15 states raised their rate this year through automatic inflation indexing, so their minimum rises each year without a new law. Others, including Missouri, Nebraska and Michigan, are on legislated schedules that switch to inflation indexing in a later year. You can see which in the table.
Several states also have more than one rate. New York's figure here is the rate for New York City, Long Island and Westchester County, and the rest of the state is lower. Oregon has a higher Portland metro rate and a lower rate in rural counties. New Jersey and Ohio have lower rates for some smaller employers.
What these numbers leave out
- City and county minimum wages. Many cities set their own higher minimum. Those aren't in the table.
- Tipped and youth wages. Lower cash wages for tipped workers and some young workers aren't covered.
- State deductions and credits. As explained above, the state tax line is likely overstated in many states.
- Local income tax and state payroll premiums, such as Washington's paid family leave and long-term care premiums, aren't deducted.
- Overtime and irregular hours. We assume exactly 40 hours every week and no overtime.
Run your own numbers
To see your own pay, open the paycheck calculator, choose Hourly and enter your rate and hours. State pages like the Washington paycheck calculator and the Texas paycheck calculator explain the rules for each state, and the minimum wage calculator shows what the minimum pays by the hour, week and year.