How much state tax does a typical US household pay in each state?
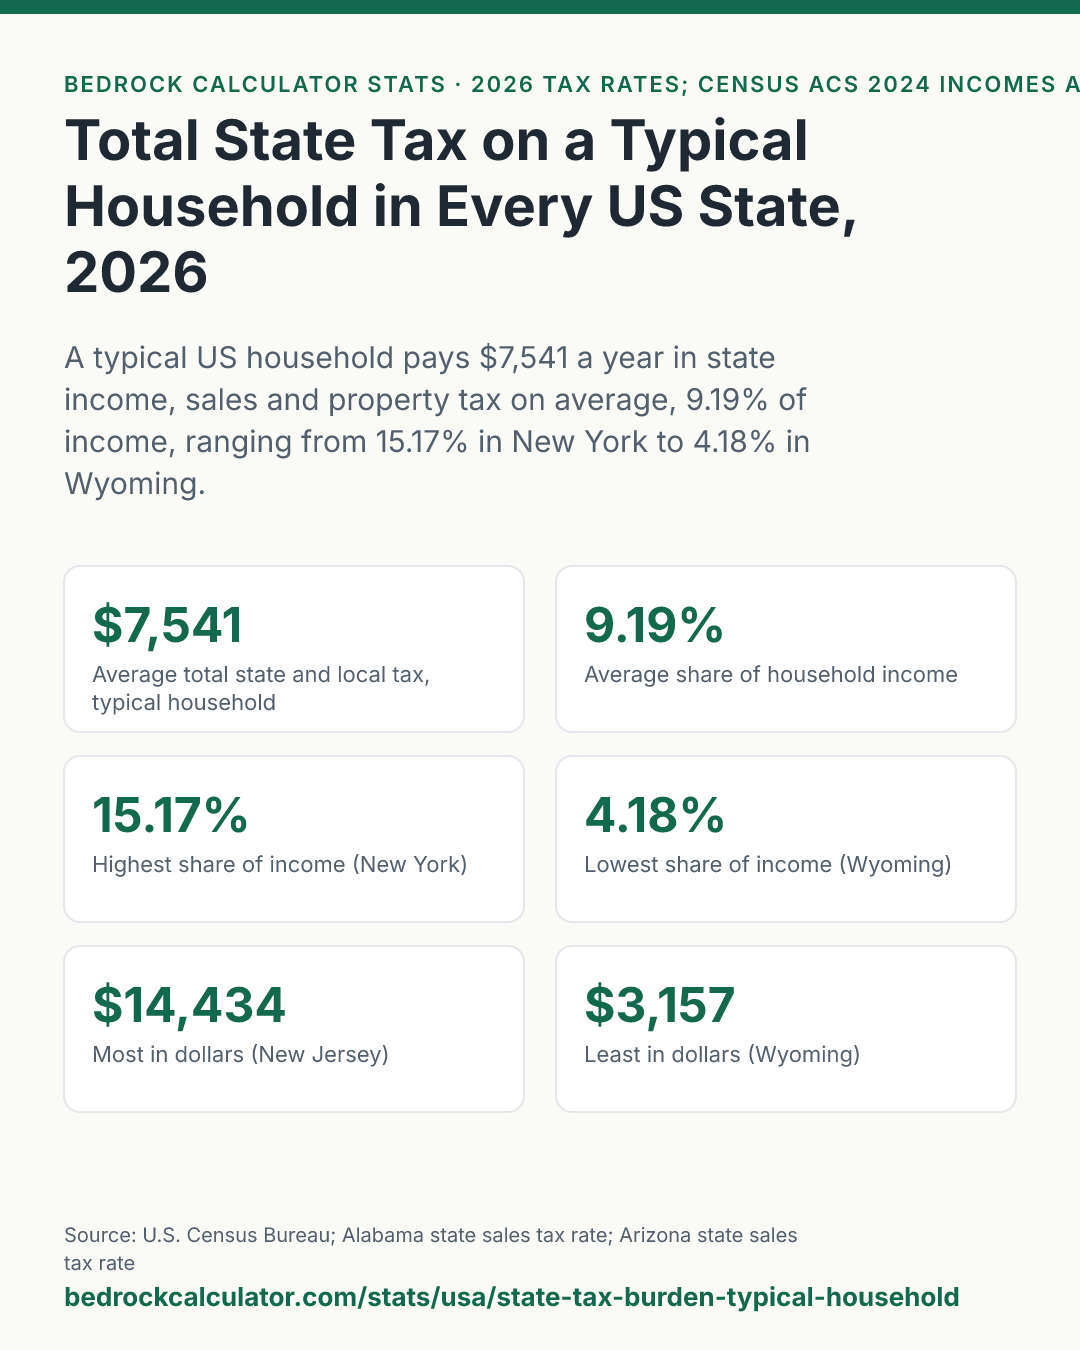
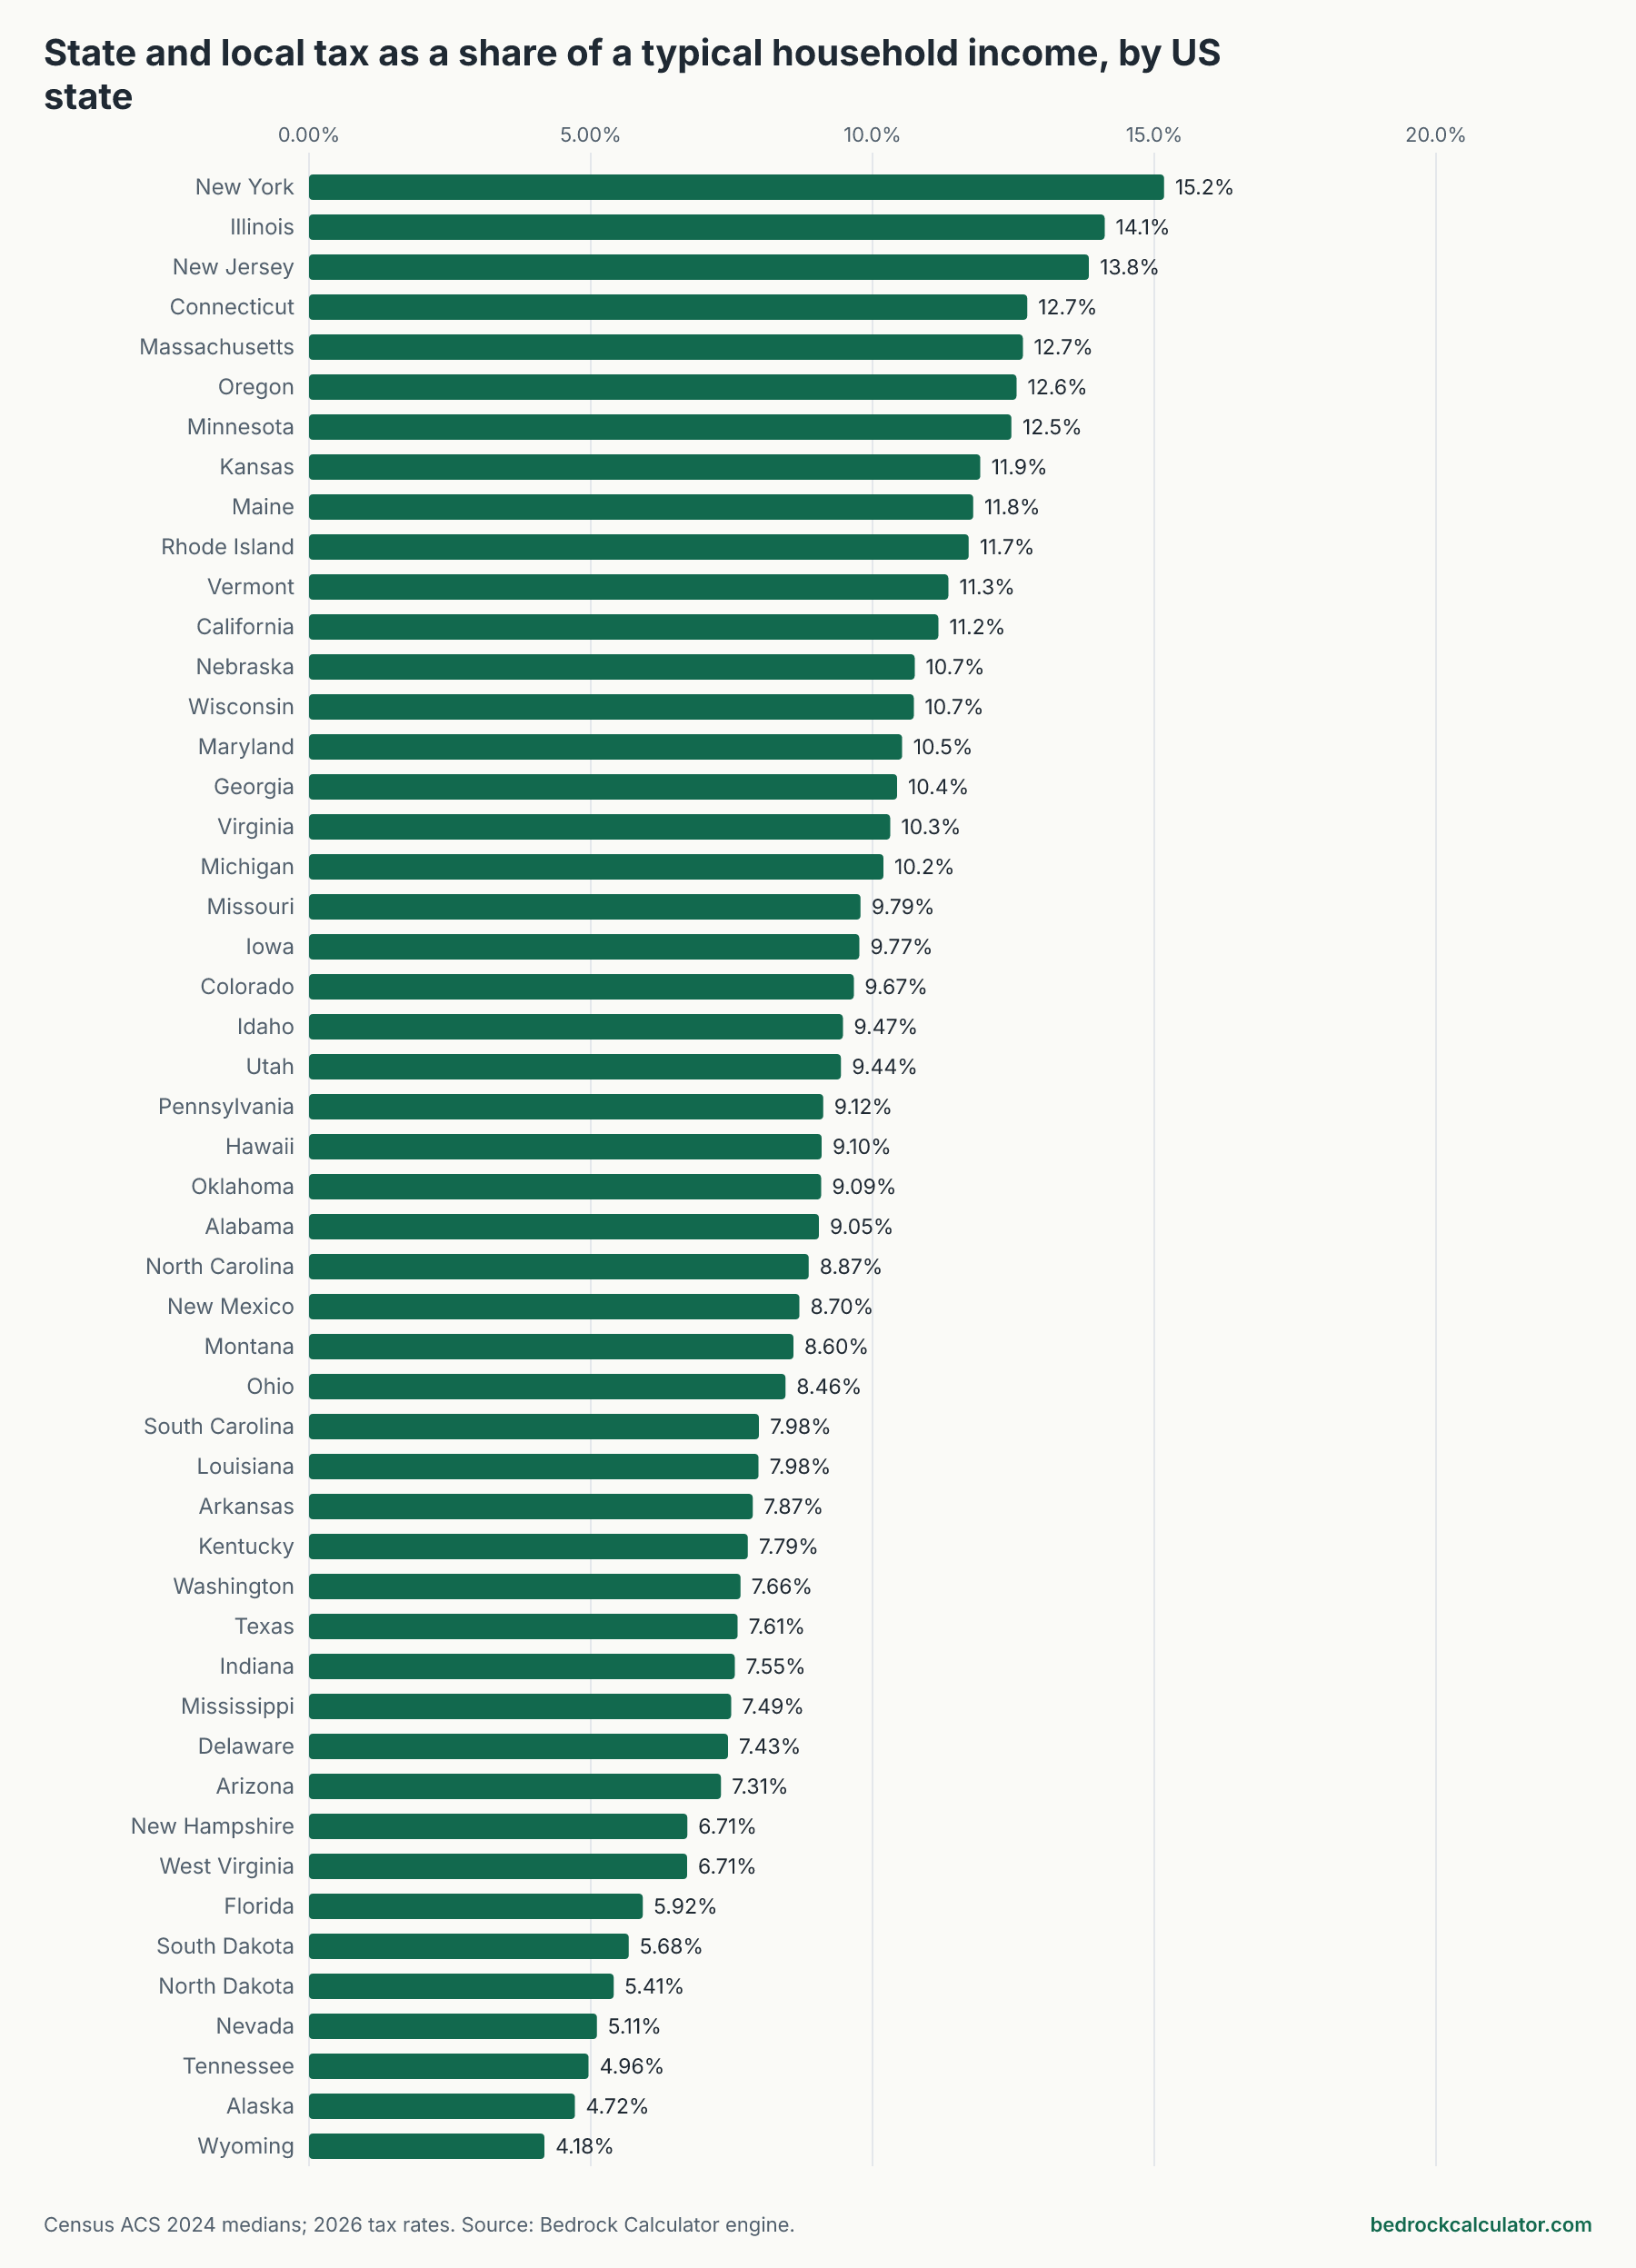
A typical US household pays $7,541 a year on average in state income tax, sales tax and property tax, or 9.19% of its income, when each state's own median income and median home value are run through 2026 tax rates. New York takes the largest share, 15.17% of a typical household's income. Wyoming takes the smallest, 4.18%.
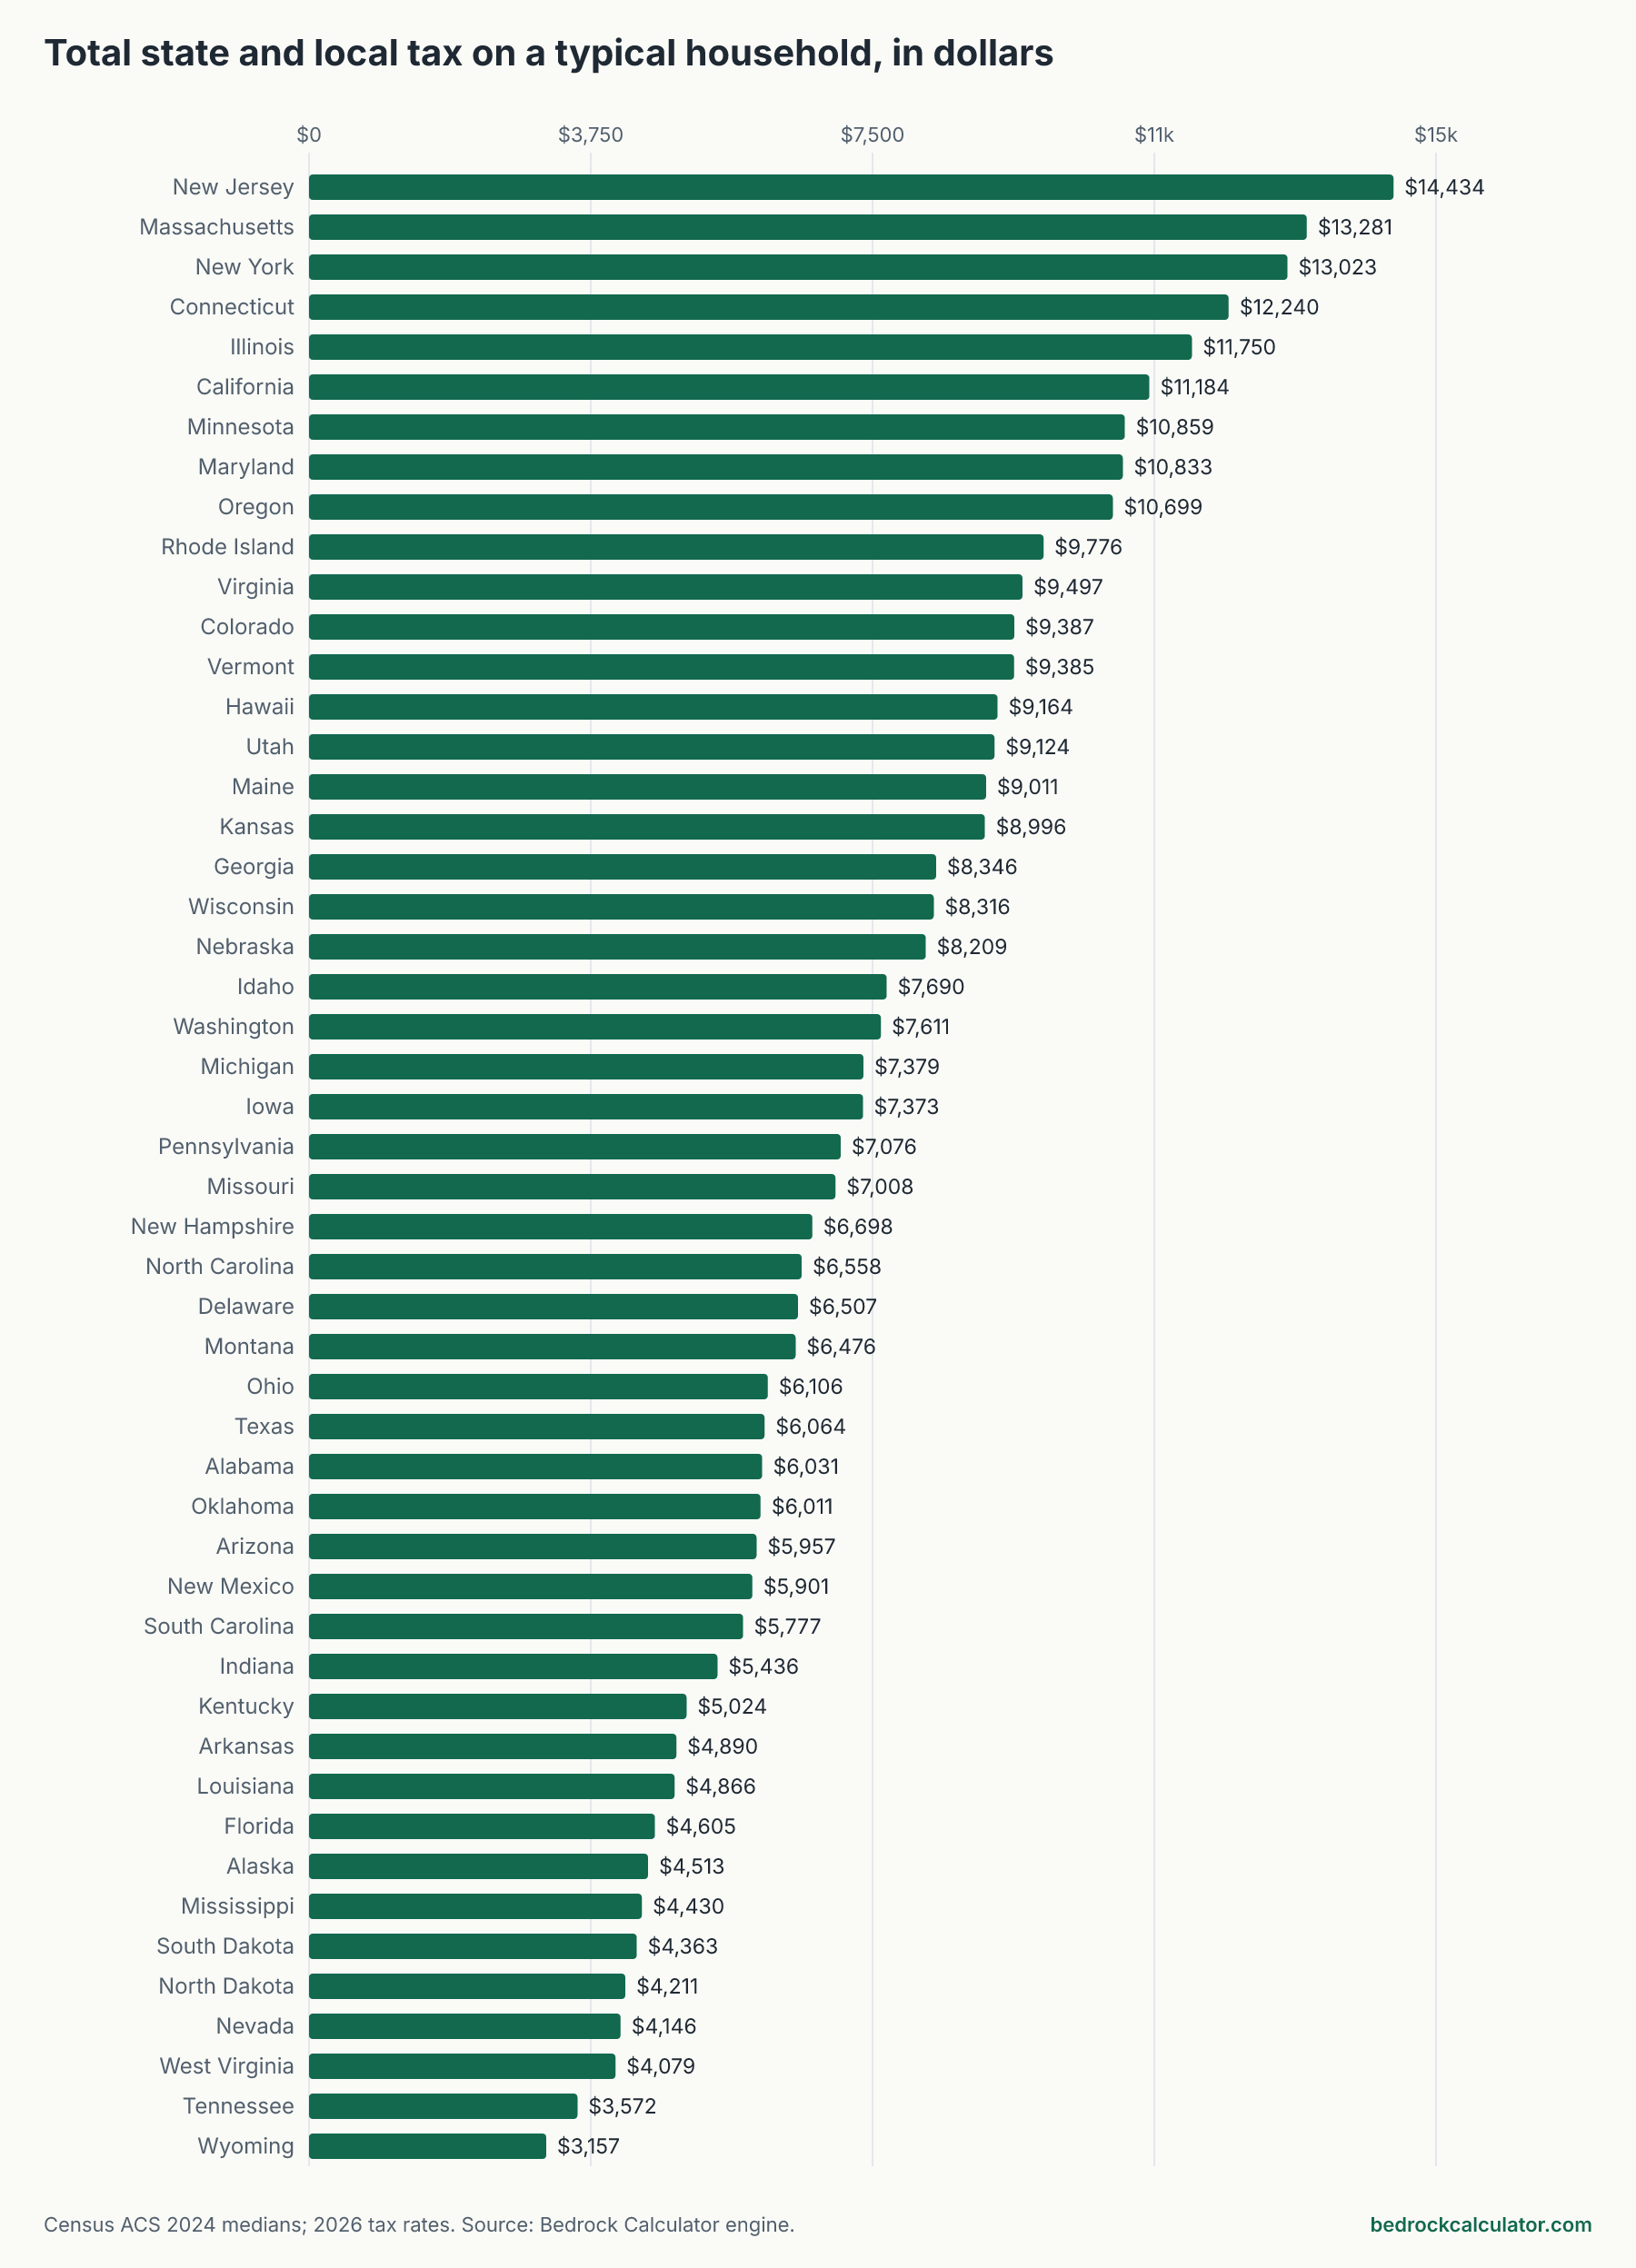
In plain dollars, New Jersey charges its typical household the most, $14,434, and Wyoming the least, $3,157.
What "typical household" means here
Most state tax comparisons use one made-up salary everywhere. That's useful for comparing tax rates, but it ignores the fact that a typical household in Massachusetts earns far more and owns a far pricier house than one in Mississippi. This page does the opposite: each state's household is that state's own typical household.
For income and home value we used the Census Bureau's American Community Survey, 2024 one-year estimates, the most recent release when we pulled the data:
- Median household income (table B19013), for example $100,149 in California and $79,721 in Texas. The national figure is $81,604.
- Median value of owner-occupied homes (table B25077), for example $759,500 in California and $313,200 in Texas. The national figure is $360,600.
Those incomes are in 2024 dollars. We apply 2026 tax rates to them, so the dollar totals run a little low if incomes have grown since. The comparison between states is what to focus on.
How we worked out each state's tax bill
We built each state's bill from three pieces, each from the same engine the site's calculators use.
- State income tax: we treat the household as a married couple filing jointly, with the whole median income as wages. The tax comes from the same state income tax schedules the paycheck calculator uses, with each state's joint brackets applied where the state has a separate joint schedule. No state standard deduction, exemption or credit is subtracted.
- Sales tax: we assume the household spends 30% of its income on things subject to sales tax. That share is our assumption, not a measured figure, and you can scale the sales tax column up or down if your spending differs. The tax is the state rate plus the state's average local rate, as in the sales tax calculator.
- Property tax: the household owns a home worth the state median, taxed at the state's average effective rate with no homestead exemption, as in the property tax calculator.
What's not in these figures:
- Deductions and credits. Leaving out state deductions overstates income tax, most in states with large standard deductions or credits for lower incomes.
- Renters. We treat every household as a homeowner. Renters don't pay property tax directly, though some of it reaches them through rent.
- Grocery and other exemptions. The sales tax applies one general rate to all taxable spending, so states that exempt groceries look a little more expensive than they are.
- Local income taxes, car taxes, fuel taxes and fees. None are included.
- Households that differ from the median. A single person, a retiree or a family with two high earners will have a different bill. The median income and the median home value don't necessarily belong to the same household.
Every US state, ranked
Click a heading to sort. The default order is by share of income.
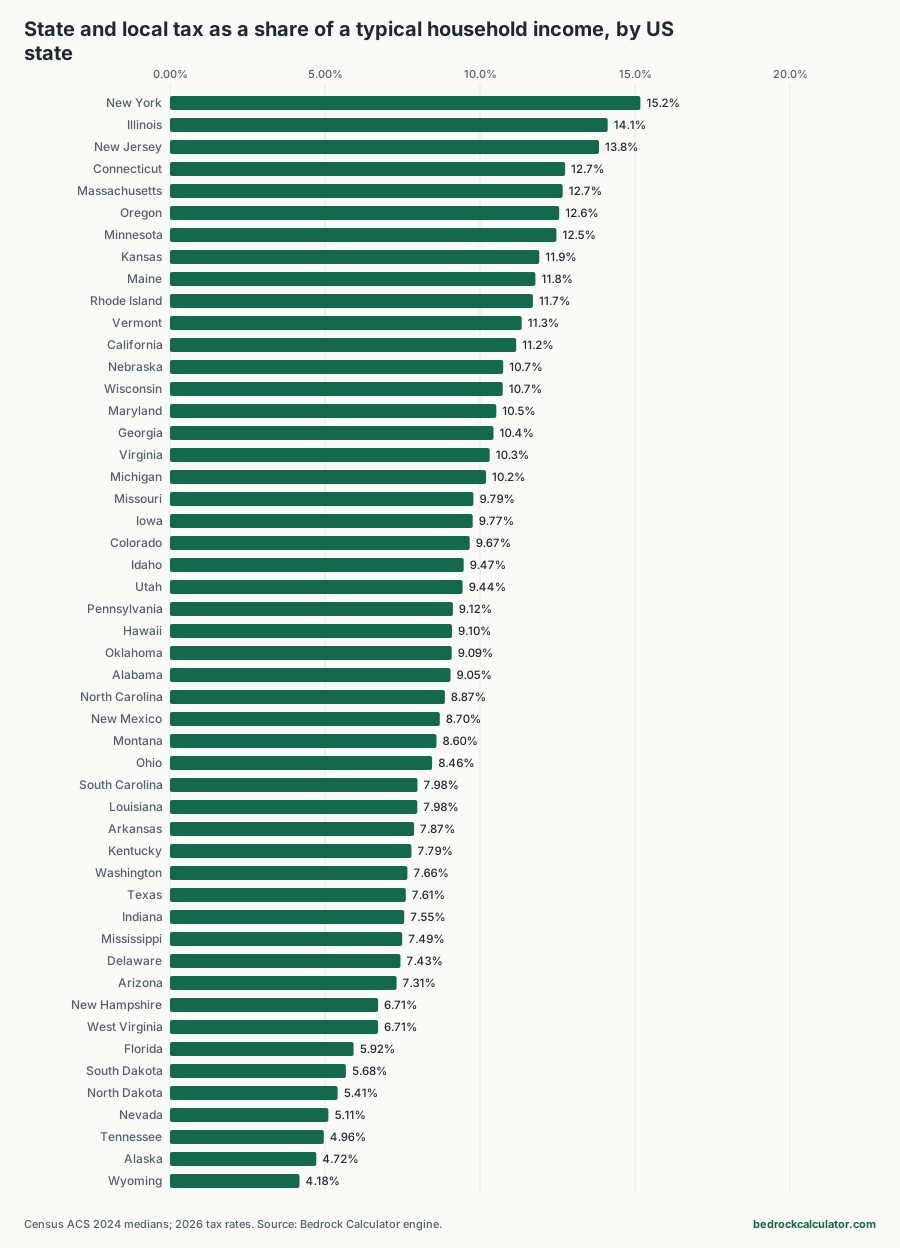
State and local tax on a typical household, by US state
Download CSVMedian household income and median home value from Census ACS 2024 1-year. Married couple filing jointly, 30% of income spent on taxable goods, home at the state median value. 2026 tax rates.
| New York | $85,820 | $449,800 | $4,302 | $2,199 | $6,522 | $13,023 | 15.17% |
| Illinois | $83,211 | $280,700 | $4,119 | $2,242 | $5,389 | $11,750 | 14.12% |
| New Jersey | $104,294 | $496,000 | $2,987 | $2,073 | $9,374 | $14,434 | 13.84% |
| Connecticut | $96,049 | $396,900 | $3,822 | $1,830 | $6,589 | $12,240 | 12.74% |
| Massachusetts | $104,828 | $607,400 | $5,241 | $1,966 | $6,074 | $13,281 | 12.67% |
| Oregon | $85,220 | $497,500 | $6,819 | $0 | $3,881 | $10,699 | 12.55% |
| Minnesota | $87,117 | $344,600 | $5,218 | $2,126 | $3,515 | $10,859 | 12.46% |
| Kansas | $75,514 | $238,700 | $4,039 | $1,973 | $2,984 | $8,996 | 11.91% |
| Maine | $76,442 | $341,900 | $4,639 | $1,261 | $3,111 | $9,011 | 11.79% |
| Rhode Island | $83,504 | $455,700 | $3,146 | $1,754 | $4,876 | $9,776 | 11.71% |
| Vermont | $82,730 | $352,800 | $2,779 | $1,596 | $5,010 | $9,385 | 11.34% |
| California | $100,149 | $759,500 | $3,079 | $2,713 | $5,392 | $11,184 | 11.17% |
| Nebraska | $76,376 | $263,100 | $2,873 | $1,599 | $3,736 | $8,209 | 10.75% |
| Wisconsin | $77,488 | $294,700 | $3,302 | $1,330 | $3,684 | $8,316 | 10.73% |
| Maryland | $102,905 | $436,300 | $4,835 | $1,852 | $4,145 | $10,833 | 10.53% |
| Georgia | $79,991 | $343,300 | $3,992 | $1,814 | $2,540 | $8,346 | 10.43% |
| Virginia | $92,090 | $403,500 | $5,038 | $1,594 | $2,865 | $9,497 | 10.31% |
| Michigan | $72,389 | $254,200 | $3,077 | $1,303 | $3,000 | $7,379 | 10.19% |
| Missouri | $71,589 | $254,400 | $3,184 | $1,814 | $2,010 | $7,008 | 9.79% |
| Iowa | $75,501 | $227,300 | $2,869 | $1,572 | $2,932 | $7,373 | 9.77% |
| Colorado | $97,113 | $574,600 | $4,273 | $2,299 | $2,816 | $9,387 | 9.67% |
| Idaho | $81,166 | $446,400 | $4,302 | $1,468 | $1,920 | $7,690 | 9.47% |
| Utah | $96,658 | $545,200 | $4,301 | $2,152 | $2,671 | $9,124 | 9.44% |
| Pennsylvania | $77,545 | $277,600 | $2,381 | $1,475 | $3,220 | $7,076 | 9.12% |
| Hawaii | $100,745 | $875,900 | $5,439 | $1,360 | $2,365 | $9,164 | 9.10% |
| Oklahoma | $66,148 | $222,100 | $2,547 | $1,798 | $1,666 | $6,011 | 9.09% |
| Alabama | $66,659 | $233,300 | $3,253 | $1,892 | $887 | $6,031 | 9.05% |
| North Carolina | $73,958 | $333,000 | $2,951 | $1,575 | $2,031 | $6,558 | 8.87% |
| New Mexico | $67,816 | $279,900 | $2,576 | $1,561 | $1,763 | $5,901 | 8.70% |
| Montana | $75,340 | $425,400 | $3,541 | $0 | $2,935 | $6,476 | 8.60% |
| Ohio | $72,212 | $239,800 | $1,601 | $1,579 | $2,926 | $6,106 | 8.46% |
| South Carolina | $72,350 | $299,500 | $2,803 | $1,626 | $1,348 | $5,777 | 7.98% |
| Louisiana | $60,986 | $223,200 | $1,830 | $1,853 | $1,183 | $4,866 | 7.98% |
| Arkansas | $62,106 | $215,600 | $2,002 | $1,766 | $1,121 | $4,890 | 7.87% |
| Kentucky | $64,526 | $226,000 | $2,258 | $1,161 | $1,605 | $5,024 | 7.79% |
| Washington | $99,389 | $602,200 | $0 | $2,853 | $4,757 | $7,611 | 7.66% |
| Texas | $79,721 | $313,200 | $0 | $1,961 | $4,103 | $6,064 | 7.61% |
| Indiana | $71,959 | $243,500 | $2,123 | $1,511 | $1,802 | $5,436 | 7.55% |
| Mississippi | $59,127 | $186,500 | $1,965 | $1,252 | $1,212 | $4,430 | 7.49% |
| Delaware | $87,534 | $371,600 | $4,761 | $0 | $1,747 | $6,507 | 7.43% |
| Arizona | $81,486 | $426,000 | $2,037 | $2,088 | $1,832 | $5,957 | 7.31% |
| New Hampshire | $99,782 | $458,800 | $0 | $0 | $6,698 | $6,698 | 6.71% |
| West Virginia | $60,798 | $170,800 | $1,987 | $1,204 | $888 | $4,079 | 6.71% |
| Florida | $77,735 | $396,900 | $0 | $1,628 | $2,977 | $4,605 | 5.92% |
| South Dakota | $76,881 | $289,600 | $0 | $1,409 | $2,954 | $4,363 | 5.68% |
| North Dakota | $77,871 | $266,100 | $0 | $1,656 | $2,555 | $4,211 | 5.41% |
| Nevada | $81,134 | $455,500 | $0 | $2,006 | $2,141 | $4,146 | 5.11% |
| Tennessee | $71,997 | $332,600 | $0 | $2,076 | $1,497 | $3,572 | 4.96% |
| Alaska | $95,665 | $376,500 | $0 | $522 | $3,991 | $4,513 | 4.72% |
| Wyoming | $75,532 | $339,500 | $0 | $1,221 | $1,935 | $3,157 | 4.18% |
Why New York and New Jersey top the list
New York's typical household pays $4,302 in state income tax, $2,199 in sales tax and $6,522 in property tax, $13,023 in all. Every piece is on the high side, and property tax is the biggest of the three.
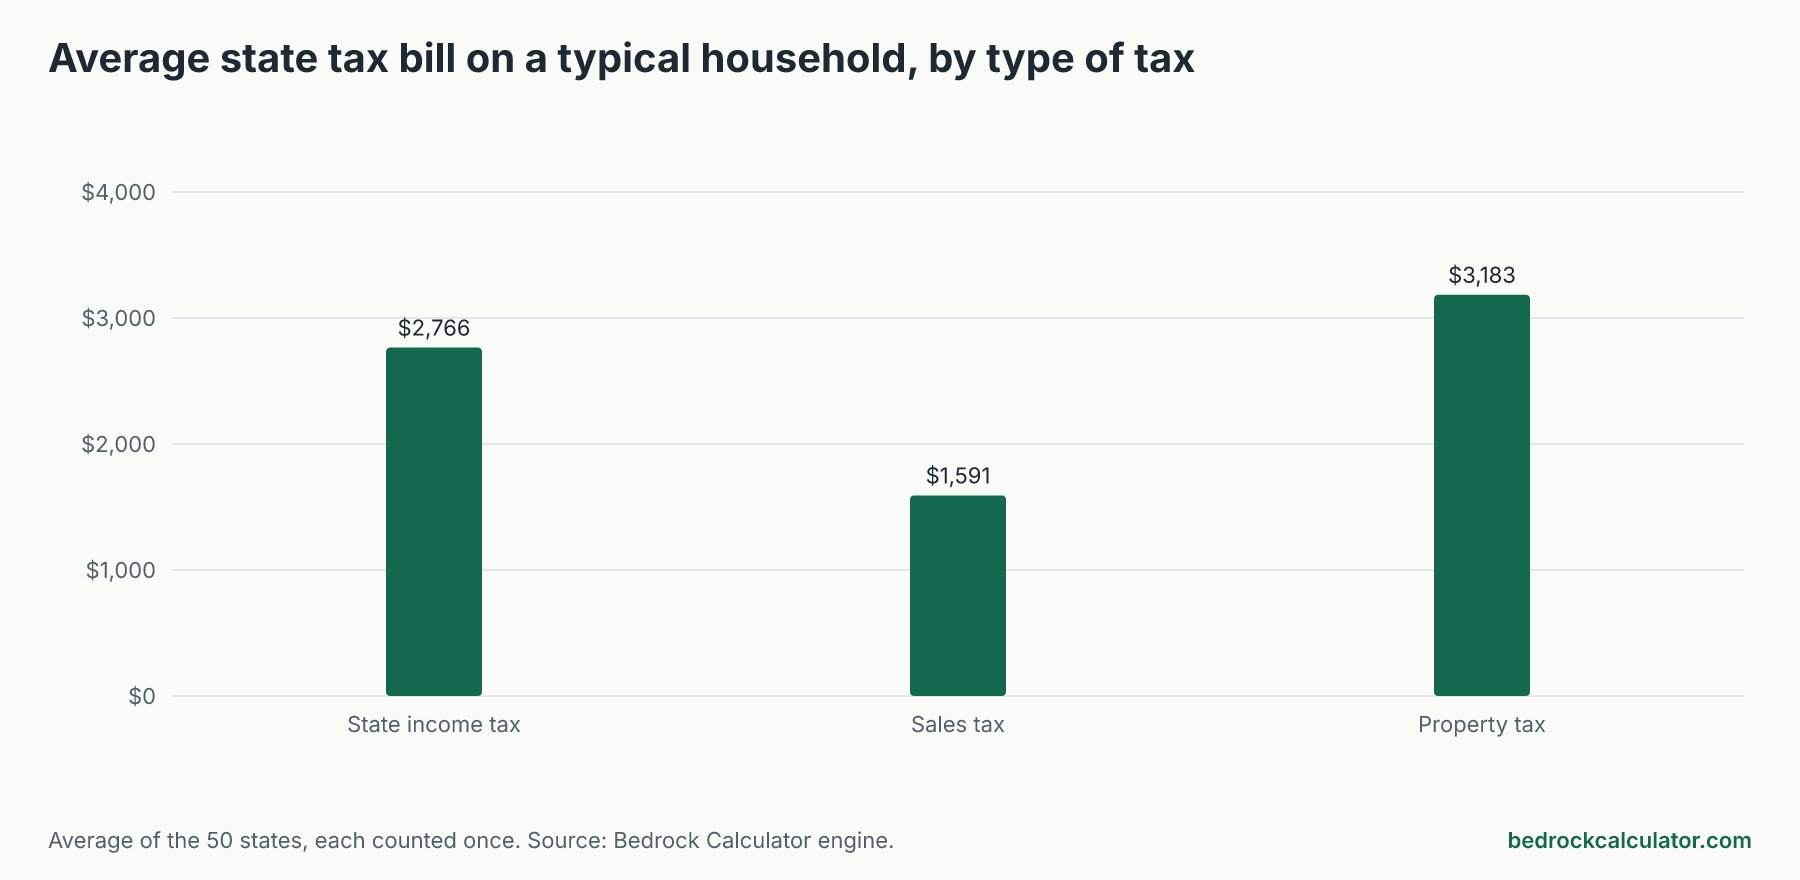
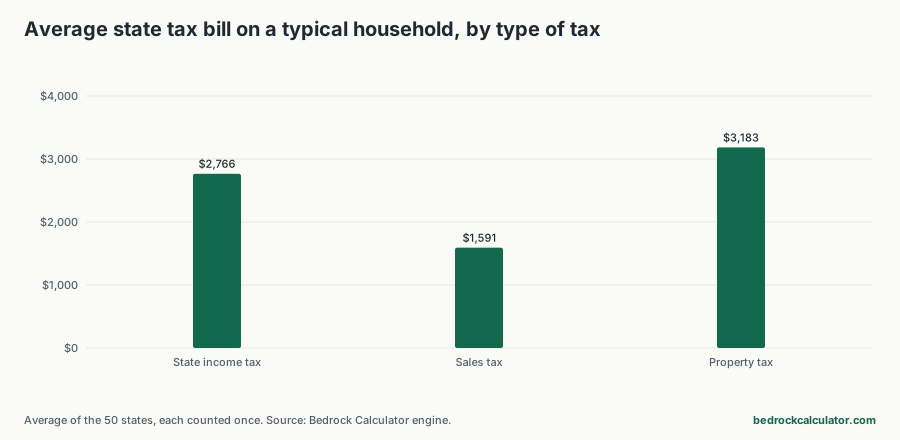
Property tax often leads elsewhere too. It's the single largest piece of the bill in 22 of the 50 states, and it averages $3,183 a year, against $2,766 for state income tax and $1,591 for sales tax.
In dollars the ranking shifts toward wealthier states, because higher incomes and pricier homes mean bigger bills even at modest rates.
California vs Texas for a typical household
California's typical household pays $11,184 a year, 11.17% of its $100,149 income. Its property tax rate is low, but on a median home of $759,500 the bill still comes to $5,392.
Texas's typical household pays $6,064, 7.61% of income. With no income tax, the biggest piece by far is property tax, $4,103 on a $313,200 home.
No income tax doesn't always mean low taxes
The 9 states without a wage tax generally land near the bottom of the share ranking, but not all of them. Washington still takes 7.66% of a typical household's income through sales and property tax, more than 6 of the 41 states that do tax wages.
It also works the other way. In North Dakota, the typical couple's income falls inside the zero-rate band of the state's joint schedule, so it owes no state income tax here even though the state has one.
Getting closer to your own number
Use this page to see where a state sits relative to the others, then put in your own figures. The paycheck calculator gives your state income tax on your actual salary, the sales tax calculator handles your spending, and state pages like the California property tax calculator or Texas property tax calculator let you add an exemption you already claim. For a fixed-salary comparison across states, see what no-income-tax states charge instead.