How much of your salary do you keep in each US state?
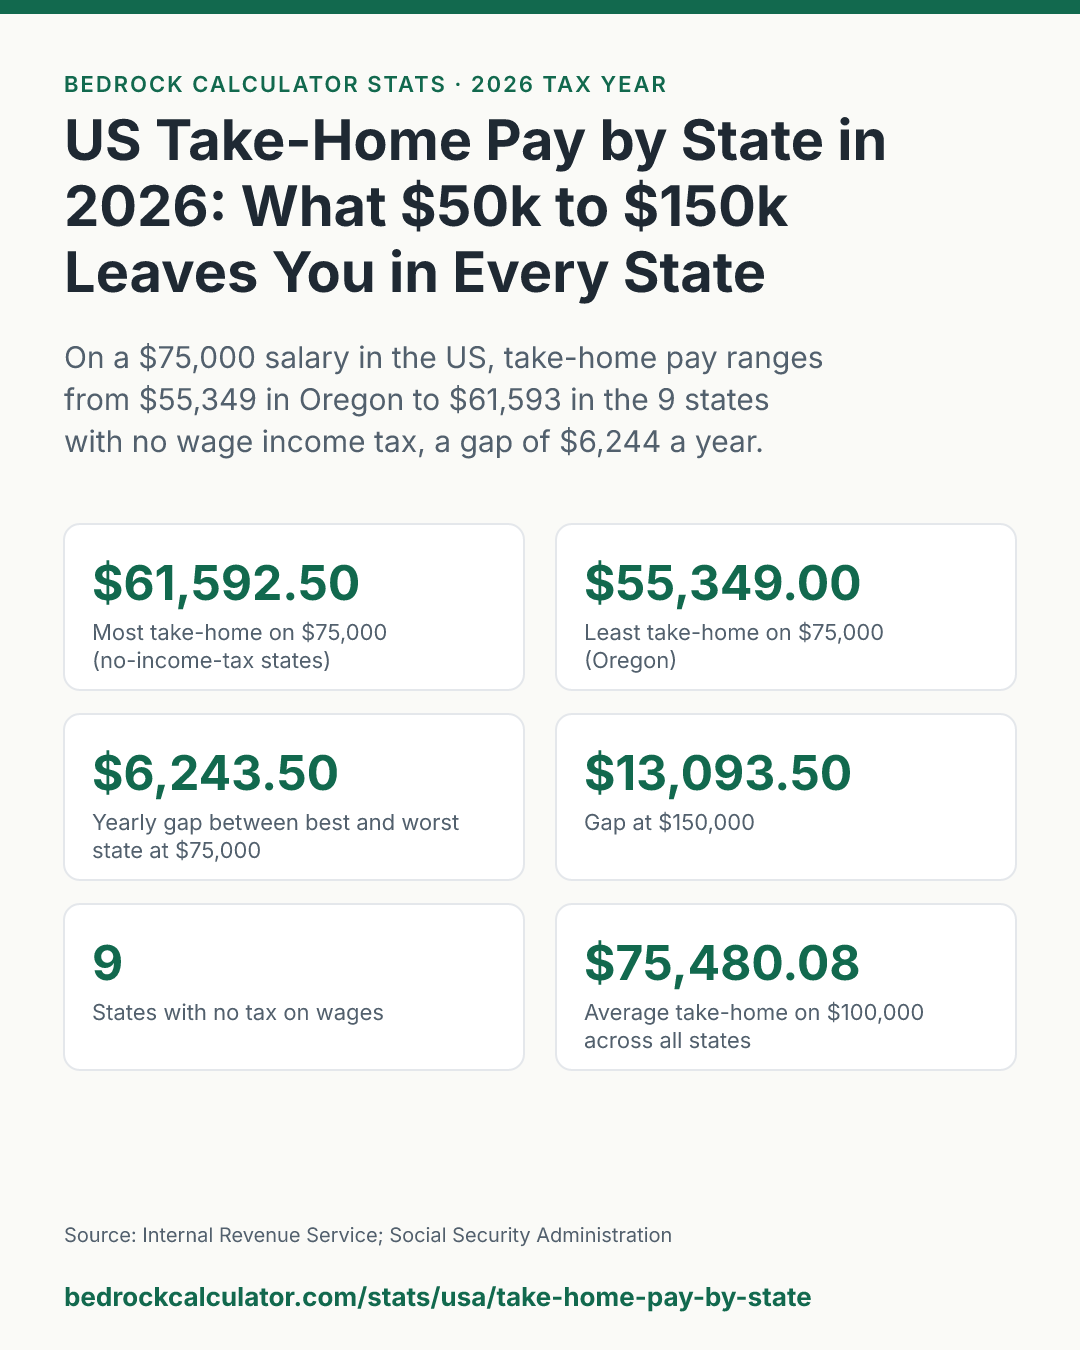
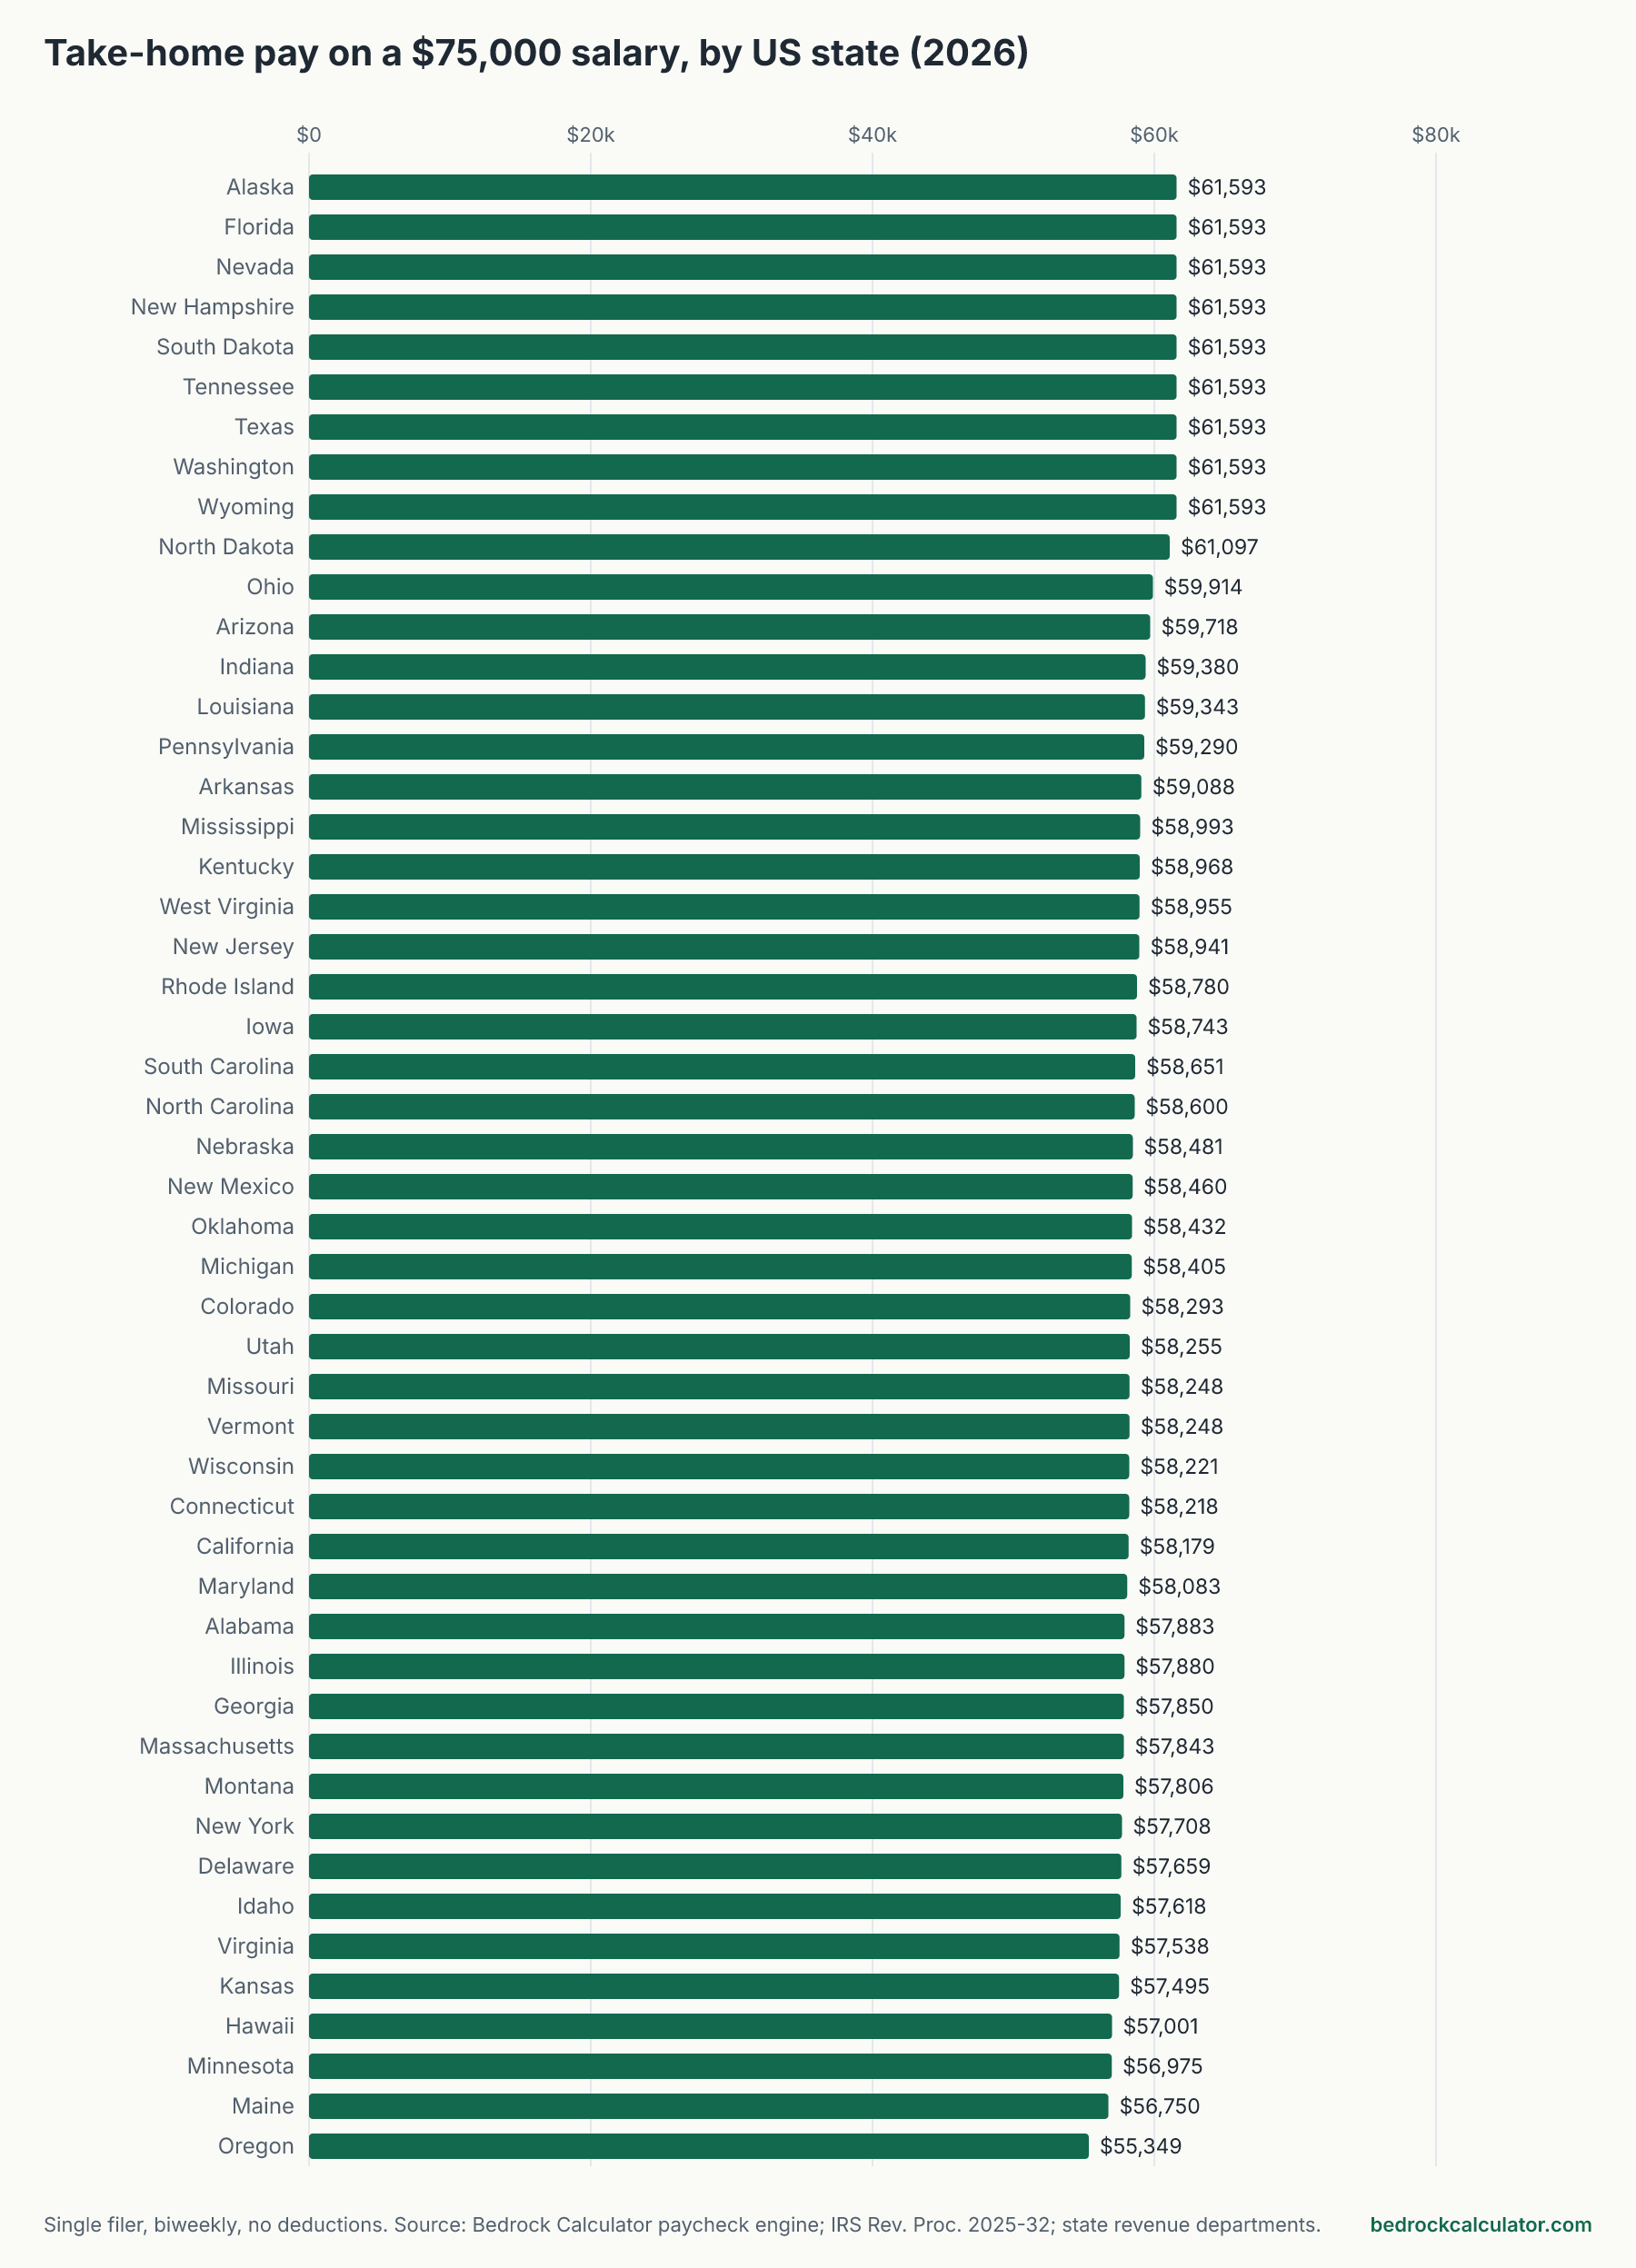
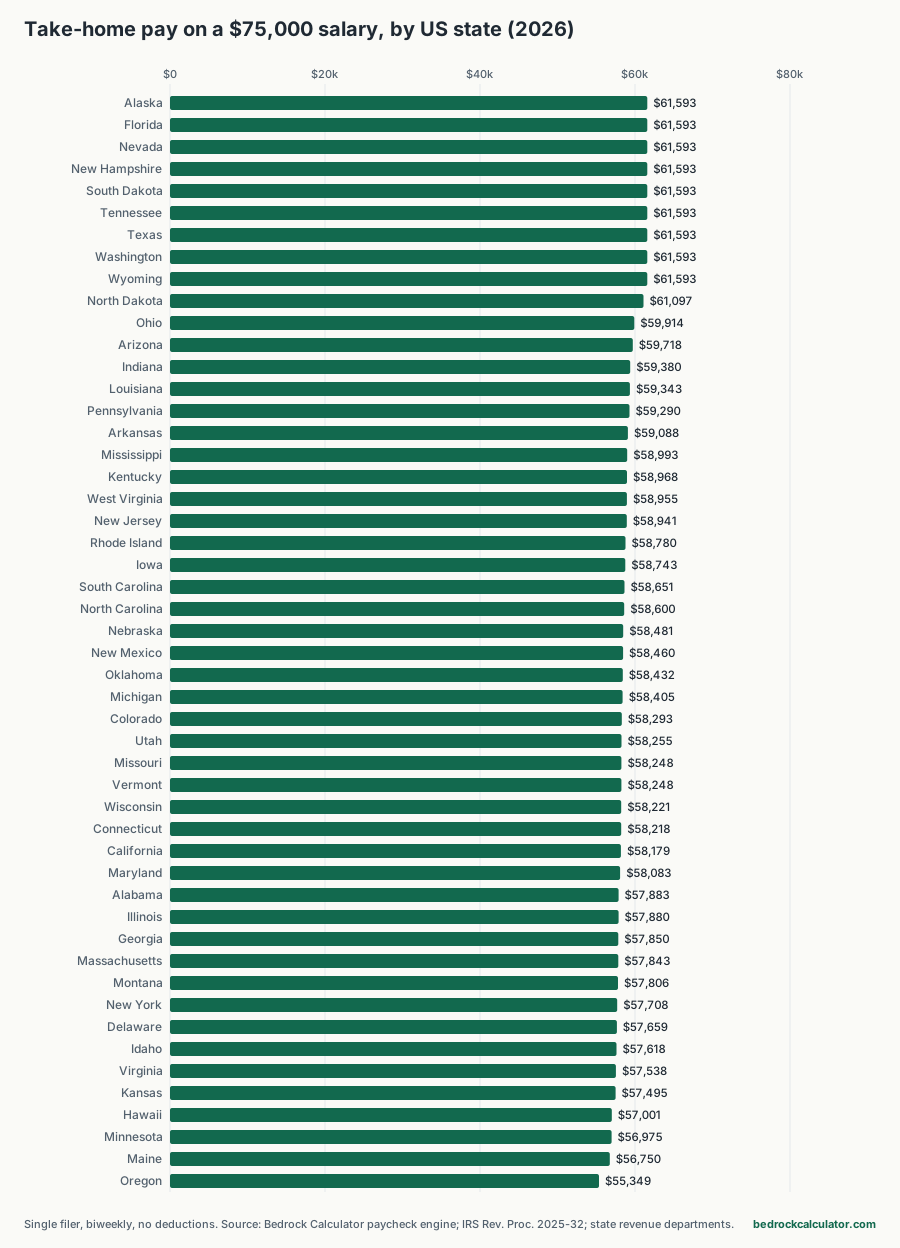
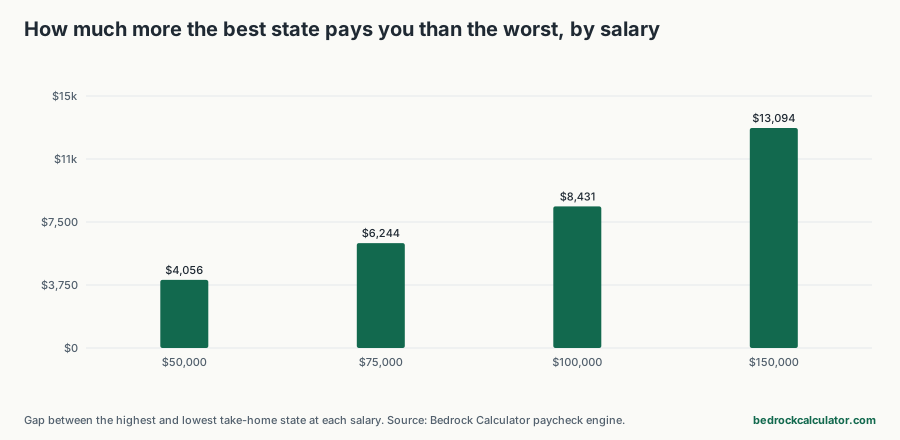
Same job, same salary, different US state, different paycheck. On $75,000 a year, a single filer in one of the 9 states that don't tax wages keeps $61,592.50. In Oregon, the state at the bottom of the list, the same person keeps $55,349.00. That's $6,243.50 a year, or about $240.13 every two weeks.
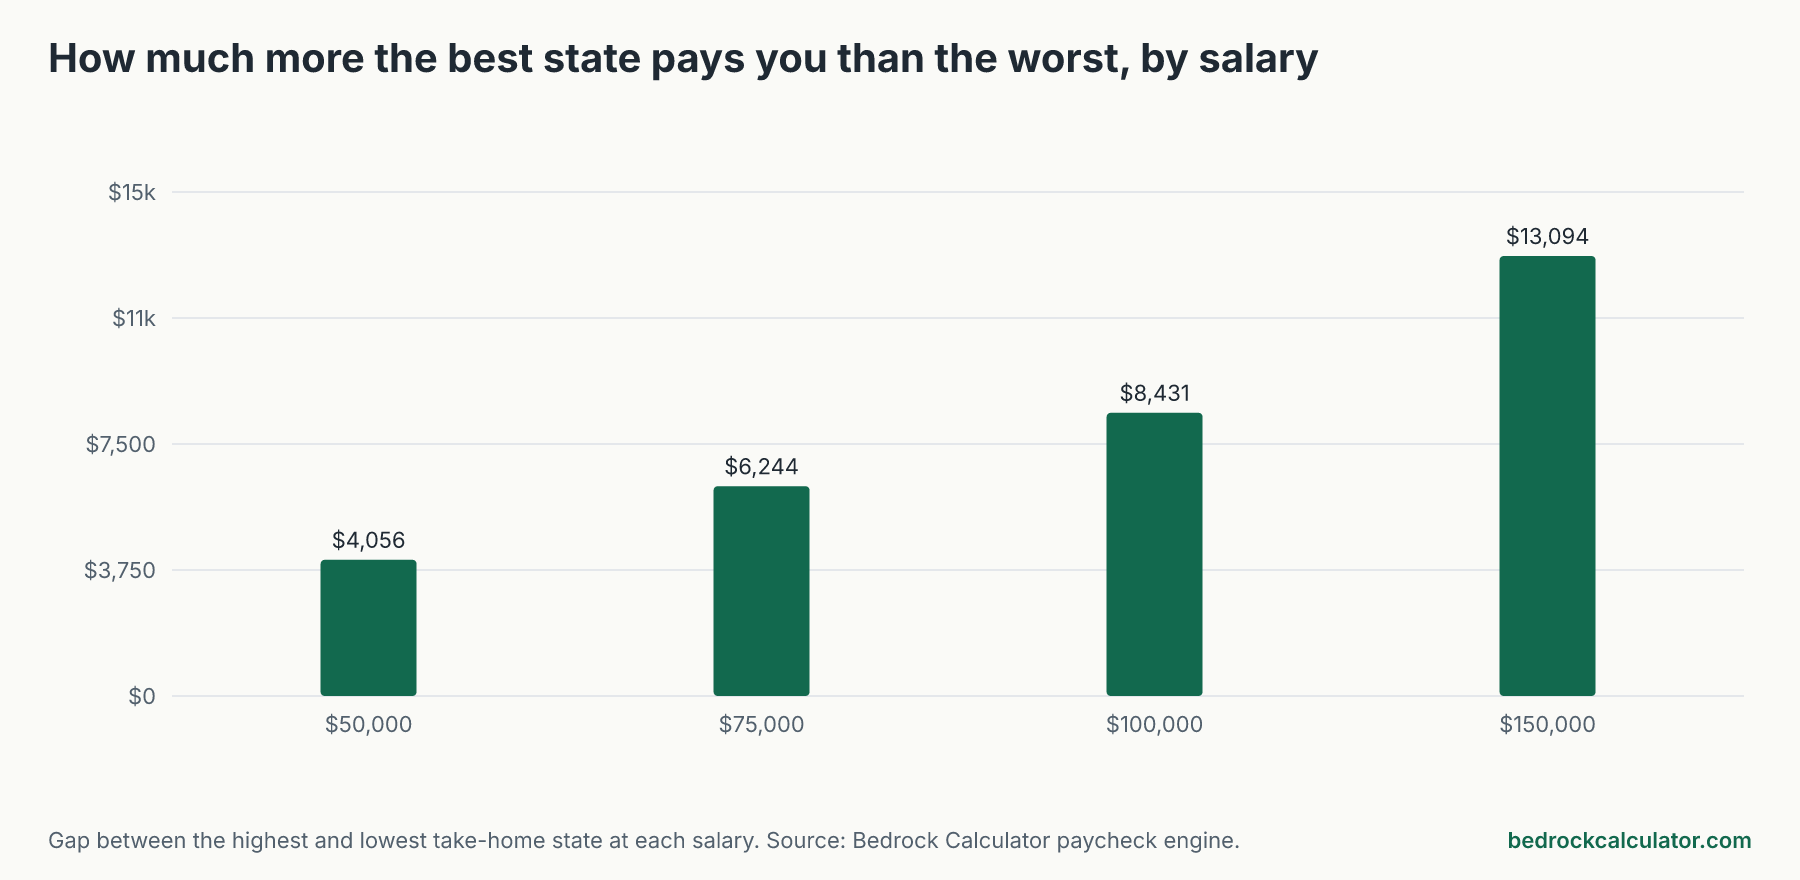
The gap gets wider as pay goes up. It's $4,056.00 at $50,000 and $13,093.50 at $150,000, because most state income taxes take a bigger share from higher earners.
How we worked out these numbers
We didn't pull these figures from a survey or estimate them. We ran the paycheck calculator on this site once for every US state at four salaries, $50,000, $75,000, $100,000 and $150,000, and recorded what it returned.
Every run uses the same setup so the only thing that changes is the state:
- Single filer, paid every two weeks
- Salary only, no bonus or overtime
- No 401(k), HSA or other deductions before or after tax
- 2026 federal brackets and standard deduction, 2026 Social Security wage base, and each state's own income tax schedule
What's left out matters too. The calculator applies each state's rate schedule to wages without state-specific deductions, credits or local taxes. If you live in a city with its own income tax, like New York City or Philadelphia, your real take-home will be lower than the figure here. Each state's own paycheck calculator explains what it leaves out for that state.
Every US state, side by side
Click any column heading to sort. The first column of numbers is what a $50,000 salary leaves you after federal income tax, Social Security, Medicare and state income tax.
Annual take-home pay by US state, 2026 (single filer)
Download CSVSalary paid biweekly, no pre-tax or post-tax deductions. Federal income tax, Social Security, Medicare and state income tax only.
| Alaska | $42,355.00 | $61,592.50 | $79,180.00 | $113,791.00 | $0.00 |
| Florida | $42,355.00 | $61,592.50 | $79,180.00 | $113,791.00 | $0.00 |
| Nevada | $42,355.00 | $61,592.50 | $79,180.00 | $113,791.00 | $0.00 |
| New Hampshire | $42,355.00 | $61,592.50 | $79,180.00 | $113,791.00 | $0.00 |
| South Dakota | $42,355.00 | $61,592.50 | $79,180.00 | $113,791.00 | $0.00 |
| Tennessee | $42,355.00 | $61,592.50 | $79,180.00 | $113,791.00 | $0.00 |
| Texas | $42,355.00 | $61,592.50 | $79,180.00 | $113,791.00 | $0.00 |
| Washington | $42,355.00 | $61,592.50 | $79,180.00 | $113,791.00 | $0.00 |
| Wyoming | $42,355.00 | $61,592.50 | $79,180.00 | $113,791.00 | $0.00 |
| North Dakota | $42,346.71 | $61,096.71 | $78,196.71 | $111,832.71 | $495.79 |
| Ohio | $41,364.37 | $59,914.37 | $76,814.37 | $110,050.37 | $1,678.13 |
| Arizona | $41,105.00 | $59,717.50 | $76,680.00 | $110,041.00 | $1,875.00 |
| Indiana | $40,880.00 | $59,380.00 | $76,230.00 | $109,366.00 | $2,212.50 |
| Louisiana | $40,855.00 | $59,342.50 | $76,180.00 | $109,291.00 | $2,250.00 |
| Pennsylvania | $40,820.00 | $59,290.00 | $76,110.00 | $109,186.00 | $2,302.50 |
| Arkansas | $40,825.00 | $59,087.50 | $75,700.00 | $108,361.00 | $2,505.00 |
| Mississippi | $40,755.00 | $58,992.50 | $75,580.00 | $108,191.00 | $2,600.00 |
| Kentucky | $40,605.00 | $58,967.50 | $75,680.00 | $108,541.00 | $2,625.00 |
| West Virginia | $40,826.50 | $58,955.00 | $75,397.50 | $107,718.50 | $2,637.50 |
| New Jersey | $41,085.00 | $58,941.25 | $74,936.25 | $106,362.25 | $2,651.25 |
| Rhode Island | $40,480.00 | $58,780.00 | $75,250.50 | $107,486.50 | $2,812.50 |
| Iowa | $40,455.00 | $58,742.50 | $75,380.00 | $108,091.00 | $2,850.00 |
| South Carolina | $40,716.00 | $58,651.00 | $74,936.00 | $106,942.00 | $2,941.50 |
| North Carolina | $40,360.00 | $58,600.00 | $75,190.00 | $107,806.00 | $2,992.50 |
| Nebraska | $40,380.87 | $58,480.87 | $74,930.87 | $107,266.87 | $3,111.63 |
| New Mexico | $40,414.00 | $58,459.50 | $74,822.00 | $106,983.00 | $3,133.00 |
| Oklahoma | $40,319.75 | $58,432.25 | $74,894.75 | $107,255.75 | $3,160.25 |
| Michigan | $40,230.00 | $58,405.00 | $74,930.00 | $107,416.00 | $3,187.50 |
| Colorado | $40,155.00 | $58,292.50 | $74,780.00 | $107,191.00 | $3,300.00 |
| Utah | $40,130.00 | $58,255.00 | $74,730.00 | $107,116.00 | $3,337.50 |
| Missouri | $40,185.63 | $58,248.13 | $74,660.63 | $106,921.63 | $3,344.37 |
| Vermont | $40,660.50 | $58,248.00 | $74,185.50 | $105,193.50 | $3,344.50 |
| Wisconsin | $40,290.99 | $58,221.04 | $74,483.54 | $106,444.54 | $3,371.46 |
| Connecticut | $40,355.00 | $58,217.50 | $74,430.00 | $106,041.00 | $3,375.00 |
| California | $40,820.11 | $58,178.86 | $73,441.36 | $103,402.36 | $3,413.64 |
| Maryland | $40,032.50 | $58,082.50 | $74,482.50 | $106,531.00 | $3,510.00 |
| Alabama | $39,895.00 | $57,882.50 | $74,220.00 | $106,331.00 | $3,710.00 |
| Illinois | $39,880.00 | $57,880.00 | $74,230.00 | $106,366.00 | $3,712.50 |
| Georgia | $39,860.00 | $57,850.00 | $74,190.00 | $106,306.00 | $3,742.50 |
| Massachusetts | $39,855.00 | $57,842.50 | $74,180.00 | $106,291.00 | $3,750.00 |
| Montana | $39,981.25 | $57,806.25 | $73,981.25 | $105,767.25 | $3,786.25 |
| New York | $39,820.00 | $57,707.50 | $73,848.25 | $105,509.25 | $3,885.00 |
| Delaware | $39,966.50 | $57,659.00 | $73,596.50 | $104,907.50 | $3,933.50 |
| Idaho | $39,705.00 | $57,617.50 | $73,880.00 | $105,841.00 | $3,975.00 |
| Virginia | $39,737.50 | $57,537.50 | $73,687.50 | $105,423.50 | $4,055.00 |
| Kansas | $39,652.40 | $57,494.90 | $73,687.40 | $105,508.40 | $4,097.60 |
| Hawaii | $39,663.80 | $57,001.30 | $72,688.80 | $103,424.80 | $4,591.20 |
| Minnesota | $39,437.99 | $56,975.49 | $72,862.99 | $103,648.01 | $4,617.01 |
| Maine | $39,240.30 | $56,749.70 | $72,549.70 | $103,585.70 | $4,842.80 |
| Oregon | $38,299.00 | $55,349.00 | $70,749.00 | $100,697.50 | $6,243.50 |
The 9 states that don't tax your paycheck
Alaska, Florida, Nevada, New Hampshire, South Dakota, Tennessee, Texas, Washington, Wyoming don't take anything from wages. That's why they tie at the top of every column. On $75,000 the only deductions there are federal income tax and FICA, so everyone in those states keeps the same $61,592.50.
That doesn't make them cheap places to live. Several of them lean harder on sales tax or property tax instead, and housing costs vary a lot. If you're weighing a move, look at the cost of living calculator and the property tax page for the state as well.
Why the gap grows with your salary
Most states with an income tax use brackets, so each extra dollar is taxed at a rising rate. A few use one flat rate. Either way, the state's cut is bigger in dollars on a bigger salary, so the distance between a no-tax state and the most expensive state grows from $4,056.00 at $50,000 to $8,431.00 at $100,000 and $13,093.50 at $150,000.
At $150,000, Oregon leaves a single filer $100,697.50, against $113,791.00 in a state with no wage tax.
What the average looks like
If you average all 50 US states together, a single filer keeps about $40,672.83 of a $50,000 salary, $58,913.30 of $75,000, $75,480.08 of $100,000 and $108,015.10 of $150,000. Those averages count each state once, whatever its population, so treat them as a midpoint rather than what a typical American actually takes home.
Using these numbers for your own situation
Every figure here is for one person filing single. Couples asking what a joint return changes should read married take-home pay by state, which runs three household incomes on both a joint and a single return. These figures are a fair comparison between states, not a forecast of your exact paycheck. Your real number will move if you put money into a 401(k), have pre-tax health insurance, claim dependents, file jointly, or live somewhere with a local income tax.
To get your own figure, open the paycheck calculator, pick your state, and enter your salary and deductions. Each state also has its own page, such as the Texas paycheck calculator or the California paycheck calculator, with notes on the rules that are specific to that state.