Quick Answer: Arizona's cost of living is 7.2% above the U.S. national average (composite index 107.2), so a $75,000.00 national-average household budget costs about $80,400.00 a year in Arizona.
A 7.2% Premium That Is Almost Entirely Shelter
On MERIC's composite cost-of-living index Arizona registers 107.2, or 7.2% above the 100.0 national baseline, ranking 15th of 50 on cost.
The spread between the published sub-indices is what makes Arizona unusual for a state this close to parity. Groceries sit at 100.4 and utilities at 104.2, both within a few points of the national line. Housing sits at 121.3. Nearly the whole composite premium is shelter.
At the default $75,000 baseline the engine returns $80,400.00 and a differential of $5,400.00. That figure is produced by one multiplication against 107.2 and by nothing else. The calculator does not know your rent, and the housing figure of 121.3 plays no part in the headline number.
Key Index Components for Arizona:
- Composite Benchmark Index: 107.2 (Rank #15)
- Housing Cost Index: 121.3
- Utilities Cost Index: 104.2
- Grocery Cost Index: 100.4
How This Is Calculated
Arizona's composite of 107.2 is almost entirely a housing number. Groceries at 100.4 and utilities at 104.2 are within a few points of the national average, while housing sits at 121.3, more than 21 points above it. That single composite is what the calculator multiplies your budget by.
- Baseline budget. You enter annual household spending priced at the national benchmark, index 100.0.
- Composite lookup. Arizona's composite index of 107.2 is read from the 2026 MERIC state table, along with its rank of #15 among the 50 states.
- Single-factor scaling. The baseline is multiplied by 107.2 and divided by 100. That is the whole computation. The housing 121.3, groceries 100.4 and utilities 104.2 readings are separate index ratios reported alongside it; no code on this page apportions your budget across them or weights them into the composite.
- Differential. The dollar and percentage difference against the baseline are read off the scaled result. The percentage is 7.2% at every budget the tool accepts.
Worked Example
Using this calculator's baseline scenario: a household needing $75,000.00 a year to sustain a standard basket of goods, priced at the U.S. national average (composite index 100.0).
- National baseline. $75,000.00 is the reference spending level at the national-average price level (index 100.0).
- Apply Arizona's composite index. Arizona's composite index of 107.2 (rank #15 nationally) means local prices run 7.2% above the national basket. Scaling: $75,000.00 × (107.2 ÷ 100) = $80,400.00.
- Dollar differential. The engine returns +$5,400.00, the amount by which the budget has to grow to hold the same basket.
- Percentage. That is +7.2%, and it does not vary with the size of the budget entered.
No Threshold Exists Here, and the Sweep Proves It
Most calculators on this site have an edge somewhere: a bracket boundary, an exemption cliff, a cap. This one has none. It is a single linear multiplication, and the honest thing to publish is the line itself:
| Baseline entered | Arizona adjusted | Differential |
|---|---|---|
| $10,000 | $10,720.00 | $720.00 |
| $50,000 | $53,600.00 | $3,600.00 |
| $75,000 | $80,400.00 | $5,400.00 |
| $100,000 | $107,200.00 | $7,200.00 |
| $120,000 | $128,640.00 | $8,640.00 |
| $200,000 | $214,400.00 | $14,400.00 |
Every row returns a composite of 107.2 and a differential of 7.2%. Nothing steps, kinks or phases out across a twenty-fold range of input.
The next thousand dollars. Entering $75,000 returns $80,400.00; entering $76,000 returns $81,472.00. That step is what each additional $1,000 of national baseline costs in Arizona, and it is identical everywhere on the sweep.
Reversing It: The Baseline Behind $75,000 of Phoenix Spending
The question people actually arrive with is the inverse: not "what does my budget become in Arizona" but "what national-average budget is $75,000 of Arizona spending equivalent to". Solving it by running the calculator down to the dollar:
- A baseline of $69,962 returns $74,999.26.
- A baseline of $69,963 returns $75,000.34.
So $75,000 of Arizona spending is roughly $69,963 of national-baseline spending. The forward direction, for comparison, is the one in the Quick Answer: $75,000 of national baseline needs $80,400.00 here.
The Symmetry Error, Priced
Because Arizona is 7.2% above the national average, the reflex is to reverse it by subtracting 7.2%: $75,000 minus 7.2% gives $69,600.
Feed $69,600 into the engine and it returns $74,611.20, short of the $75,000 target. Percentage differentials do not invert by subtraction. Arizona's margin is small enough that the error looks harmless, but it is a real shortfall in the budget you would be planning against, and the correct answer is the verified $69,963 pair above. In a state with a larger differential the same mistake compounds badly.
Reading the Multiplier Schedule Without Misreading It
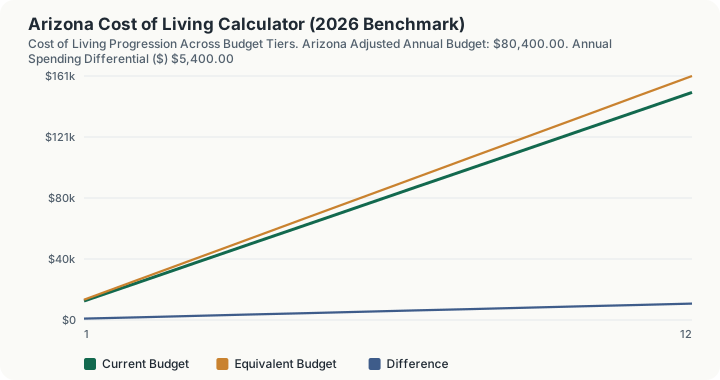
The 12-row table under the calculator holds the index fixed and moves only the budget, so it is a single series and adjacent rows are directly comparable.
Row i prices a budget tier of budget × i ÷ 6 and applies the composite 107.2 to it, every time. At the default $75,000 baseline the tiers step $12,500.00 apart: row 1 prices $12,500.00 and returns $13,400.00; row 3 prices $37,500.00 and returns $40,200.00; row 6 prices the entered $75,000.00 and returns $80,400.00, matching the headline exactly; row 12 prices $150,000.00 and returns $160,800.00. The column rises with every step and never reverses.
The third column follows the same proportion. It is 7.2% of that row's tier throughout, from $900.00 at row 1 to $5,400.00 at row 6 and $10,800.00 at row 12. Doubling the tier doubles both the equivalent budget and the differential, which is the practical statement that Arizona's premium is a flat percentage with no threshold anywhere in the range the sweep covers.
The three sub-indices Arizona publishes -- housing 121.3, groceries 100.4, utilities 104.2 -- are context for where the 107.2 came from. None of them is applied to a budget anywhere on this page, in the table or in the headline, and no row of the schedule is a category cost.
What This Does Not Account For
- A single statewide multiplier. Scottsdale, Flagstaff, Yuma and a rural Apache County address all get 107.2. There is no metro, county or ZIP input in this calculator.
- No category weighting. The engine never asks what fraction of your budget is rent. Someone paying market rent in Phoenix is exposed to 121.3 while the tool still returns the 107.2 result.
- No taxes. Arizona's flat state income tax, transaction privilege tax and county property rates are all outside this figure. Those live in separate calculators on this site.
- No time dimension. The 107.2 is a static table value. This config has no year input and is not tax-year sensitive, so nothing here inflates the index forward.
- No seasonal cooling load. Arizona's utilities index of 104.2 is an annual average. A Phoenix summer power bill is not modelled separately, and nothing on this page varies by month.
Common Pitfalls
- Applying the composite to a housing decision. The composite is 107.2; housing is 121.3. A renter's exposure is the second number and this tool returns the first.
- Subtracting the percentage to reverse it. $69,600 returns $74,611.20, not $75,000. The verified inverse is $69,963.
- Assuming the premium scales. It does not vary at all: 7.2% at $10,000 and 7.2% at $200,000.
- Treating a schedule row as a category budget. Row 2's $26,800.00 is a $25,000.00 tier priced at the composite. It is not an Arizona housing cost, and the 121.3 housing index never enters that column.
Frequently Asked Questions
Is Arizona expensive to live in?
What is the biggest cost factor in Arizona?
How much salary do I need to maintain my lifestyle in Arizona?
Does the percentage change for a larger household budget?
Sources
- U.S. Bureau of Economic Analysis (BEA): Regional Price Parities. bea.gov/data/prices-inflation/regional-price-parities-state-and-metro-area
- U.S. Bureau of Labor Statistics (BLS): Consumer Expenditure Survey. bls.gov/cex
Also consulted: MERIC: Cost of Living Data Series (2025/2026), composite index 107.2, rank #15.