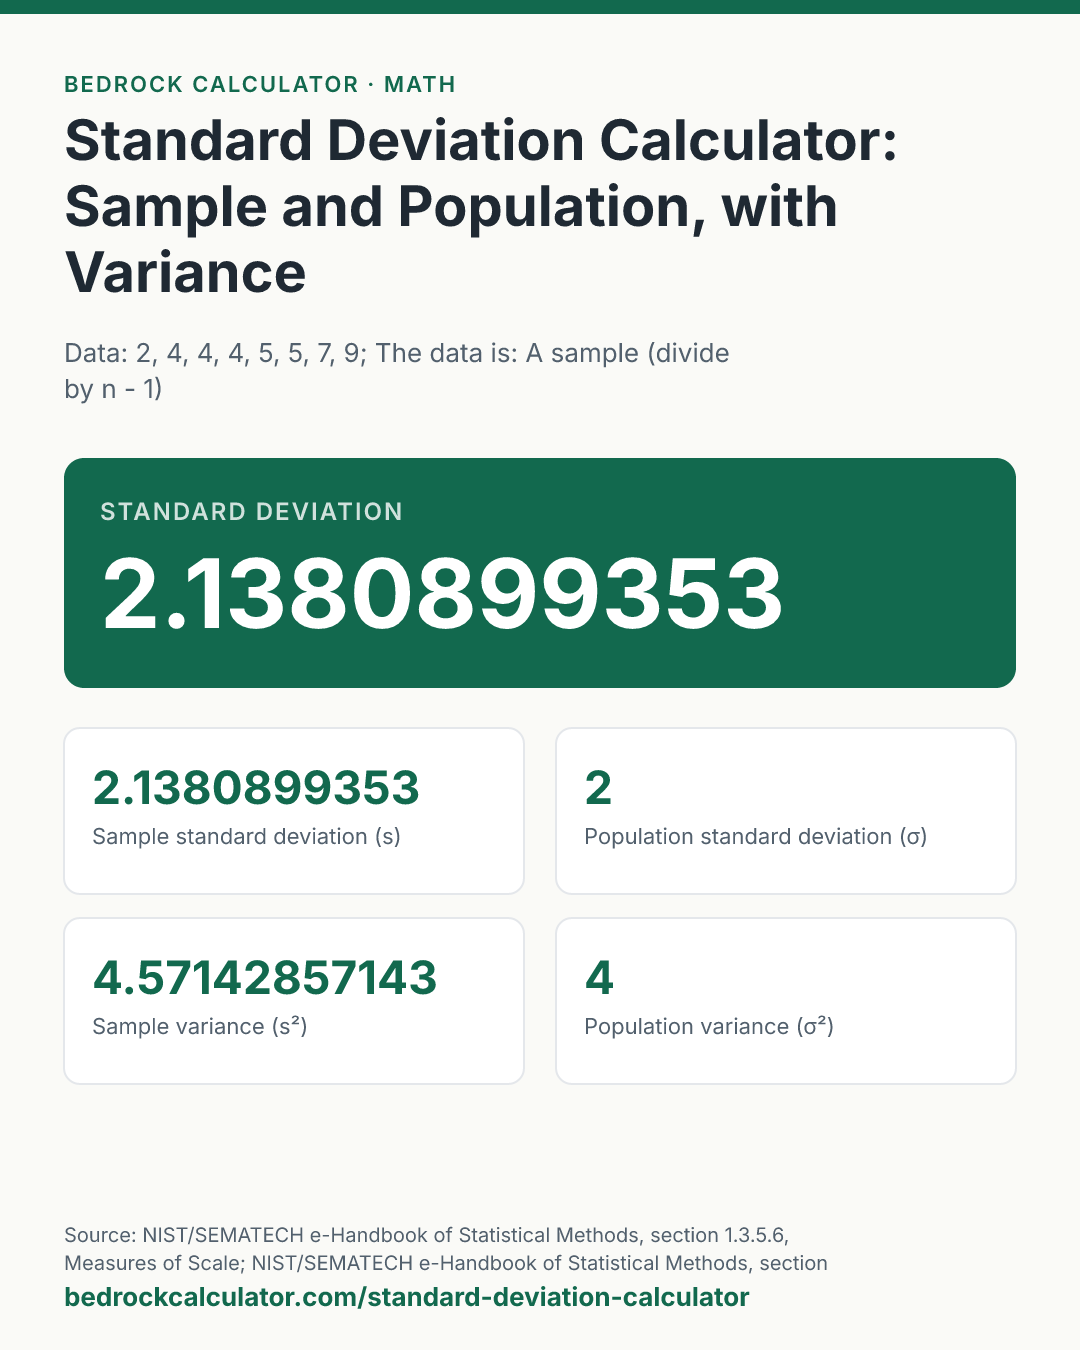

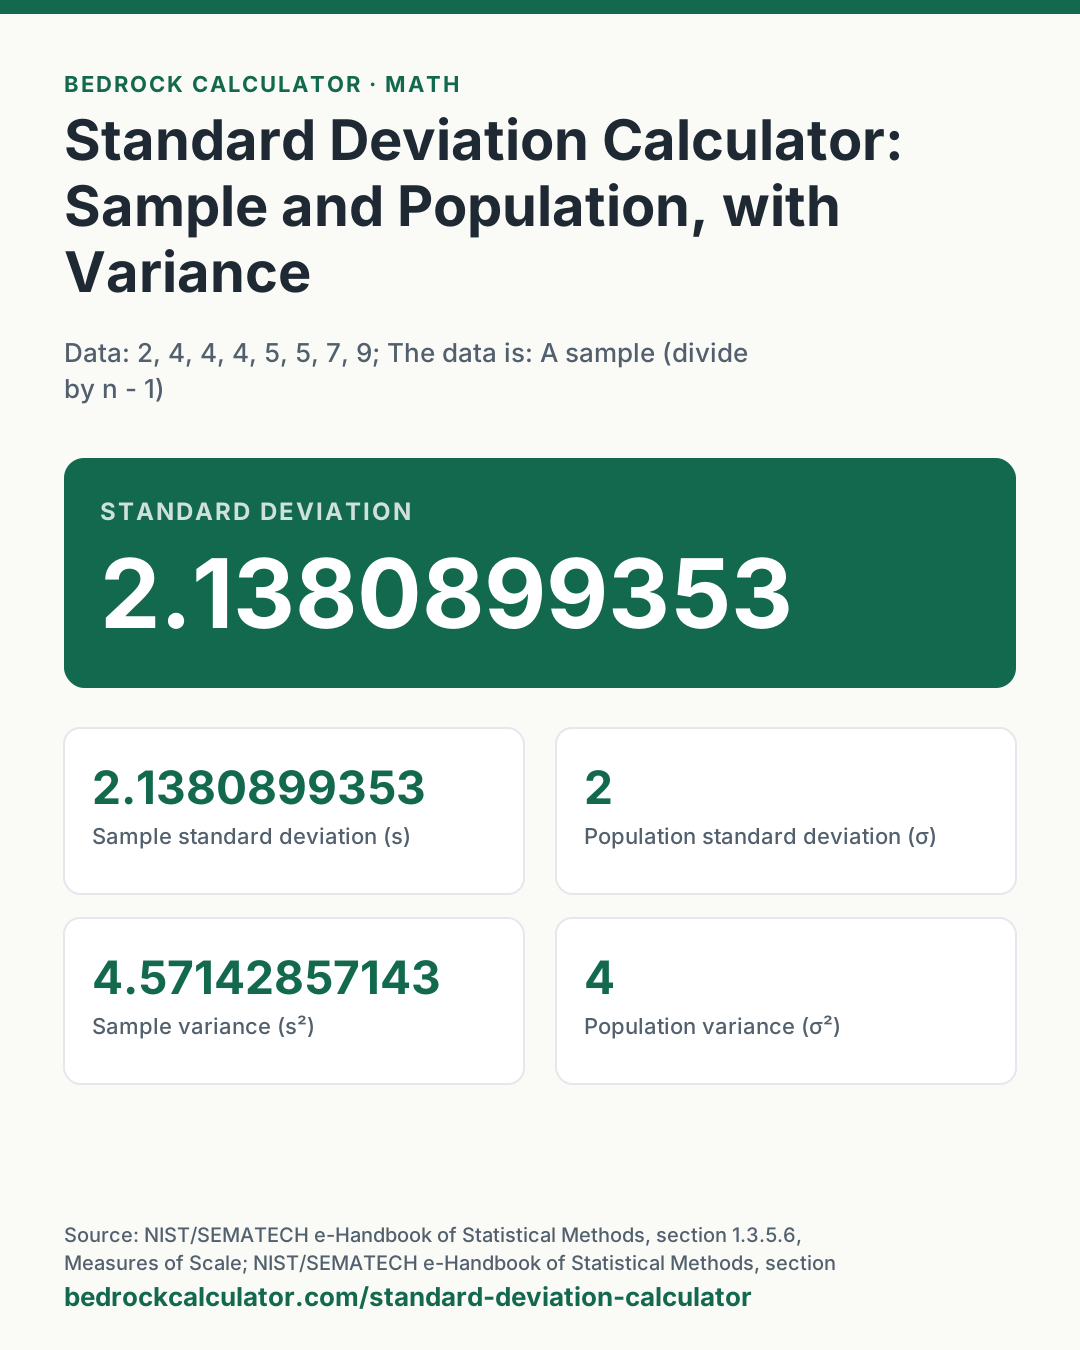
Quick Answer: For the data 2, 4, 4, 4, 5, 5, 7, 9 the sample standard deviation is 2.138 and the population standard deviation is 2. The mean is 5 and the squared deviations add up to 32; dividing by 7 gives the sample variance and dividing by 8 gives the population variance.
What does this calculator do?
This standard deviation calculator takes a list of numbers and returns both versions of the standard deviation and the variance, labelled, along with the mean, the count, the sum of squared deviations and the standard error of the mean.
Standard deviation measures how far the values typically sit from their mean. A small one means the data is bunched together; a large one means it is spread out. Variance is the same measure before the square root is taken, so it is in squared units (square millimetres for lengths in millimetres), which is why the standard deviation is usually the figure people report.
There are two versions because there are two situations. If your numbers are every member of the group you care about, such as the scores of everyone in one class when you only care about that class, they are a population and you divide by n. If they are a sample drawn from a larger group you want to describe, you divide by n - 1. The NIST/SEMATECH e-Handbook of Statistical Methods uses n - 1 as its definition of the variance, because that is the case statisticians meet most often. The calculator shows both so you can pick the one your course, software or report uses.
Using the Standard Deviation Calculator
- Paste or type the data, separated by commas, spaces or new lines. Do not use commas as thousands separators.
- Choose whether the data is a sample or the whole population. This only sets the headline; both results appear in the cards.
- Read the standard deviation at the top, then the variance, mean, sum of squares and standard error below.
- Check Entries skipped if the count looks wrong. Anything that is not a number is listed there.
How is this calculated?
- Read the data. Each entry is kept as an exact decimal, so measurements like 9.98 and 10.02 carry no binary rounding into the sums.
- Mean. Add the values and divide by the count n.
x̄ = 1/n∑(i = 1 to n) xᵢ
- Sum of squared deviations. Subtract the mean from each value, square the result and add them all up. This total, often written SS, is the numerator of both variances.
SS = ∑(i = 1 to n) (xᵢ − x̄)²
- Variances. The population variance divides SS by n. The sample variance divides it by n - 1, which is Bessel's correction: a sample's own mean sits closer to its values than the true mean does, so dividing by n would understate the spread on average.
σ² = SS/n; s² = SS/(n − 1)
- Standard deviations. Each is the square root of its variance, computed to 34 significant digits.
σ = √σ²; s = √s²
- Standard error of the mean. The sample standard deviation divided by the square root of n. It measures how much the mean itself would vary from sample to sample, not how much the data varies.
SE = s/√n
- Show the results. Every figure is rounded half up to 12 significant figures for display, with trailing zeros dropped. With a single value there is no sample variance, since n - 1 is zero, and the cards say so.
Worked Example
Using the default data, 2, 4, 4, 4, 5, 5, 7, 9:
- n = 8 and the sum is 40, so the mean is 5.
- Deviations from 5: -3, -1, -1, -1, 0, 0, 2, 4. Squared: 9, 1, 1, 1, 0, 0, 4, 16. Their sum is 32.
- Population variance: 32 ÷ 8 = 4, so the population standard deviation is 2.
- Sample variance: 32 ÷ 7 = 4.57142857143, and its square root is 2.1380899353.
- Standard error of the mean: 2.1380899353 ÷ √8 = 0.755928946018.
The Ten test scores preset (72, 85, 90, 66, 78, 88, 95, 70, 81, 75) has a mean of 80 and a sum of squares of 804. Its sample standard deviation is 9.45163125251 and its population standard deviation is 8.96660470858. The gap between the two shrinks as n grows, because n and n - 1 get closer in proportion.
Should I Use Sample or Population Standard Deviation?
Use the sample version when your data is a subset and you want to say something about the larger group: a survey of 200 customers, ten test tubes from a production run, a week of daily temperatures standing in for the season.
Use the population version only when the data is the entire group and you have no interest beyond it.
When in doubt, the sample version is the safer choice, and it is what most statistics software means by "standard deviation". In spreadsheets, STDEV.S is the sample version and STDEV.P is the population version; the same split applies to VAR.S and VAR.P.
What Is the Standard Deviation of the Mean?
The phrase usually means the standard error of the mean, the card at the end of the list. It answers a different question from the standard deviation. The standard deviation describes individual values; the standard error describes how precisely the sample mean pins down the true mean.
For the Repeated measurements preset, five readings of a length in millimetres, the standard deviation is 0.0158113883008 mm and the standard error is 0.00707106781187 mm. The standard error is smaller, and it keeps shrinking as you take more readings, while the standard deviation settles near the true spread.
Standard Deviation of Small Data Sets
The reference table runs the calculator on several short lists. Notice the row 1, 1, 1, 1: identical values have no spread, so both standard deviations are zero. The row 0, 10 shows how large the gap between the two versions can be when n is only 2.
What does this calculator not account for?
- Weighted or grouped data. Each value counts once. For a frequency table, list each value as many times as it occurs.
- Outliers. The standard deviation squares each deviation, so one extreme value can dominate it. The calculator reports what the data gives; deciding whether a point is a mistake is up to you.
- The shape of the distribution. Rules of thumb such as "about two thirds of values lie within one standard deviation of the mean" hold for normally distributed data, not for every data set. Nothing here tests for normality.
- Unbiased standard deviation. Dividing by n - 1 makes the sample variance an unbiased estimate of the population variance, but its square root is still slightly biased low for small samples. The small correction factor some fields apply is not used here.
- Hypothesis tests and intervals. For a confidence interval or a test of the mean, use the t-test calculator, which builds on these same figures.
What mistakes do people make with this?
- Using the wrong divisor. The difference matters most for small samples. With the two values 0 and 10, the sample standard deviation is 7.07106781187 and the population one is 5.
- Reporting the variance as if it were the standard deviation. The variance is in squared units. Take its square root before comparing it with the data.
- Confusing the standard deviation with the standard error. Error bars labelled "SE" are much narrower than "SD" bars on the same data. Say which one you plotted.
- Rounding the mean before computing deviations. A mean rounded to one decimal can shift every deviation and change the result. The calculator keeps the exact mean.
- Thousands separators. 1,200 is read as two values, 1 and 200. Type 1200.
Frequently Asked Questions
How do I calculate standard deviation by hand?
What is the difference between variance and standard deviation?
Why divide by n - 1?
Can the standard deviation be negative?
How do I find the variance from the standard deviation?
How many values do I need?
Sources
- NIST/SEMATECH e-Handbook of Statistical Methods, section 1.3.5.6, Measures of Scale: variance and standard deviation with the n - 1 divisor. itl.nist.gov/div898/handbook/eda/section3/eda356.htm
- NIST/SEMATECH e-Handbook of Statistical Methods, section 1.3.5.1, Measures of Location: the mean. itl.nist.gov/div898/handbook/eda/section3/eda351.htm
- NIST Special Publication 811, Appendix B.7: rules for rounding numbers. nist.gov/pml/special-publication-811/nist-guide-si-appendix-b-conversion-factors