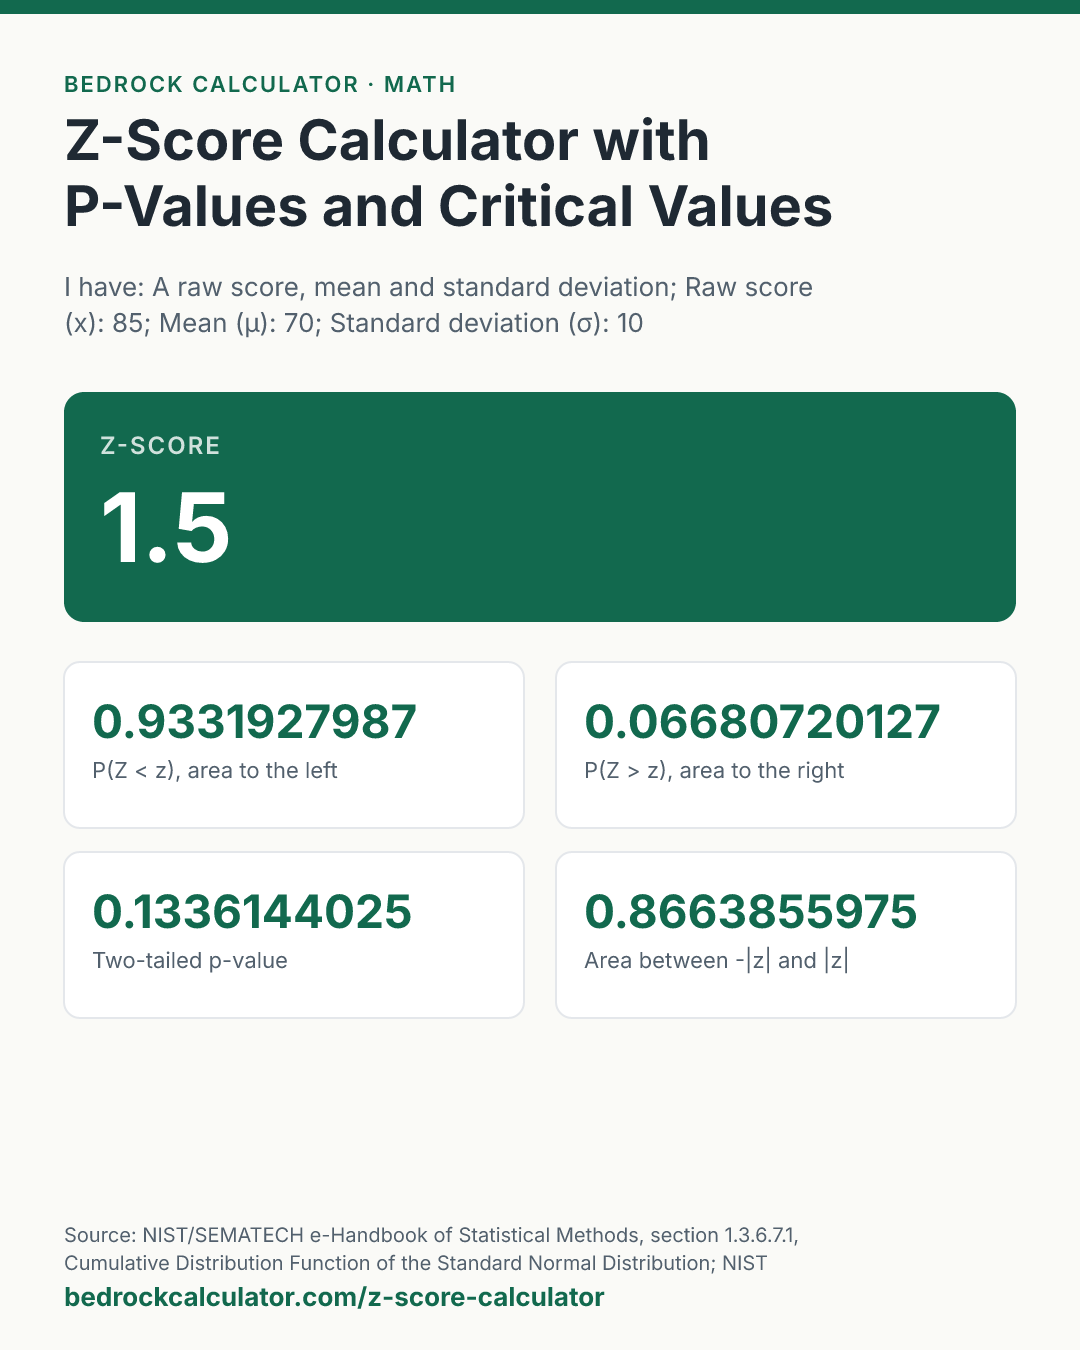

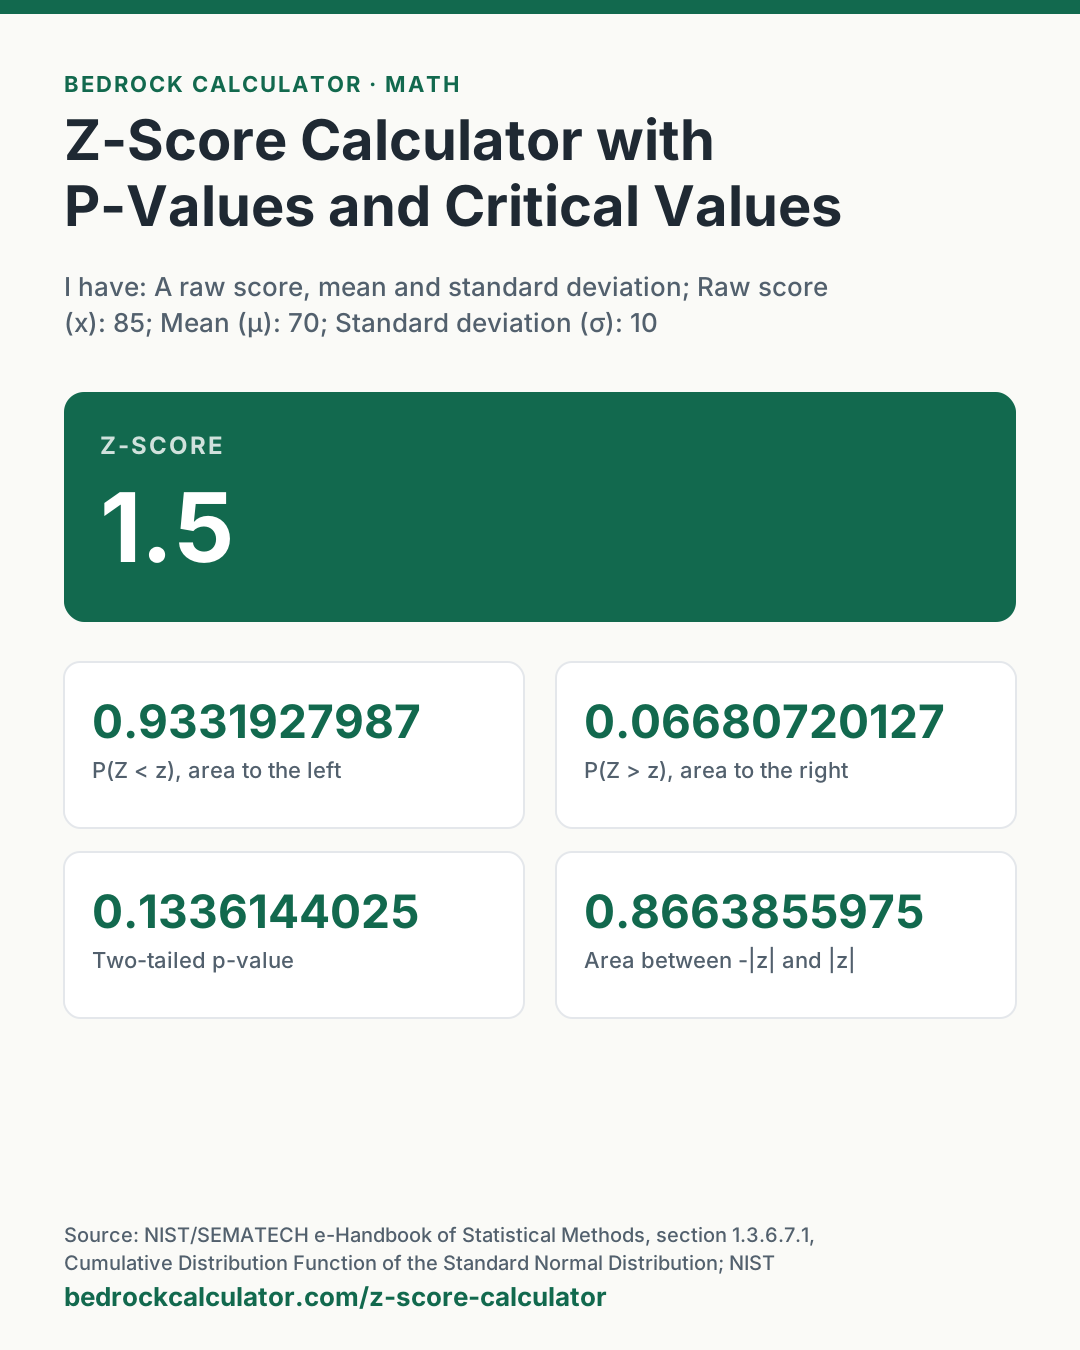
Quick Answer: A score of 85 from a distribution with mean 70 and standard deviation 10 has a z-score of 1.5. In a normal distribution 93.32% of values fall below it, and its two-tailed p-value is 0.1336.
What does this calculator do?
This z-score calculator does three related jobs. It standardises a raw score, turning "85 when the average is 70 and the standard deviation is 10" into "1.5 standard deviations above the mean". It turns a z-score into probabilities: the area to the left, the area to the right, and the two-tailed p-value.
And it runs the other way, giving the critical z for a confidence level such as 95% or 99%.
A z-score on its own is just a distance measured in standard deviations, and it is meaningful for any data. The probabilities are a further step: they assume the values follow a normal distribution, the familiar bell curve. When that assumption holds, a z-score tells you how unusual a value is, and a z statistic from a test tells you its p-value.
The probabilities are computed from the error function to 50 significant digits, not looked up in a printed table, and they agree with the standard normal table in the NIST/SEMATECH e-Handbook of Statistical Methods at every entry checked.
Using the Z-Score Calculator
- Choose what you have: a raw score with the mean and standard deviation, a z-score, or a confidence level.
- Fill in the boxes that mode uses. The others are hidden and keep their values if you switch back.
- Read the z-score (or the critical z in confidence mode) at the top. The cards give the left and right areas, the two-tailed p-value, the area between -|z| and |z|, and the percentile.
The presets load z = 1.96, a raw score one standard deviation below its mean, and the critical values for 99% and 90% confidence.
How is this calculated?
- Standardise the score. In raw score mode the mean is subtracted from the score and the difference is divided by the standard deviation. A standard deviation of zero or less is rejected, since it would make the division meaningless. In z-score mode, z is taken as typed.
z = (x − μ)/σ
- Area to the left. The standard normal cumulative probability Φ(z) is computed from the complementary error function, erfc. Below an argument of 4, erf comes from its all-positive power series (DLMF 7.6.2); above 4, erfc comes from its continued fraction (DLMF 7.9), which stays accurate deep into the tail where 1 minus a number close to 1 would lose every digit.
Φ(z) = 1/2 erfc(−z/√2)
- Area to the right. Computed directly as half of erfc(z/√2), not as 1 minus the left area, so a tiny right tail keeps its precision.
P(Z > z) = 1/2 erfc(z/√2)
- Two-tailed p-value and central area. The two-tailed p-value is twice the area beyond |z|. The area between -|z| and |z| is 1 minus that.
p_two = 2 P(Z > |z|)
- Critical z for a confidence level. In confidence mode, α is 1 minus the confidence level. The two-sided critical value is the z with Φ(z) = 1 - α/2, and the one-sided value has Φ(z) = 1 - α. Each is found by starting from a rational approximation accurate to about nine digits and taking Newton steps on the 50-digit Φ until the change is far below the digits shown.
- Show the results. z-scores are rounded half up to 12 significant figures and probabilities to 10, with trailing zeros dropped.
Worked Example
The default inputs are a score of 85, a mean of 70 and a standard deviation of 10.
- z = (85 - 70) ÷ 10 = 1.5.
- Area to the left: Φ(1.5) = 0.9331927987, so the score sits at the 93.31927987% percentile.
- Area to the right: 0.06680720127. That is the right-tailed p-value.
- Two-tailed p-value: twice the area beyond 1.5, 0.1336144025.
The Score of 62 (mean 70, SD 8) preset gives z = -1. The area to its left is 0.1586552539 and the area between -1 and 1 is 0.6826894921, the "about 68%" that people quote for one standard deviation.
How Do I Find a P-Value from a Z-Score?
Pick the tail that matches your test. For a right-tailed test, the p-value is the area to the right of z. For a left-tailed test, it is the area to the left. For a two-tailed test, it is twice the area beyond |z|.
For z = 1.96, the z = 1.96 preset gives a right-tail area of 0.02499789515 and a two-tailed p-value of 0.0499957903, just under 0.05. That is why 1.96 is the famous cut-off for a two-sided test at the 5% level. The NIST/SEMATECH table lists the area from 0 to 1.96 as 0.47500, which matches the calculator's left area of 0.9750021049 minus one half.
What Is the Critical Value for 95% Confidence?
The two-sided critical z for 95% confidence is 1.95996398454, usually rounded to 1.96. For 99% it is 2.57582930355 and for 90% it is 1.64485362695. The one-sided values are smaller because the whole α sits in one tail: 1.64485362695 for 95% and 2.32634787404 for 99%. The second reference table lists both for common levels.
Standard Normal Probabilities for Common Z-Scores
The first reference table gives the left area, right area and two-tailed p-value for z-scores people use most, from -3 to 4. Each row is a run of this calculator, so the figures match what the tool shows for the same z.
What does this calculator not account for?
- Non-normal data. The z-score itself is valid for any data, but the probabilities assume a normal distribution. For skewed data or data with heavy tails, they can be far off.
- Small samples with an estimated standard deviation. When σ is estimated from a small sample, a test statistic follows Student's t distribution, not the normal. Use the t-test calculator in that case.
- Sample means. To standardise a sample mean rather than a single value, divide by the standard error, σ divided by the square root of n, not by σ. Enter that standard error as the standard deviation.
- Discrete data. Counts such as the number of heads in 20 tosses are only approximately normal. No continuity correction is applied.
What mistakes do people make with this?
- Using the wrong tail. A two-tailed p-value is twice a one-tailed one. Decide which test you are doing before looking at the numbers.
- Mixing up the area to the left with the p-value. For a positive z the left area is large, near 1. The right area is the small p-value.
- Rounding z early. Rounding 1.645 to 1.6 changes a right-tail area of 0.04998490554 into something noticeably larger. Keep the full z.
- Dividing by the variance instead of the standard deviation. The denominator of a z-score is σ, not σ².
- Calling the percentile a probability of being correct. The percentile is the share of the distribution below z, nothing more.
Frequently Asked Questions
What does a z-score tell you?
What is a good z-score?
Can a z-score be negative?
How do I convert a z-score to a percentile?
What is the z statistic in a hypothesis test?
Why do critical values differ between one-sided and two-sided tests?
Sources
- NIST/SEMATECH e-Handbook of Statistical Methods, section 1.3.6.7.1, Cumulative Distribution Function of the Standard Normal Distribution: the table the calculator is checked against. itl.nist.gov/div898/handbook/eda/section3/eda3671.htm
- NIST Digital Library of Mathematical Functions, section 7.6: power series for the error function. dlmf.nist.gov/7.6
- NIST Digital Library of Mathematical Functions, section 7.9: continued fraction for the complementary error function. dlmf.nist.gov/7.9
- NIST/SEMATECH e-Handbook of Statistical Methods, section 1.3.6.6.1, Normal Distribution. itl.nist.gov/div898/handbook/eda/section3/eda3661.htm