Which US states cost the most and least to live in?
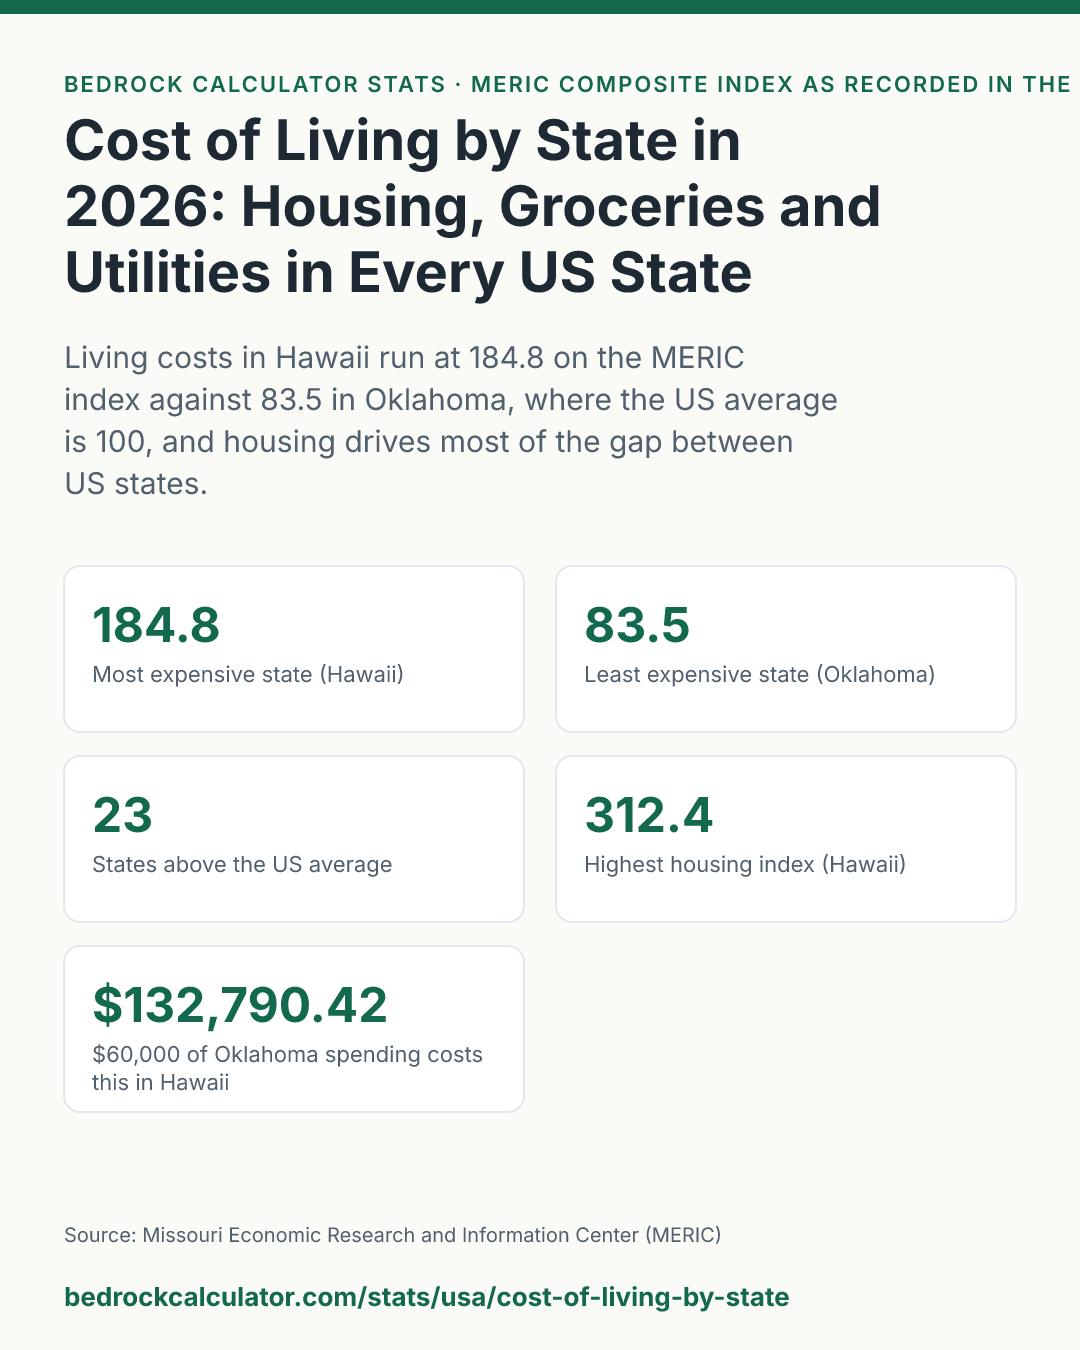
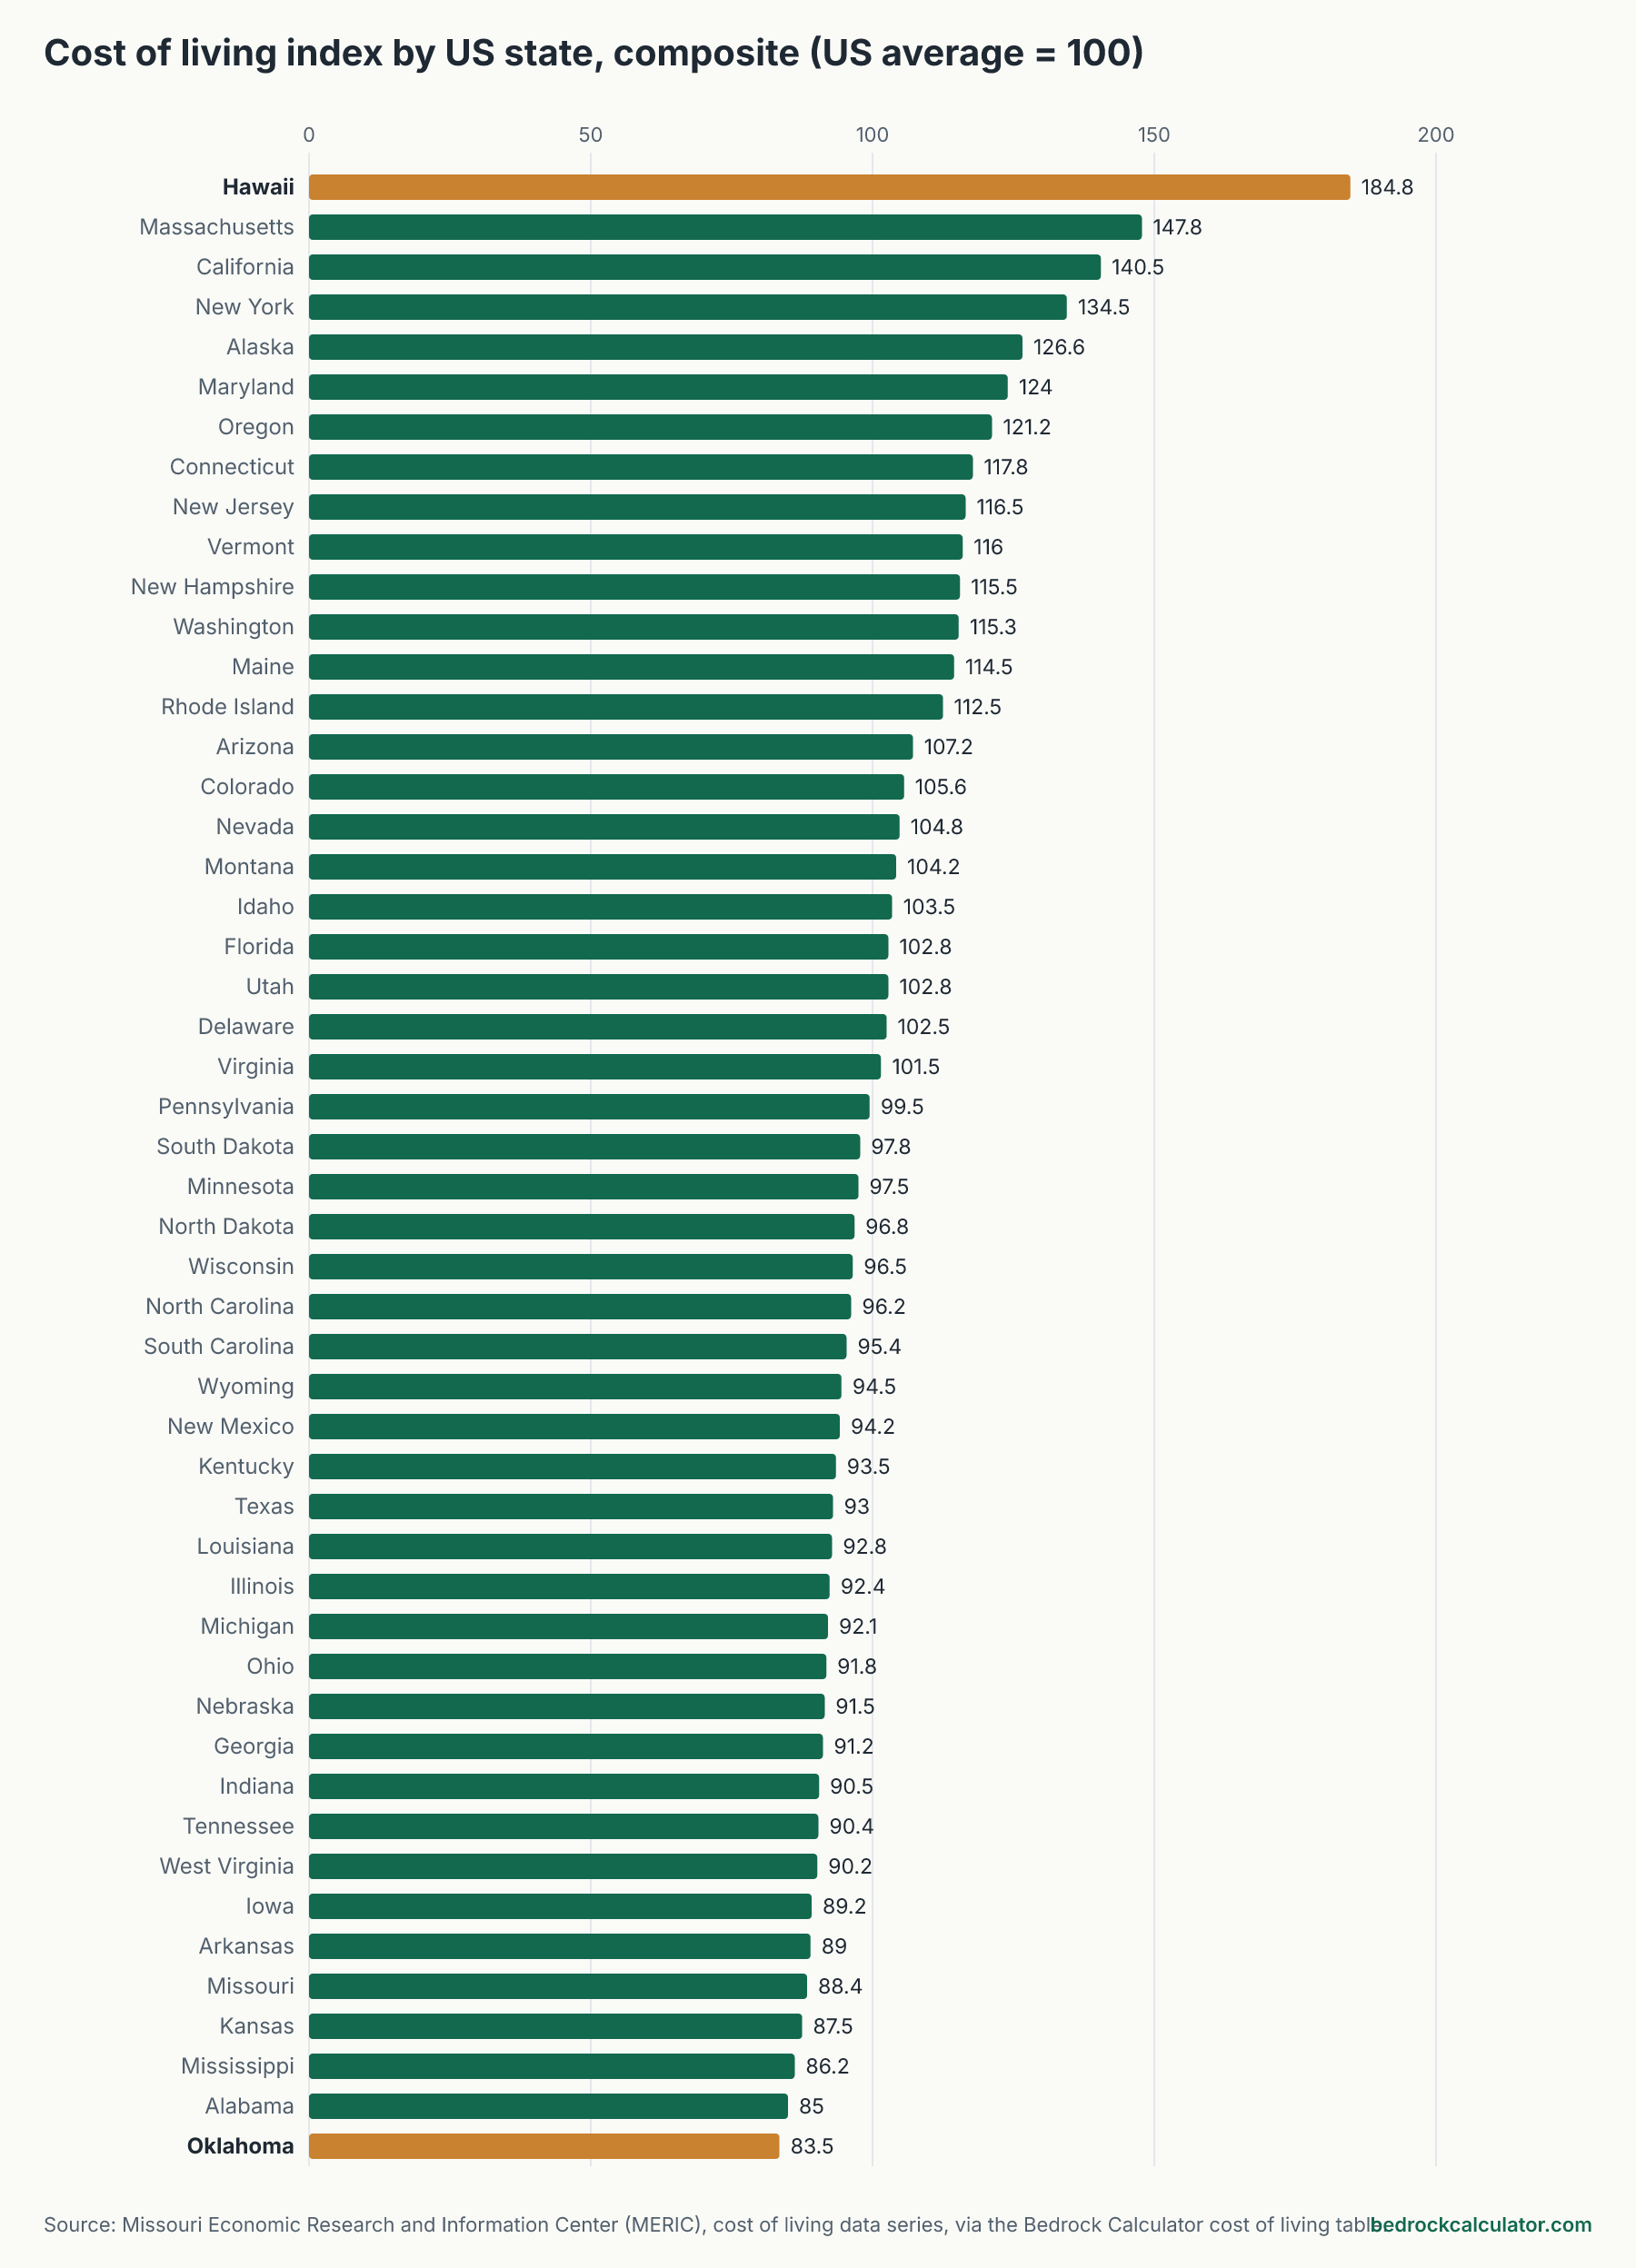
The most expensive US state to live in is Hawaii, with a cost of living index of 184.8. The cheapest is Oklahoma, at 83.5. On this index the US average is 100, so Hawaii is roughly 2.2 times as expensive as Oklahoma for the same basket of goods and services.
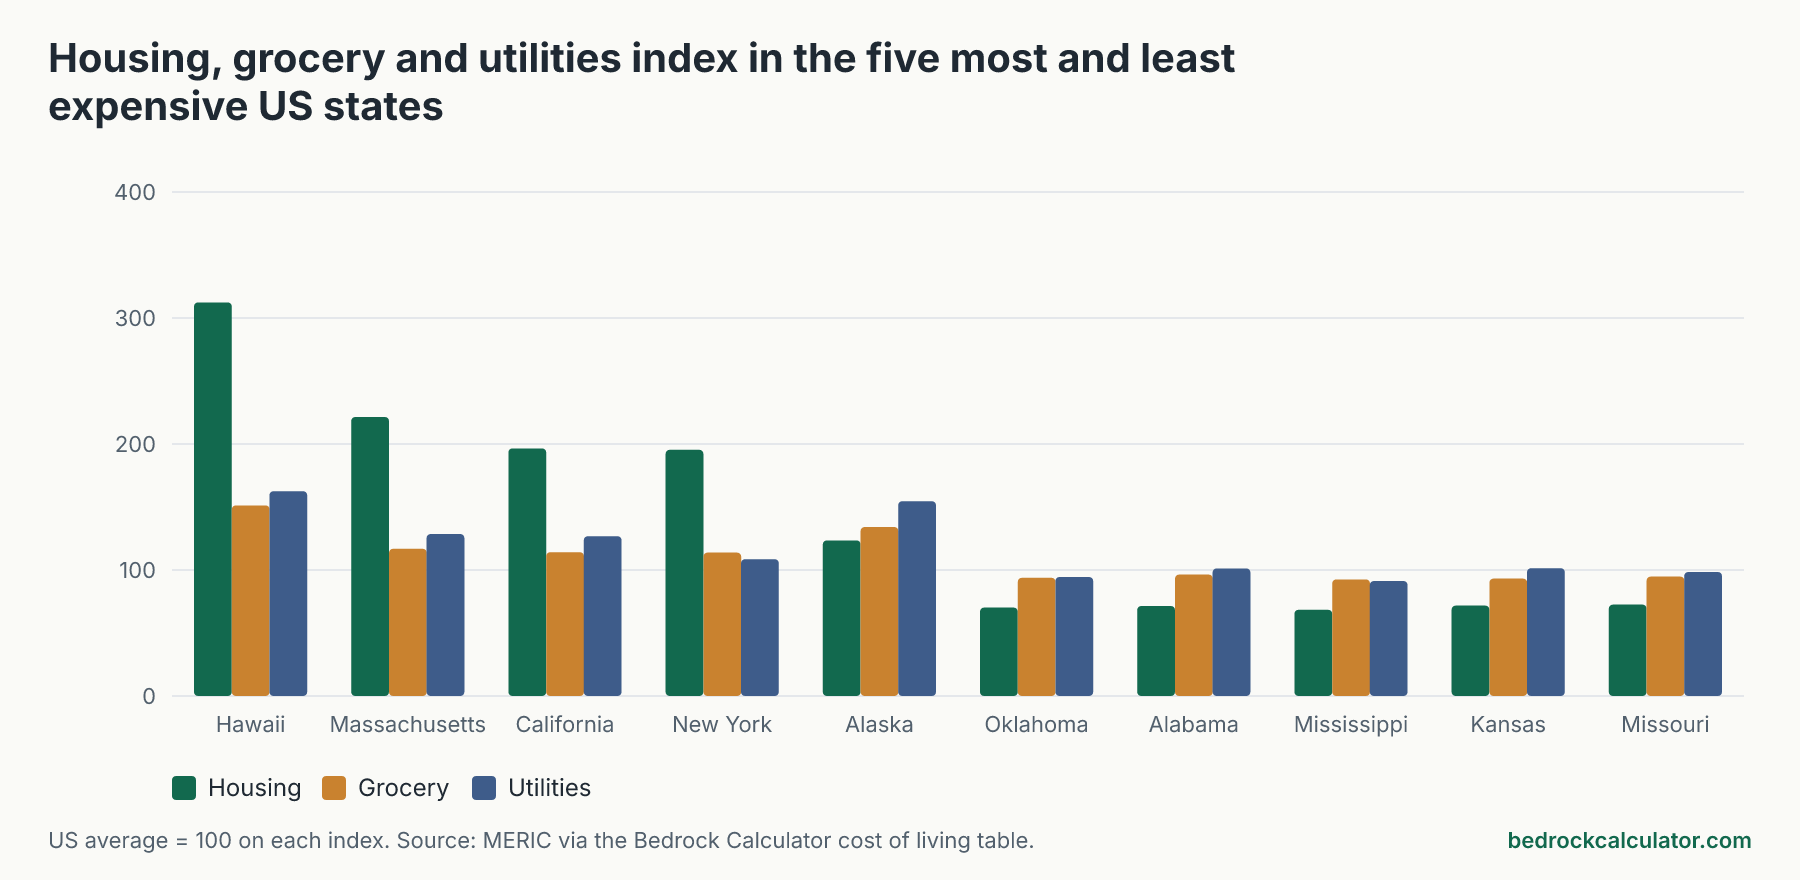
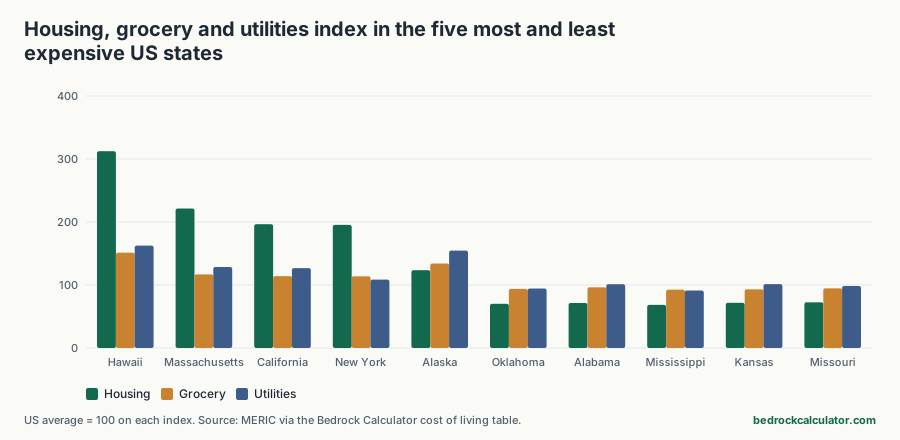
Housing is what really separates states. Groceries and utilities vary too, but the housing index ranges from 68.4 in Mississippi to 312.4 in Hawaii, a far wider spread than anything else.
Where these numbers come from
The figures are the cost of living index published by MERIC, the Missouri Economic Research and Information Center. MERIC compiles prices for the same goods and services across the country and scales each state so that the US average equals 100. A state at 110 is about a tenth more expensive than average; a state at 90 is about a tenth cheaper.
We use the composite index and three of its components, housing, groceries and utilities, as recorded in the table behind this site's cost of living calculator. MERIC's composite also includes transportation, health care and miscellaneous goods and services, which our table doesn't break out. So the three components here don't add up to the composite; they show where the biggest differences come from.
The dollar comparisons on this page come from running the cost of living calculator itself. It scales a budget by the ratio of the two states' composite indexes, nothing more.
Cost of living in every state
Sort by any column. A rank of 1 is the most expensive state.
Cost of living index by state, 2026 (US average = 100)
Download CSVMERIC composite index and three of its components. Higher means more expensive than the US average.
| Hawaii | 1 | 184.8 | 312.4 | 151.2 | 162.5 |
| Massachusetts | 2 | 147.8 | 221.5 | 116.8 | 128.5 |
| California | 3 | 140.5 | 196.5 | 114.2 | 126.8 |
| New York | 4 | 134.5 | 195.4 | 113.8 | 108.5 |
| Alaska | 5 | 126.6 | 123.5 | 134.2 | 154.6 |
| Maryland | 6 | 124 | 148.5 | 109.4 | 112.5 |
| Oregon | 7 | 121.2 | 146.5 | 108.5 | 92.4 |
| Connecticut | 8 | 117.8 | 129.5 | 107.5 | 128.4 |
| New Jersey | 9 | 116.5 | 135.4 | 108.5 | 111.4 |
| Vermont | 10 | 116 | 127.8 | 108.2 | 119.5 |
| New Hampshire | 11 | 115.5 | 126.8 | 107.4 | 121.2 |
| Washington | 12 | 115.3 | 128.5 | 109.5 | 90.5 |
| Maine | 13 | 114.5 | 124.6 | 106.2 | 115.4 |
| Rhode Island | 14 | 112.5 | 120.4 | 106.8 | 122.5 |
| Arizona | 15 | 107.2 | 121.3 | 100.4 | 104.2 |
| Colorado | 16 | 105.6 | 119.4 | 101.2 | 92.5 |
| Nevada | 17 | 104.8 | 118.5 | 104.2 | 93.8 |
| Montana | 18 | 104.2 | 116.8 | 103.5 | 91.2 |
| Idaho | 19 | 103.5 | 115.6 | 99.4 | 88.5 |
| Florida | 20 | 102.8 | 110.2 | 105.4 | 101.4 |
| Utah | 20 | 102.8 | 112.5 | 100.5 | 91.8 |
| Delaware | 22 | 102.5 | 101.2 | 104.5 | 103.5 |
| Virginia | 23 | 101.5 | 106.4 | 99.8 | 98.4 |
| Pennsylvania | 24 | 99.5 | 94.2 | 103.5 | 104.2 |
| South Dakota | 25 | 97.8 | 92.4 | 100.8 | 93.5 |
| Minnesota | 26 | 97.5 | 91.2 | 101.4 | 94.5 |
| North Dakota | 27 | 96.8 | 88.4 | 101.5 | 95.2 |
| Wisconsin | 28 | 96.5 | 89.2 | 98.4 | 96.5 |
| North Carolina | 29 | 96.2 | 89.5 | 98.2 | 97.4 |
| South Carolina | 30 | 95.4 | 86.5 | 99.2 | 101.4 |
| Wyoming | 31 | 94.5 | 87.2 | 99.5 | 89.4 |
| New Mexico | 32 | 94.2 | 87.5 | 98.5 | 89.2 |
| Kentucky | 33 | 93.5 | 81.2 | 95.4 | 97.5 |
| Texas | 34 | 93 | 84.2 | 94.5 | 103.5 |
| Louisiana | 35 | 92.8 | 82.4 | 98.2 | 89.5 |
| Illinois | 36 | 92.4 | 83.5 | 98.6 | 93.4 |
| Michigan | 37 | 92.1 | 80.5 | 95.8 | 97.2 |
| Ohio | 38 | 91.8 | 78.4 | 97.2 | 95.8 |
| Nebraska | 39 | 91.5 | 80.2 | 97.4 | 93.5 |
| Georgia | 40 | 91.2 | 79.5 | 97.4 | 94.5 |
| Indiana | 41 | 90.5 | 77.4 | 94.2 | 96.8 |
| Tennessee | 42 | 90.4 | 78.5 | 95.2 | 94.2 |
| West Virginia | 43 | 90.2 | 76.5 | 96.8 | 93.2 |
| Iowa | 44 | 89.2 | 74.2 | 96.1 | 92.4 |
| Arkansas | 45 | 89 | 73.8 | 93.5 | 94.2 |
| Missouri | 46 | 88.4 | 72.5 | 94.8 | 98.4 |
| Kansas | 47 | 87.5 | 71.8 | 93.2 | 101.5 |
| Mississippi | 48 | 86.2 | 68.4 | 92.5 | 91.2 |
| Alabama | 49 | 85 | 71.5 | 96.4 | 101.2 |
| Oklahoma | 50 | 83.5 | 70.2 | 93.8 | 94.5 |
The most and least expensive states
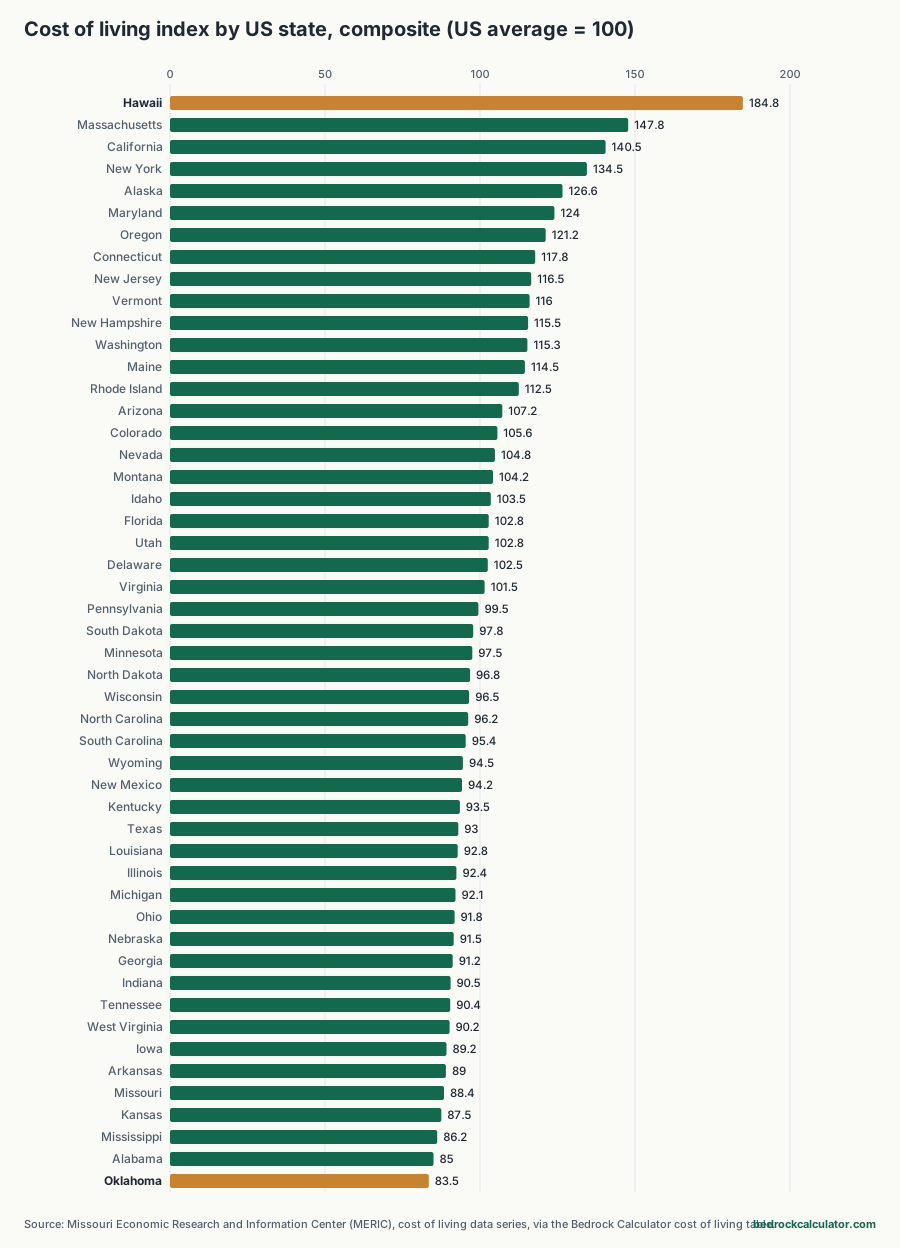
The five most expensive states on the composite index are Hawaii, Massachusetts, California, New York and Alaska. The five cheapest are Oklahoma, Alabama, Mississippi, Kansas and Missouri.
23 states sit above the US average and 27 below it. The median state scores 97.65, a little under 100. That's because a few very expensive states pull the national average up, so more than half of states come in below it.
For a sense of the familiar names: California scores 140.5, New York 134.5, Florida 102.8 and Texas 93.
Why housing decides the ranking
Look across the components and the pattern is plain. The most expensive housing market is about 4.6 times as costly as the cheapest. For groceries the spread is about 1.6 times, and for utilities about 1.8 times.
In other words, a gallon of milk or a power bill costs more in some states, but not wildly more. A home does. Hawaii has the highest housing index at 312.4, and Mississippi the lowest at 68.4. Groceries are also most expensive in Hawaii and cheapest in Mississippi. Utilities are most expensive in Hawaii, at 162.5, and cheapest in Idaho, at 88.5.
This matters for how you read the composite. If you already own your home outright, the housing component affects you much less than it affects a renter or a new buyer. Your personal cost of living gap between two states could be much smaller, or much larger, than the composite suggests.
What it means in dollars
Using the calculator, spending that costs $60,000 a year in Oklahoma would cost about $132,790.42 in Hawaii. Going the other way, $60,000 spent in Hawaii buys what about $27,110.39 buys in Oklahoma.
Those numbers are a simple ratio of the two indexes. They convert spending, not salary. A salary offer has to cover taxes and savings as well, and state income tax isn't in this index at all.
What the index doesn't tell you
- Taxes. State income, sales and property taxes are not part of the cost of living index. A cheap state with a high income tax can cost more overall than its index suggests.
- Differences inside a state. Each state gets one number. A big city and a rural county in the same state can differ more than two whole states do.
- Your own spending mix. The index uses a typical household's basket. If you rent, commute long distances or have high medical costs, your mix is different.
- Wages. Prices and pay don't move together reliably. A cheaper state may also pay less for the same job.
Run your own numbers
To compare two specific states with your own budget, use the cost of living calculator. To add taxes to the picture, run your salary through the paycheck calculator for each state, and check the property tax calculator if you plan to buy.