What is a dollar from a past year worth today?
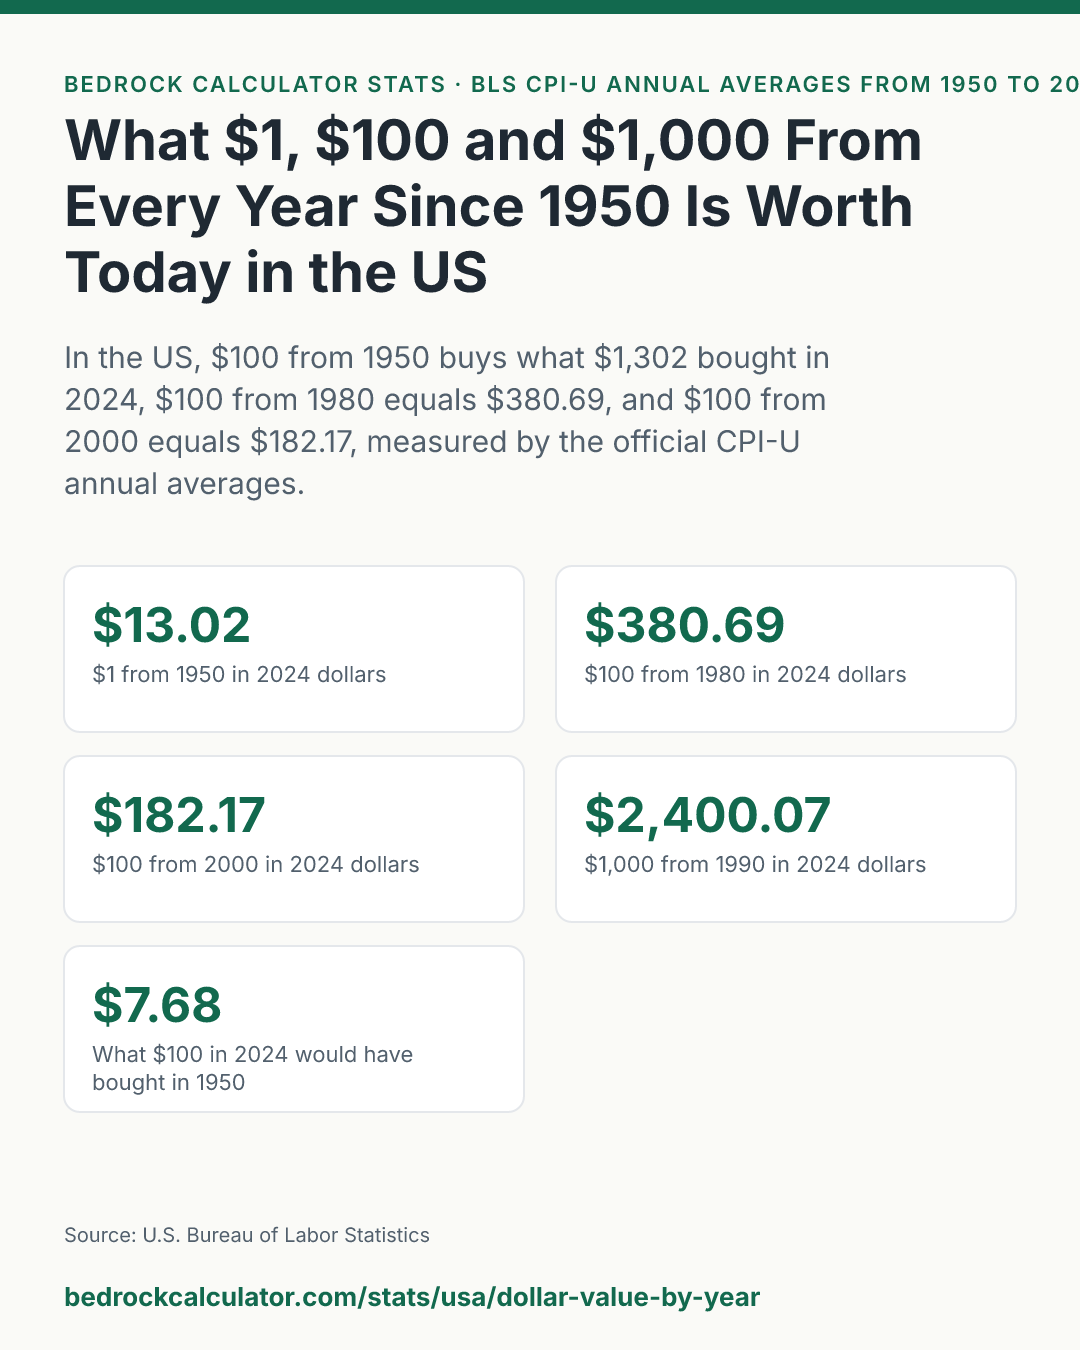
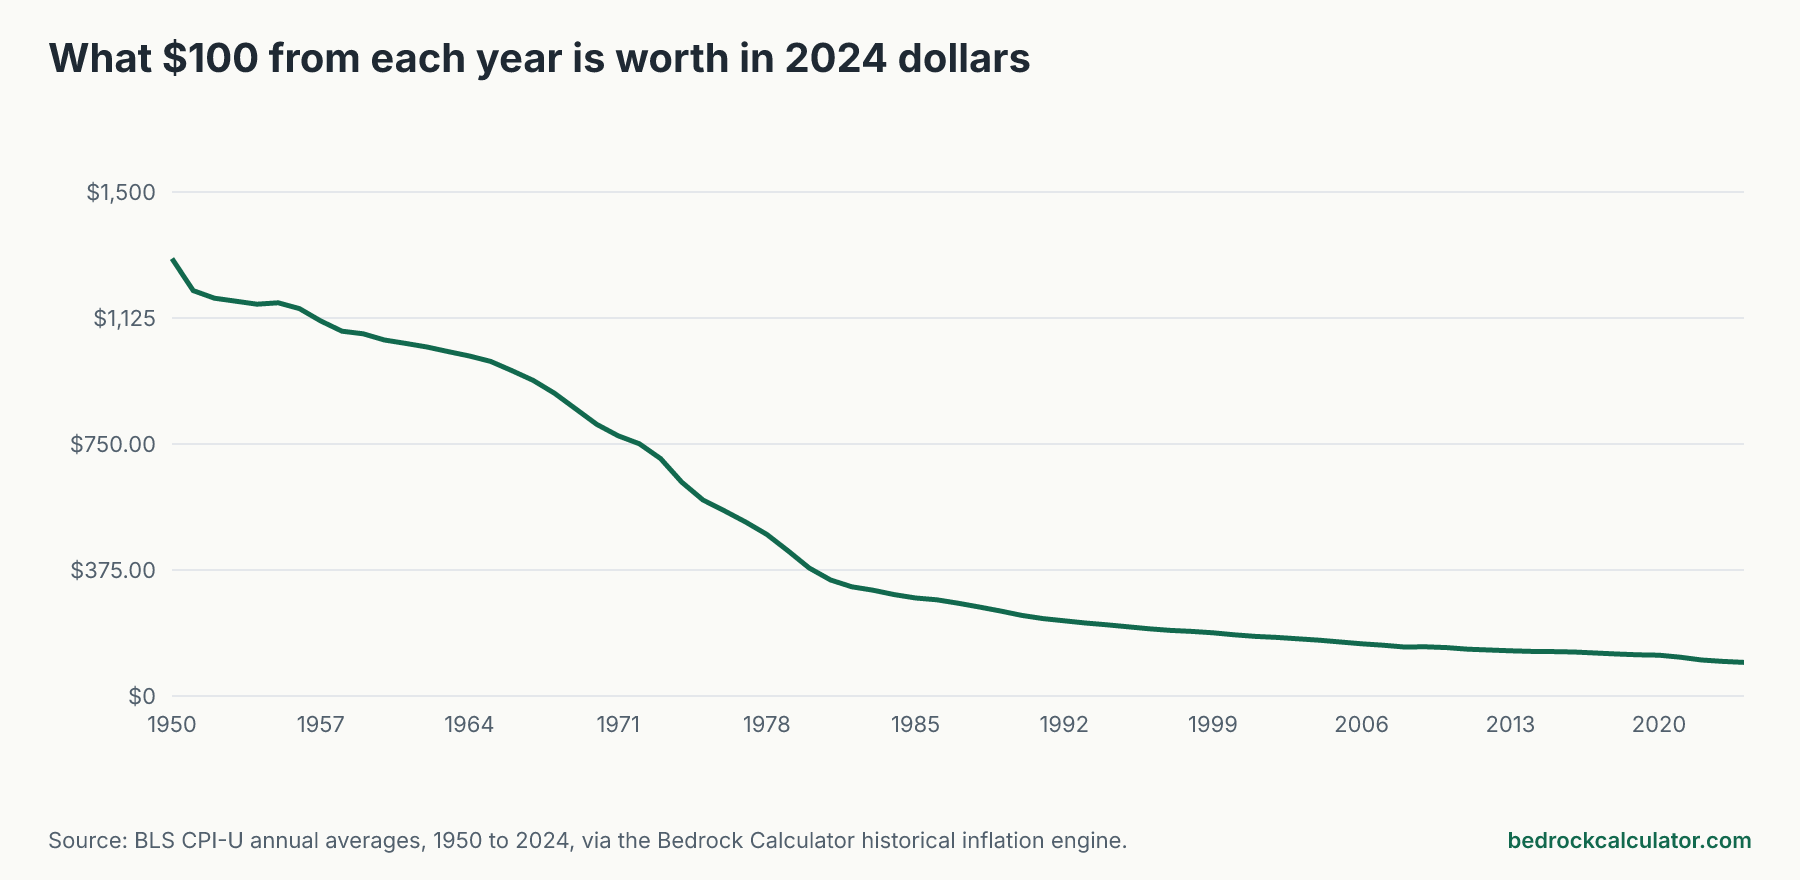
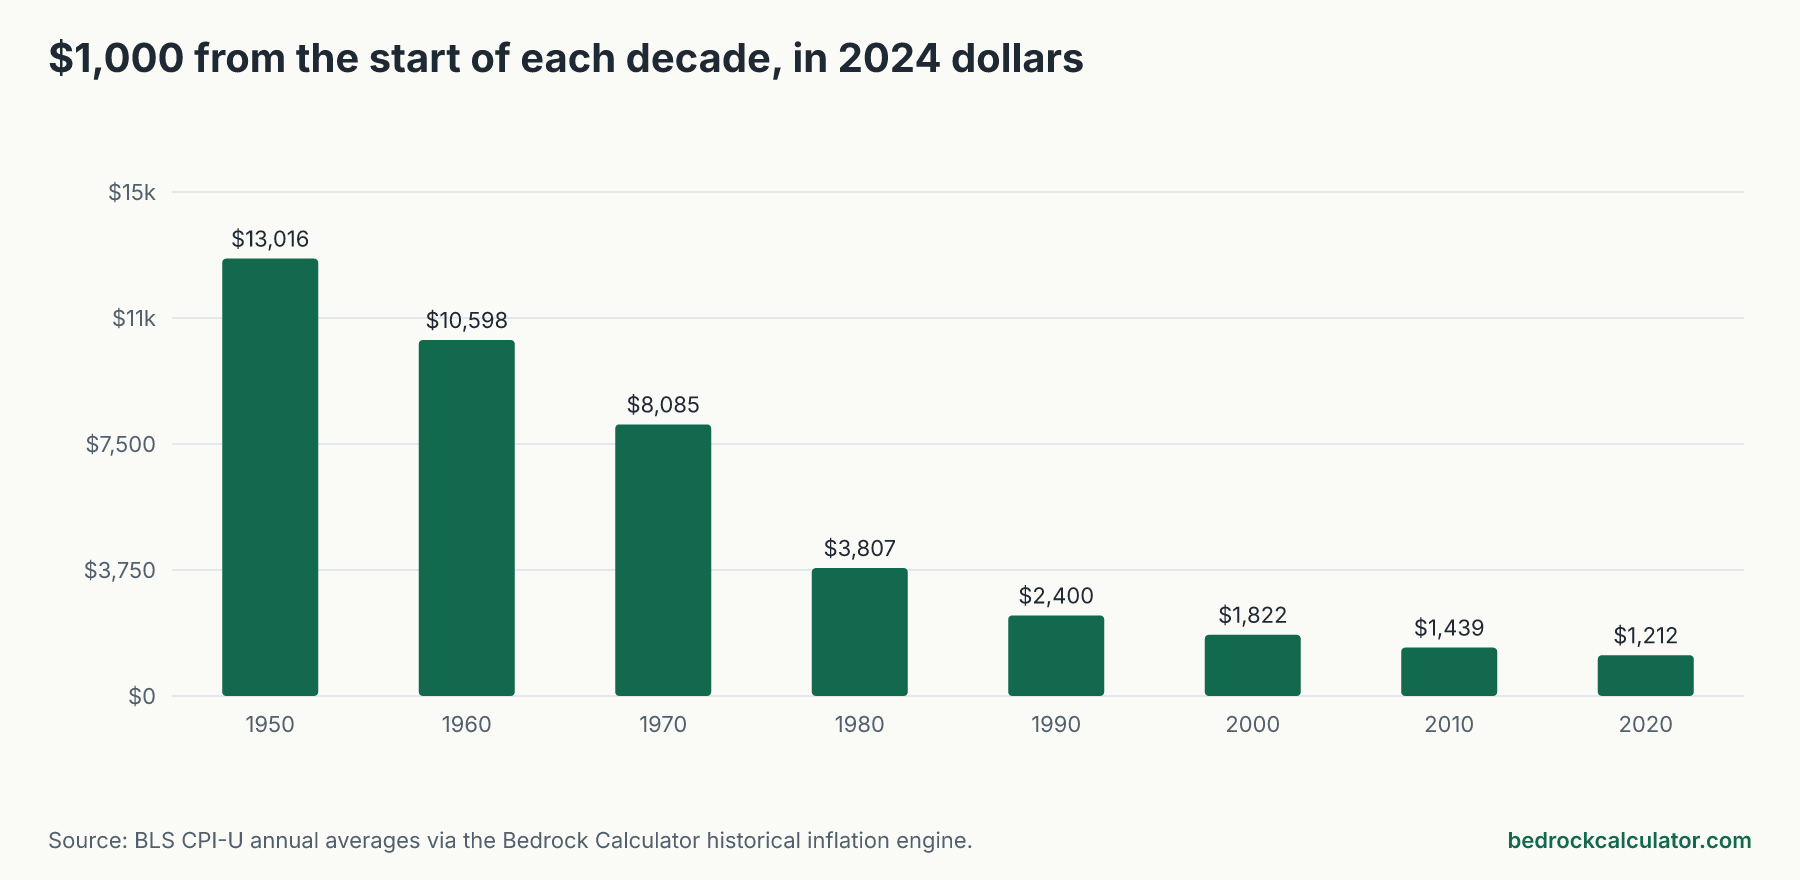
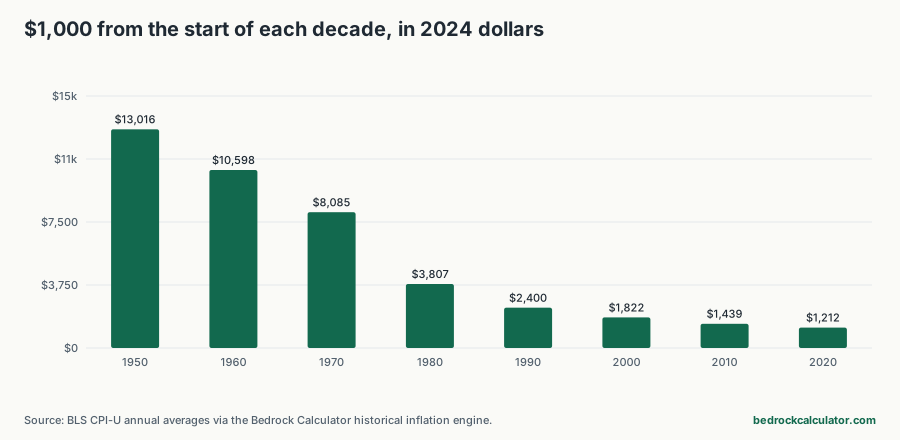
In the US, a dollar from 1950 has the buying power of $13.02 in 2024. That makes $100 from 1950 worth $1,301.61 and $1,000 worth $13,016.14 in 2024 money.
Closer to living memory, $100 from 1980 is worth $380.69, $100 from 1990 is worth $240.01, and $100 from 2000 is worth $182.17. Every figure on this page comes from the official US consumer price index, year by year, with nothing estimated.
How we worked out these numbers
We ran the historical inflation calculator on this site once for every year from 1950 to 2024, at $1, $100 and $1,000, with 2024 as the target year. The calculator uses the method the Bureau of Labor Statistics uses for its own inflation calculator: multiply the amount by the index for the target year, then divide by the index for the starting year.
The index is CPI-U, the Consumer Price Index for All Urban Consumers, U.S. city average, all items. We use its annual average for each year, not a single month. The index stood at 24.1 in 1950 and 313.689 in 2024, measured against a base of 100 for 1982 to 1984.
Why stop at 2024? It's the latest year in our table with a complete, final annual average. BLS couldn't collect price data for October and November 2025 during the federal shutdown, so there is no finalized 2025 annual average to divide by. When this page says "today," it means 2024 dollars. Prices have risen a little more since then, so a figure in current dollars would be slightly higher.
Every year from 1950 to 2024
Click a column heading to sort. The last column is the raw index, if you want to check a conversion yourself or run one between two past years.
What $1, $100 and $1,000 from each year is worth in 2024 dollars
Download CSVAmount times CPI-U for 2024 divided by CPI-U for the starting year. CPI-U, U.S. city average, all items, annual average (1982-84 = 100).
| 1950 | $13.02 | $1,301.61 | $13,016.14 | 24.1 |
| 1951 | $12.06 | $1,206.50 | $12,064.96 | 26 |
| 1952 | $11.84 | $1,183.73 | $11,837.32 | 26.5 |
| 1953 | $11.75 | $1,174.87 | $11,748.65 | 26.7 |
| 1954 | $11.66 | $1,166.13 | $11,661.30 | 26.9 |
| 1955 | $11.70 | $1,170.48 | $11,704.81 | 26.8 |
| 1956 | $11.53 | $1,153.27 | $11,532.68 | 27.2 |
| 1957 | $11.16 | $1,116.33 | $11,163.31 | 28.1 |
| 1958 | $10.85 | $1,085.43 | $10,854.29 | 28.9 |
| 1959 | $10.78 | $1,077.97 | $10,779.69 | 29.1 |
| 1960 | $10.60 | $1,059.76 | $10,597.60 | 29.6 |
| 1961 | $10.49 | $1,049.13 | $10,491.27 | 29.9 |
| 1962 | $10.39 | $1,038.71 | $10,387.05 | 30.2 |
| 1963 | $10.25 | $1,025.13 | $10,251.27 | 30.6 |
| 1964 | $10.12 | $1,011.90 | $10,119.00 | 31 |
| 1965 | $9.96 | $995.84 | $9,958.38 | 31.5 |
| 1966 | $9.68 | $968.18 | $9,681.76 | 32.4 |
| 1967 | $9.39 | $939.19 | $9,391.89 | 33.4 |
| 1968 | $9.01 | $901.41 | $9,014.05 | 34.8 |
| 1969 | $8.55 | $854.74 | $8,547.38 | 36.7 |
| 1970 | $8.08 | $808.48 | $8,084.77 | 38.8 |
| 1971 | $7.75 | $774.54 | $7,745.41 | 40.5 |
| 1972 | $7.50 | $750.45 | $7,504.52 | 41.8 |
| 1973 | $7.07 | $706.51 | $7,065.07 | 44.4 |
| 1974 | $6.36 | $636.29 | $6,362.86 | 49.3 |
| 1975 | $5.83 | $583.07 | $5,830.65 | 53.8 |
| 1976 | $5.51 | $551.30 | $5,512.99 | 56.9 |
| 1977 | $5.18 | $517.64 | $5,176.39 | 60.6 |
| 1978 | $4.81 | $481.12 | $4,811.18 | 65.2 |
| 1979 | $4.32 | $432.08 | $4,320.79 | 72.6 |
| 1980 | $3.81 | $380.69 | $3,806.91 | 82.4 |
| 1981 | $3.45 | $345.09 | $3,450.92 | 90.9 |
| 1982 | $3.25 | $325.07 | $3,250.66 | 96.5 |
| 1983 | $3.15 | $314.95 | $3,149.49 | 99.6 |
| 1984 | $3.02 | $301.91 | $3,019.14 | 103.9 |
| 1985 | $2.92 | $291.53 | $2,915.33 | 107.6 |
| 1986 | $2.86 | $286.21 | $2,862.13 | 109.6 |
| 1987 | $2.76 | $276.13 | $2,761.35 | 113.6 |
| 1988 | $2.65 | $265.16 | $2,651.64 | 118.3 |
| 1989 | $2.53 | $252.98 | $2,529.75 | 124 |
| 1990 | $2.40 | $240.01 | $2,400.07 | 130.7 |
| 1991 | $2.30 | $230.31 | $2,303.15 | 136.2 |
| 1992 | $2.24 | $223.58 | $2,235.84 | 140.3 |
| 1993 | $2.17 | $217.09 | $2,170.86 | 144.5 |
| 1994 | $2.12 | $211.67 | $2,116.66 | 148.2 |
| 1995 | $2.06 | $205.83 | $2,058.33 | 152.4 |
| 1996 | $2.00 | $199.93 | $1,999.29 | 156.9 |
| 1997 | $1.95 | $195.44 | $1,954.45 | 160.5 |
| 1998 | $1.92 | $192.45 | $1,924.47 | 163 |
| 1999 | $1.88 | $188.29 | $1,882.89 | 166.6 |
| 2000 | $1.82 | $182.17 | $1,821.66 | 172.2 |
| 2001 | $1.77 | $177.13 | $1,771.25 | 177.1 |
| 2002 | $1.74 | $174.37 | $1,743.69 | 179.9 |
| 2003 | $1.70 | $170.48 | $1,704.83 | 184 |
| 2004 | $1.66 | $166.06 | $1,660.61 | 188.9 |
| 2005 | $1.61 | $160.62 | $1,606.19 | 195.3 |
| 2006 | $1.56 | $155.60 | $1,556.00 | 201.6 |
| 2007 | $1.51 | $151.29 | $1,512.91 | 207.342 |
| 2008 | $1.46 | $145.70 | $1,456.97 | 215.303 |
| 2009 | $1.46 | $146.22 | $1,462.17 | 214.537 |
| 2010 | $1.44 | $143.86 | $1,438.57 | 218.056 |
| 2011 | $1.39 | $139.46 | $1,394.55 | 224.939 |
| 2012 | $1.37 | $136.63 | $1,366.28 | 229.594 |
| 2013 | $1.35 | $134.66 | $1,346.55 | 232.957 |
| 2014 | $1.33 | $132.51 | $1,325.06 | 236.736 |
| 2015 | $1.32 | $132.35 | $1,323.49 | 237.017 |
| 2016 | $1.31 | $130.70 | $1,307.00 | 240.007 |
| 2017 | $1.28 | $127.97 | $1,279.74 | 245.12 |
| 2018 | $1.25 | $124.92 | $1,249.22 | 251.107 |
| 2019 | $1.23 | $122.70 | $1,226.99 | 255.657 |
| 2020 | $1.21 | $121.20 | $1,212.04 | 258.811 |
| 2021 | $1.16 | $115.77 | $1,157.65 | 270.97 |
| 2022 | $1.07 | $107.19 | $1,071.87 | 292.655 |
| 2023 | $1.03 | $102.95 | $1,029.49 | 304.702 |
| 2024 | $1.00 | $100.00 | $1,000.00 | 313.689 |
What the numbers say about a dollar's buying power
Read the table from the bottom up and you can see how quickly the value of a dollar slid in some decades and how slowly in others.
The 1970s did the most damage. $100 from 1970 had become worth $212.37 in 1980 money just ten years later, so prices more than doubled in a single decade. Compare that with 2010 to 2020, when $100 grew to only $118.69 in 2020 money.
That's why a 1970 dollar ($808.48 per $100 in 2024 terms) and a 1980 dollar ($380.69 per $100) are so far apart even though they're only a decade apart.
Here's the same story told as a single sum. $1,000 from 1970 equals $8,084.77 in 2024. $1,000 from 1980 equals $3,806.91, from 1990 $2,400.07, and from 2000 $1,821.66.
The question in reverse: what today's money would have bought
Sometimes the more useful question runs the other way. If you have $100 in 2024, what would that have bought in an earlier year?
- In 1950, it would have bought what $7.68 bought.
- In 1980, what $26.27 bought.
- In 2000, what $54.90 bought.
So a 2024 dollar buys a little over half of what a dollar bought in 2000. Prices have at least doubled since 1995: one dollar from that year is worth $2.06 in 2024.
Who these figures are useful for
- Comparing old prices and wages. If your parents bought a house or earned a salary in a given year, multiply by the "$1 in 2024 dollars" column to put it in today's terms. Our companion page on how far past salaries have to grow to keep up does exactly that for common salaries.
- Checking whether savings kept pace. A balance that grew more slowly than the index lost buying power, even if the number went up. See whether savings beat inflation over the last decade.
- Legal and family settlements. Old sums named in wills, trusts or agreements are often restated in current dollars using exactly this ratio.
What does this calculator not account for?
The consumer price index is a national average over a broad basket of goods and services bought by urban households. It is not your personal inflation rate. If most of your budget goes to rent, health care or college tuition, which have often risen faster than the overall index, your own dollars lost value faster than these figures show.
If you spend more on electronics or clothing, which have often risen more slowly, they lost value more slowly.
It's also a national figure. Prices in a particular city can drift well away from the U.S. average over decades. And it is a different series from CPI-W, which drives Social Security cost-of-living adjustments, and from the chained CPI-U used to index federal tax brackets. Those series give slightly different answers for the same years.
Finally, the index measures what things cost, not how good they were. A 1980 car and a 2024 car aren't the same product. BLS adjusts for some quality changes, but comparisons across many decades are always rough.
Run your own conversion
Use the historical inflation calculator to convert any amount between any two years from 1950 to 2024, in either direction. To project forward instead, at an inflation rate you choose, use the inflation calculator. And if you'd like to see what money grows to when it earns interest at the same time, the compound interest calculator shows the nominal and inflation-adjusted balances side by side. For the year-by-year inflation rates behind these conversions, see the US inflation rate by year.