What salary today matches an older salary after inflation?
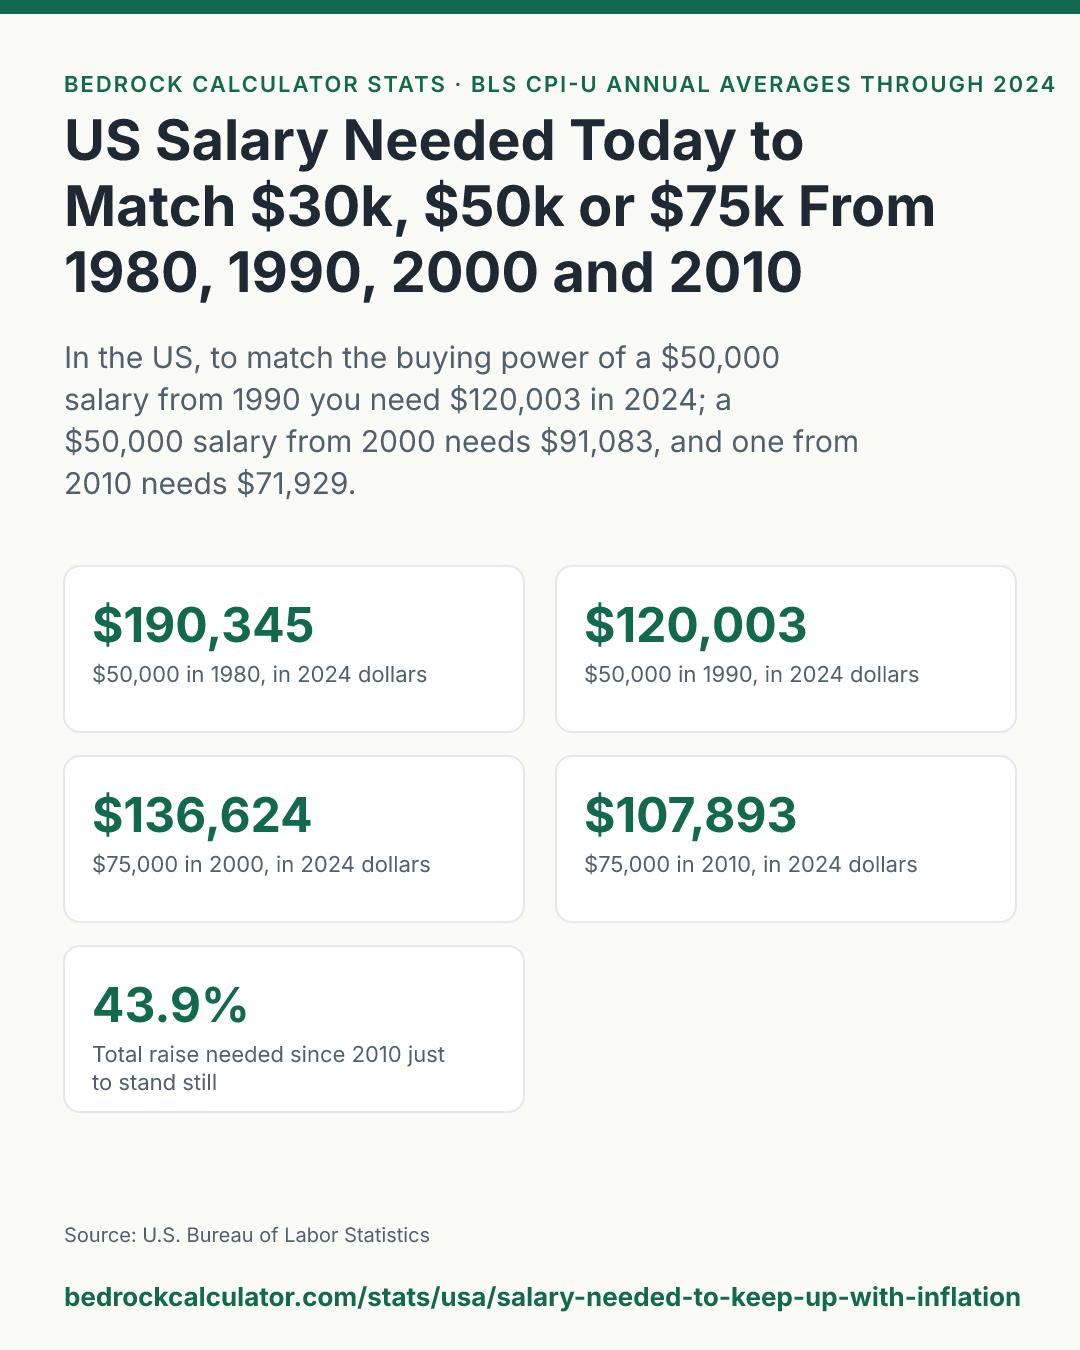
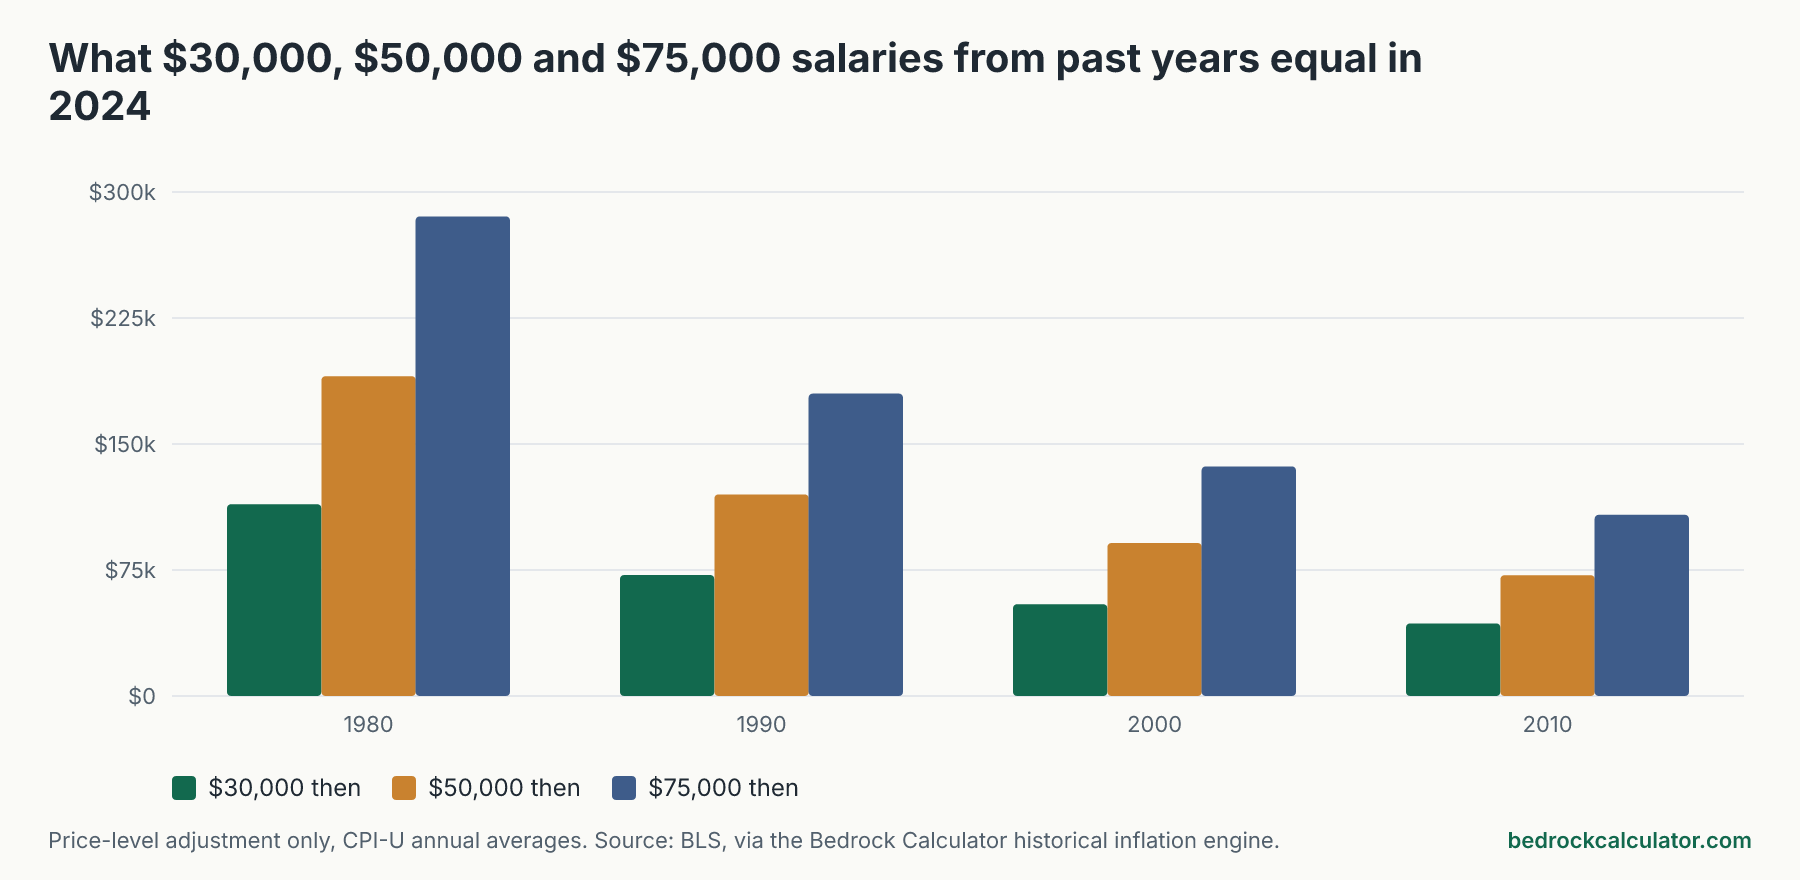
In the US, a $50,000 salary in 1990 had the same buying power as $120,003 in 2024. The same $50,000 from 2000 equals $91,083, and from 2010 it equals $71,929. Go back to 1980 and it's $190,345.
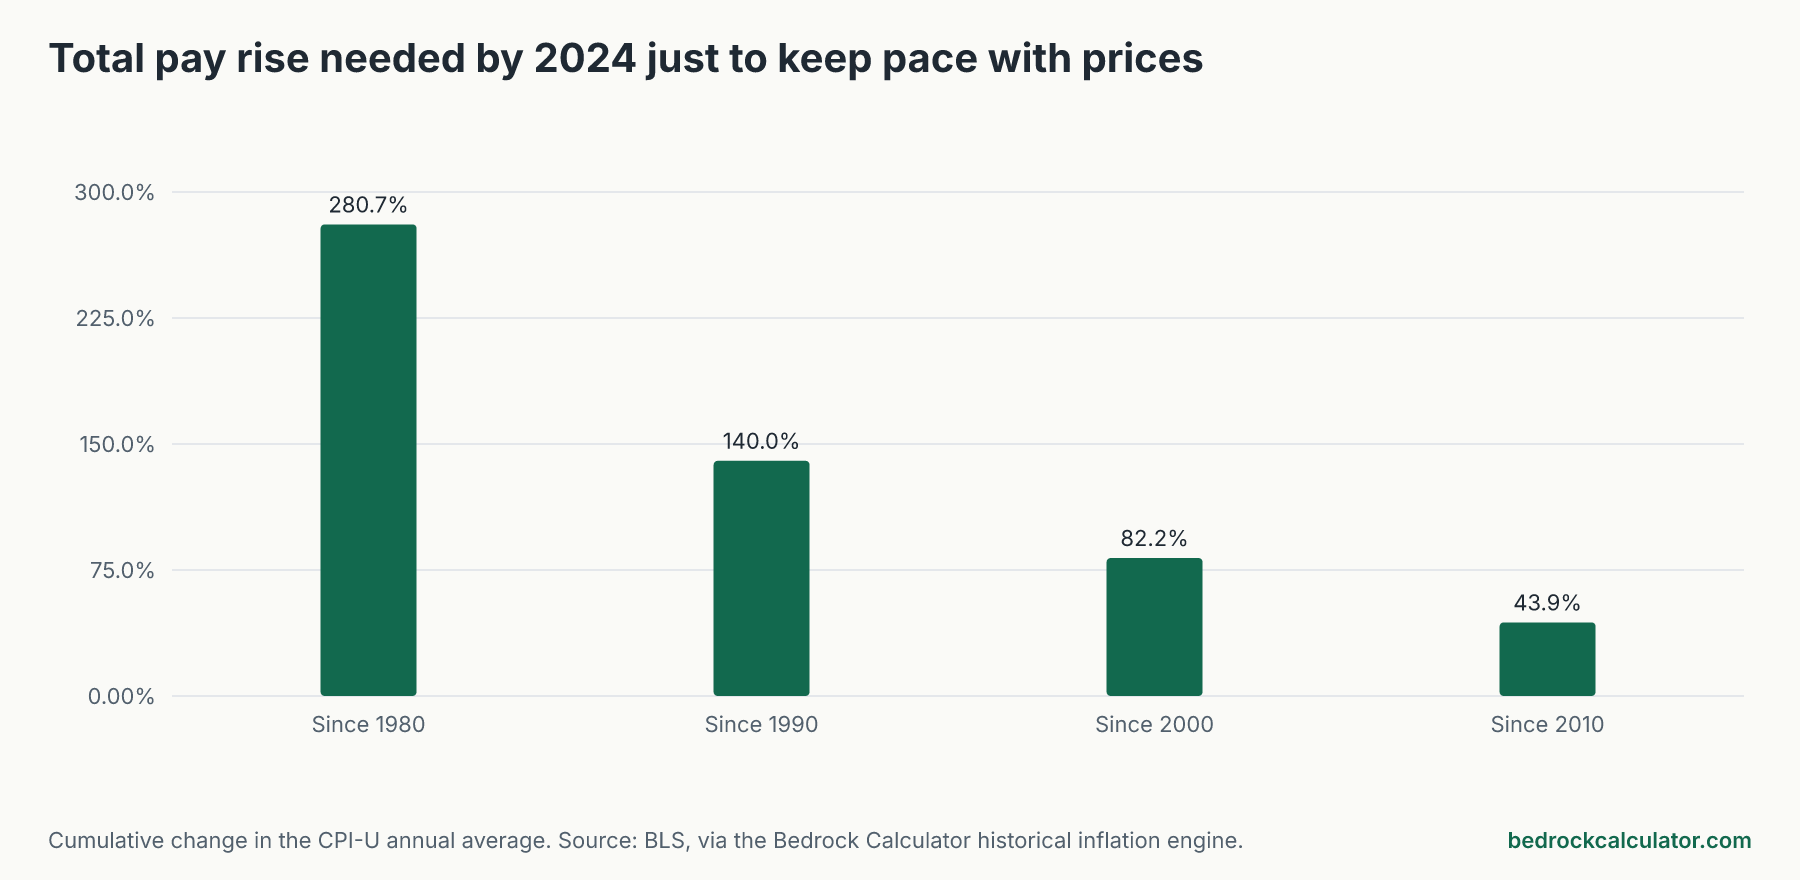
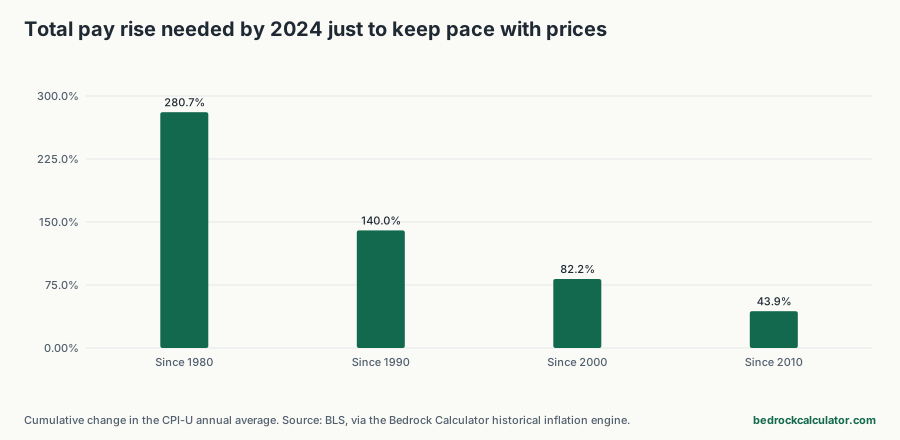
Put simply, if your pay rose less than 43.9% between 2010 and 2024, your paycheck buys less now than it did then, even if the number on it went up.
What this comparison measures, and what it doesn't
This is a price-level adjustment and nothing more. It answers one question for US prices: how many 2024 dollars buy the same basket of consumer goods and services that a salary bought in an earlier year?
It doesn't tell you whether people in that job earn more or less now, whether taxes took a bigger bite, or whether housing was easier to afford. Wages, taxes and home prices have all moved differently from consumer prices. We cover what this leaves out further down.
How we worked out these numbers
We ran the historical inflation calculator on this site for three salaries, $30,000, $50,000 and $75,000, from four starting years, 1980, 1990, 2000 and 2010, each converted to 2024 dollars.
The calculator multiplies the salary by the Consumer Price Index for All Urban Consumers (CPI-U) for 2024 and divides by the index for the starting year. It uses BLS annual averages, the same method behind the BLS inflation calculator. 2024 is the latest year with a complete official annual average, because BLS was unable to collect two months of 2025 prices during the federal shutdown. So "today" on this page means 2024. Prices have kept rising since, so a figure in current dollars would be a bit higher.
The full grid
Sort by any column. The last two columns don't depend on the salary: they show the total rise in prices since that year, and the steady annual raise that would have exactly kept up.
Salary needed in 2024 to match the buying power of an earlier salary
Download CSVPrice-level adjustment only: salary times CPI-U for 2024 divided by CPI-U for the starting year.
| 1980 | $114,207 | $190,345 | $285,518 | 280.7% | 3.08% |
| 1990 | $72,002 | $120,003 | $180,005 | 140.0% | 2.61% |
| 2000 | $54,650 | $91,083 | $136,624 | 82.2% | 2.53% |
| 2010 | $43,157 | $71,929 | $107,893 | 43.9% | 2.63% |
Reading the table: a raise is not the same as a real raise
Look at the last column first. To keep pace with prices you needed a raise of about 2.63% a year since 2010, 2.53% a year since 2000, and 2.61% a year since 1990. Those small-sounding numbers add up:
- Since 2010, prices rose 43.9%. A $50,000 salary needed to grow by $21,929 just to stand still.
- Since 2000, prices rose 82.2%, so $50,000 needed another $41,083.
- Since 1990, prices rose 140.0%. That $50,000 salary needed to reach $120,003, more than double.
If you've been in the same job since 2010 and your raises averaged less than 2.63% a year, you fell behind. Much of that price rise came in a short burst in the early 2020s, so even a long run of steady raises could be overtaken in two or three years. Our page on the US inflation rate by year shows exactly when.
Looking at it from today backward
Sometimes it helps to flip the question. What was a 2024 salary worth in an earlier year's money?
- $50,000 in 2024 buys what $20,833 bought in 1990.
- $75,000 in 2024 buys what $41,171 bought in 2000.
So if a relative tells you they earned about $20,833 in 1990, that was roughly the same standard of consumer spending as $50,000 now.
What this leaves out
Taxes. Federal brackets, the standard deduction and payroll tax rates have changed many times since 1980. Two salaries with the same buying power before tax can leave quite different take-home pay. If you want after-tax figures for today's salary, use the paycheck calculator.
Your own prices. CPI-U is a national average basket for urban consumers. If a big part of your budget is rent, health care, child care or tuition, those have often risen faster than the overall index, and you needed more than these figures to keep up. If you live somewhere prices rose less than average, you needed less.
Wage growth. Keeping up with prices isn't the same as keeping up with other workers. Wages and prices don't move in step, so a salary that only matched inflation may sit above or below what the same job pays now. This page doesn't measure that.
Housing. The index counts housing through rent and an estimate of what owners would pay to rent their own homes. It doesn't track home purchase prices or mortgage rates directly, which is why buying a house can feel much harder than these numbers suggest.
Who should use these numbers
- Anyone negotiating a raise. If your pay hasn't grown by at least the "total raise needed" figure since you started, you can show that your real pay has fallen.
- People comparing an old offer letter or pay stub. Multiply by the ratio for that year to see what it means now.
- Retirees on fixed pensions. A pension that doesn't adjust for inflation loses buying power at exactly these rates.
Run your own numbers
Use the historical inflation calculator to convert your own past salary from any year back to 2024. To see what a raise does to your take-home pay after tax, try the salary raise calculator. For a forward view of what you'll need in 10 or 20 years at an inflation rate you choose, the inflation calculator does that. And for every year's conversion factor in one place, see what a dollar from every year since 1950 is worth today.