Does your savings rate beat US inflation?
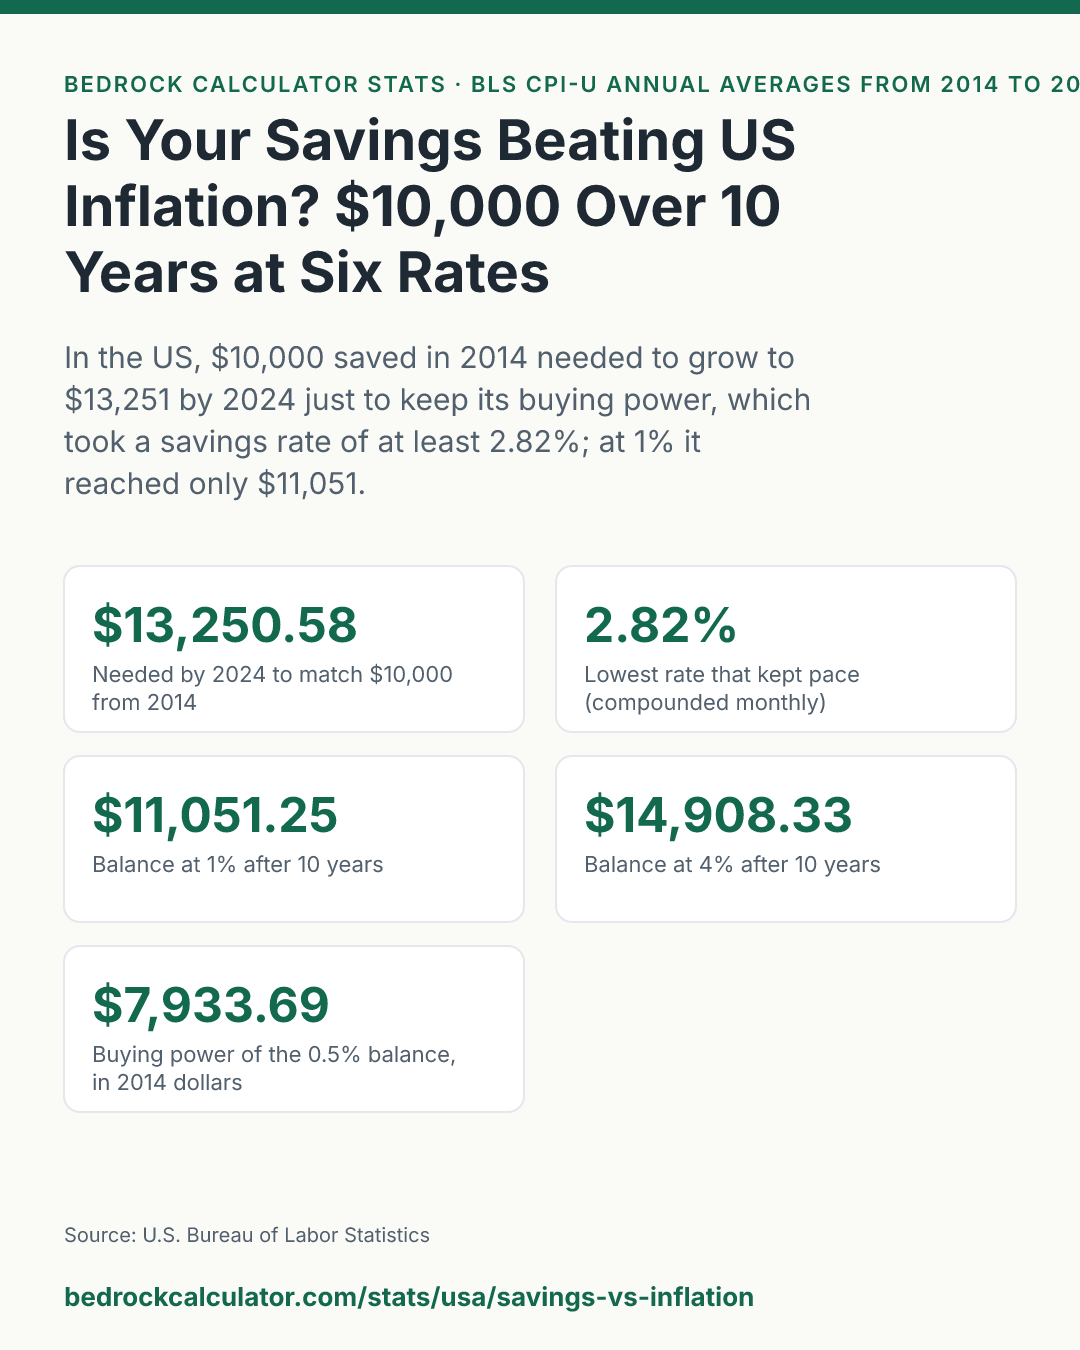
Against US consumer prices, to keep the same buying power, $10,000 put away in 2014 had to grow to $13,250.58 by 2024. That took an interest rate of at least 2.82%, compounded monthly, every year for the whole decade.
Of the six rates we tested, 3 kept pace and 3 fell behind. At 1%, the balance grew to $11,051.25, which looks like a gain but left the saver $2,199.33 short of where prices went.
How we worked out these numbers
There are two halves to this comparison, and each comes from a calculator on this site.
The savings side uses the compound interest calculator. We put in $10,000, no further deposits, interest compounded monthly, for ten years, at six rates: 0.5%, 1%, 2%, 3%, 4% and 5%. These rates are inputs we chose to cover the range from a typical big-bank savings account to a strong high-yield account or CD. They are not the rates banks actually paid in each of those years, which moved around a lot.
The inflation side uses the historical inflation calculator. It scales $10,000 by the rise in the Consumer Price Index for All Urban Consumers (CPI-U) from the 2014 annual average to the 2024 annual average. That's the official measure from the Bureau of Labor Statistics, and 2024 is the latest full year in our table.
The "lowest rate that kept pace" comes from running the compound interest engine at every rate in steps of a hundredth of a point, starting from zero, and stopping at the first one whose ten-year balance reached $13,250.58.
All six rates, side by side
$10,000 saved from 2014 to 2024 at different interest rates
Download CSVInterest compounded monthly, no deposits or withdrawals, before tax. "Needed" is $10,000 adjusted by CPI-U from 2014 to 2024.
| 0.5% | $10,512.60 | $13,250.58 | -$2,737.98 | $7,933.69 |
| 1% | $11,051.25 | $13,250.58 | -$2,199.33 | $8,340.20 |
| 2% | $12,211.99 | $13,250.58 | -$1,038.59 | $9,216.19 |
| 3% | $13,493.54 | $13,250.58 | $242.96 | $10,183.36 |
| 4% | $14,908.33 | $13,250.58 | $1,657.75 | $11,251.07 |
| 5% | $16,470.09 | $13,250.58 | $3,219.51 | $12,429.71 |
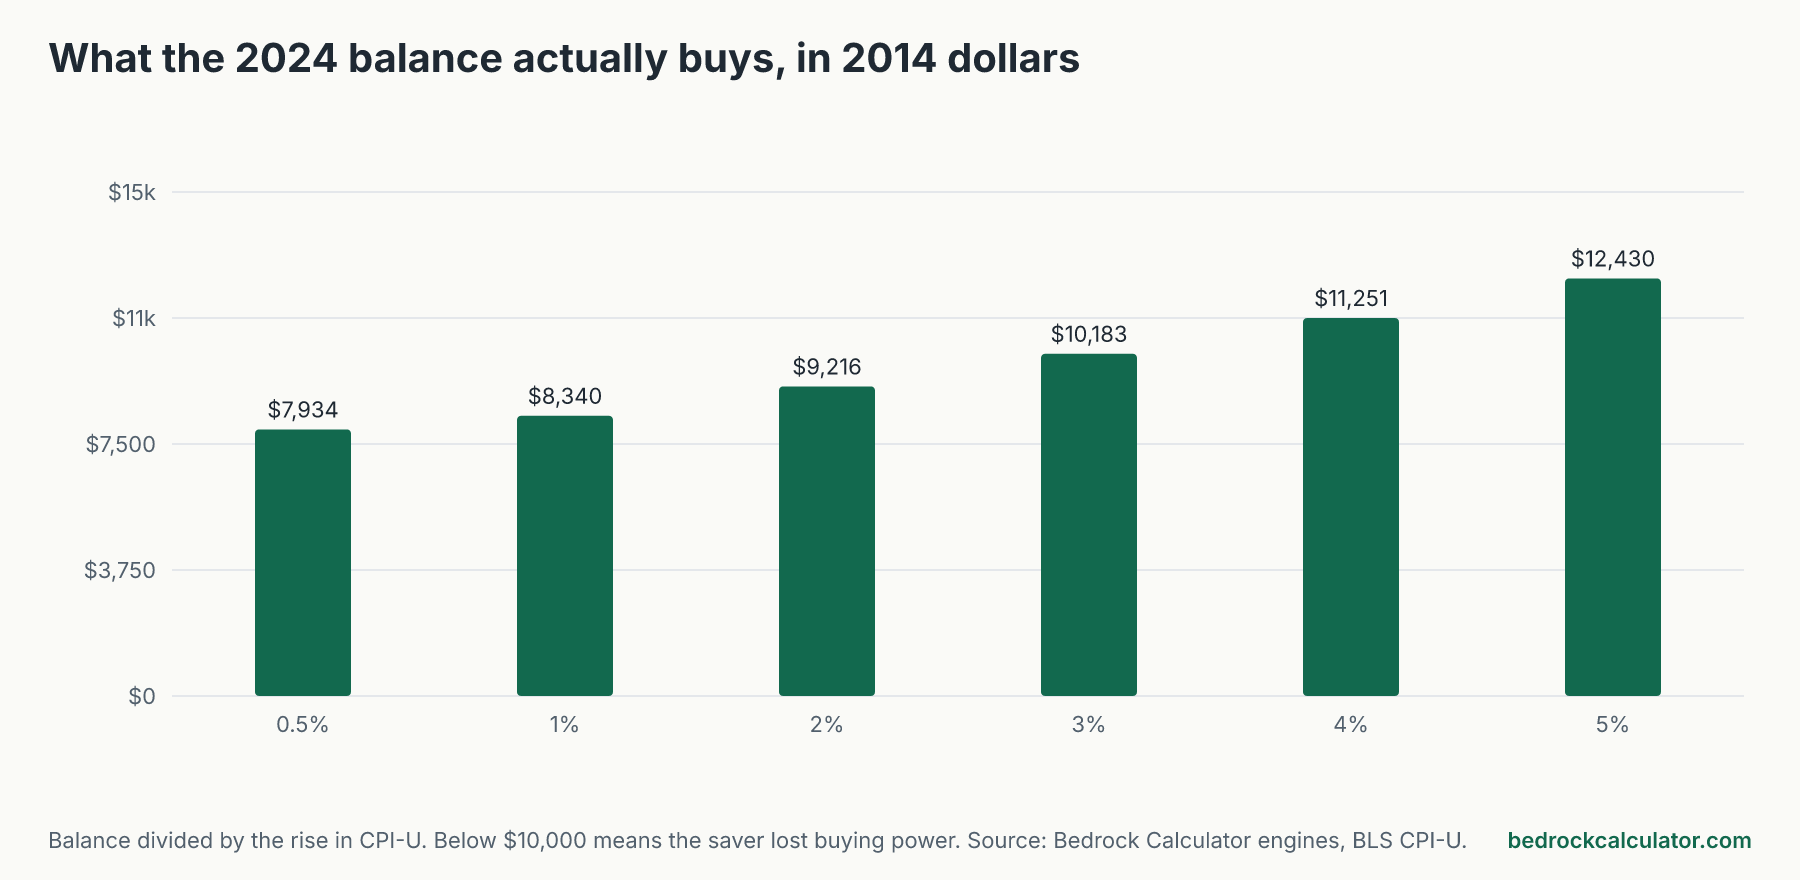
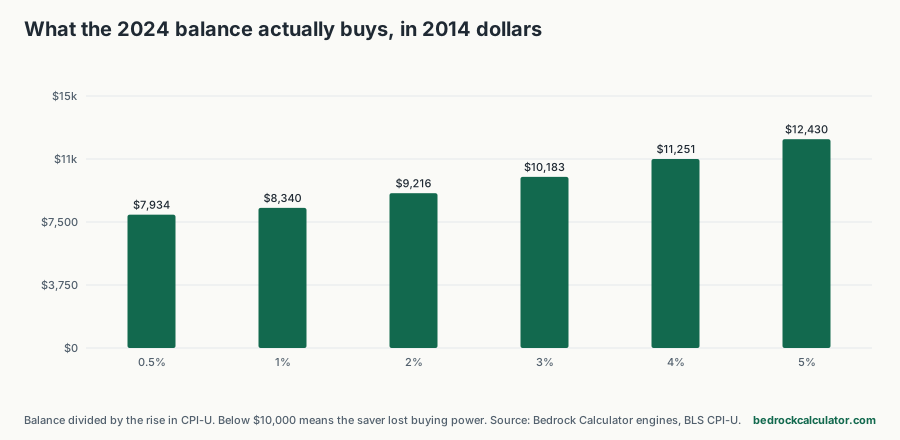
The last column is the most honest one. It converts each 2024 balance back into 2014 dollars, so you can see what it really buys. Anything under $10,000 means the money lost buying power while it sat in the bank.
Why the low rates lost ground
At 0.5%, the balance grew to $10,512.60. That's real interest, and the statement shows a gain. But prices rose faster, so in 2014 dollars the account is worth only $7,933.69. The saver gave up about a fifth of their buying power while technically never losing a cent.
At 2% the gap narrows, to $1,038.59, but it's still a loss in real terms. You needed to clear 2.82% for the decade before you got ahead.
Inflation didn't rise evenly
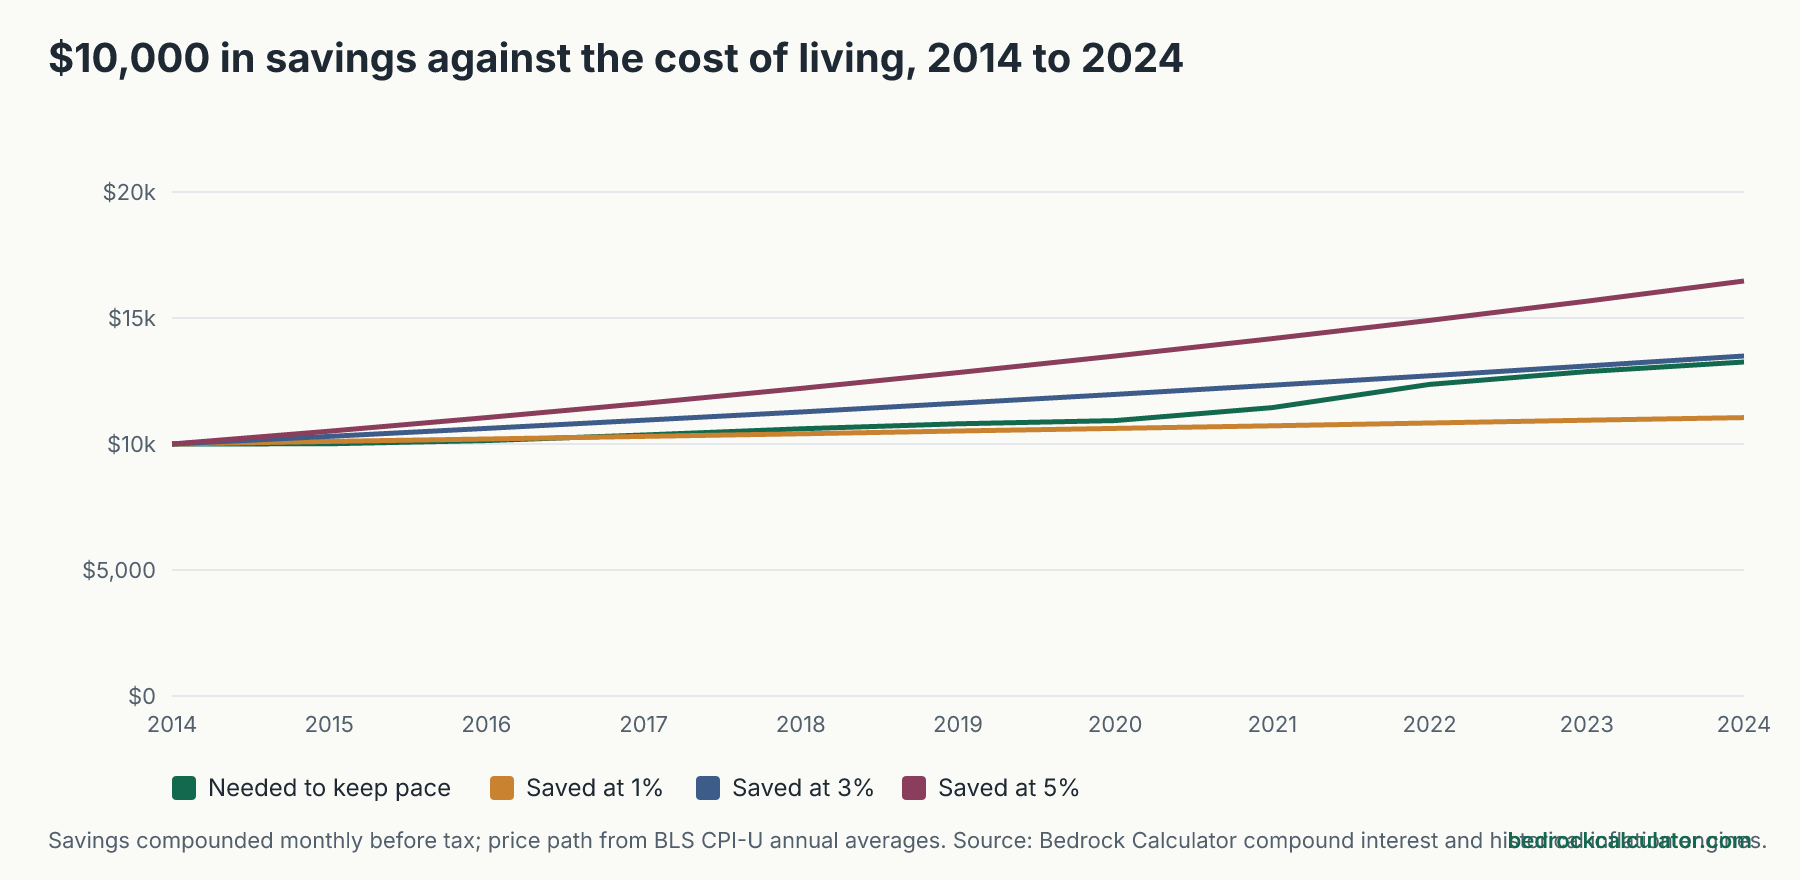
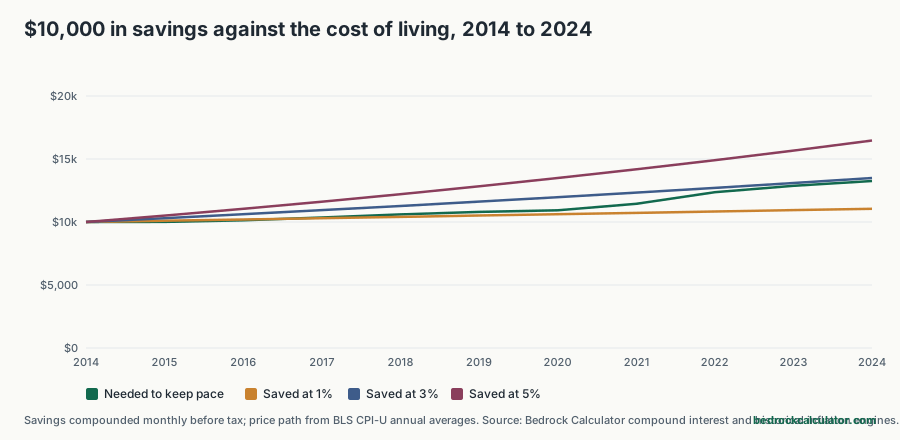
The chart shows something the ten-year totals hide. For the first six years, prices crept up slowly. By 2020, $10,000 only needed to have grown to $10,932.47 to keep pace, and even the 1% account at $10,618.10 wasn't far behind. A 3% saver was $1,037.01 ahead.
Then prices jumped in 2021 and 2022. By 2024 the 3% saver's lead had shrunk to $242.96. If you'd judged your savings in 2020, you'd have felt comfortable. Two years of fast inflation undid most of that cushion. Our page on the US inflation rate by year shows the spike in detail.
What the rates above 2.82% bought
At 4%, $10,000 grew to $14,908.33, beating prices by $1,657.75. At 5% it reached $16,470.09, $3,219.51 ahead. Those are genuine real gains, though modest ones: in 2014 dollars the 5% account is worth $12,429.71.
So holding cash in a high-yield account can do more than tread water, but only if the rate stays above inflation year after year. A rate that's high for two years and low for eight won't average out to the figures above.
What this leaves out
- Tax on the interest. Interest from savings accounts and CDs is taxed as ordinary income, so the rate you keep is lower than the rate you're paid. After tax, you'd need a stated rate comfortably above 2.82% to keep pace. Every figure here is before tax, which flatters the 3% line in particular.
- Changing rates. Real savings and CD rates rose and fell over the decade. Each line here holds one rate for all ten years.
- Deposits and withdrawals. We assumed a single deposit left untouched.
- Your own inflation. CPI-U is a national average basket. If your biggest costs rose faster, you needed an even higher rate.
- Compounding details. We compounded monthly. Accounts that compound daily pay very slightly more at the same stated rate.
Run your own numbers
Try your own balance, rate and time frame in the compound interest calculator, or use the savings calculator if you add money every month. To check any past amount against prices, use the historical inflation calculator. If you're thinking about locking in a rate, the CD ladder calculator shows how to spread money across several maturities so it isn't all stuck at one rate.