What was the US inflation rate in each year?
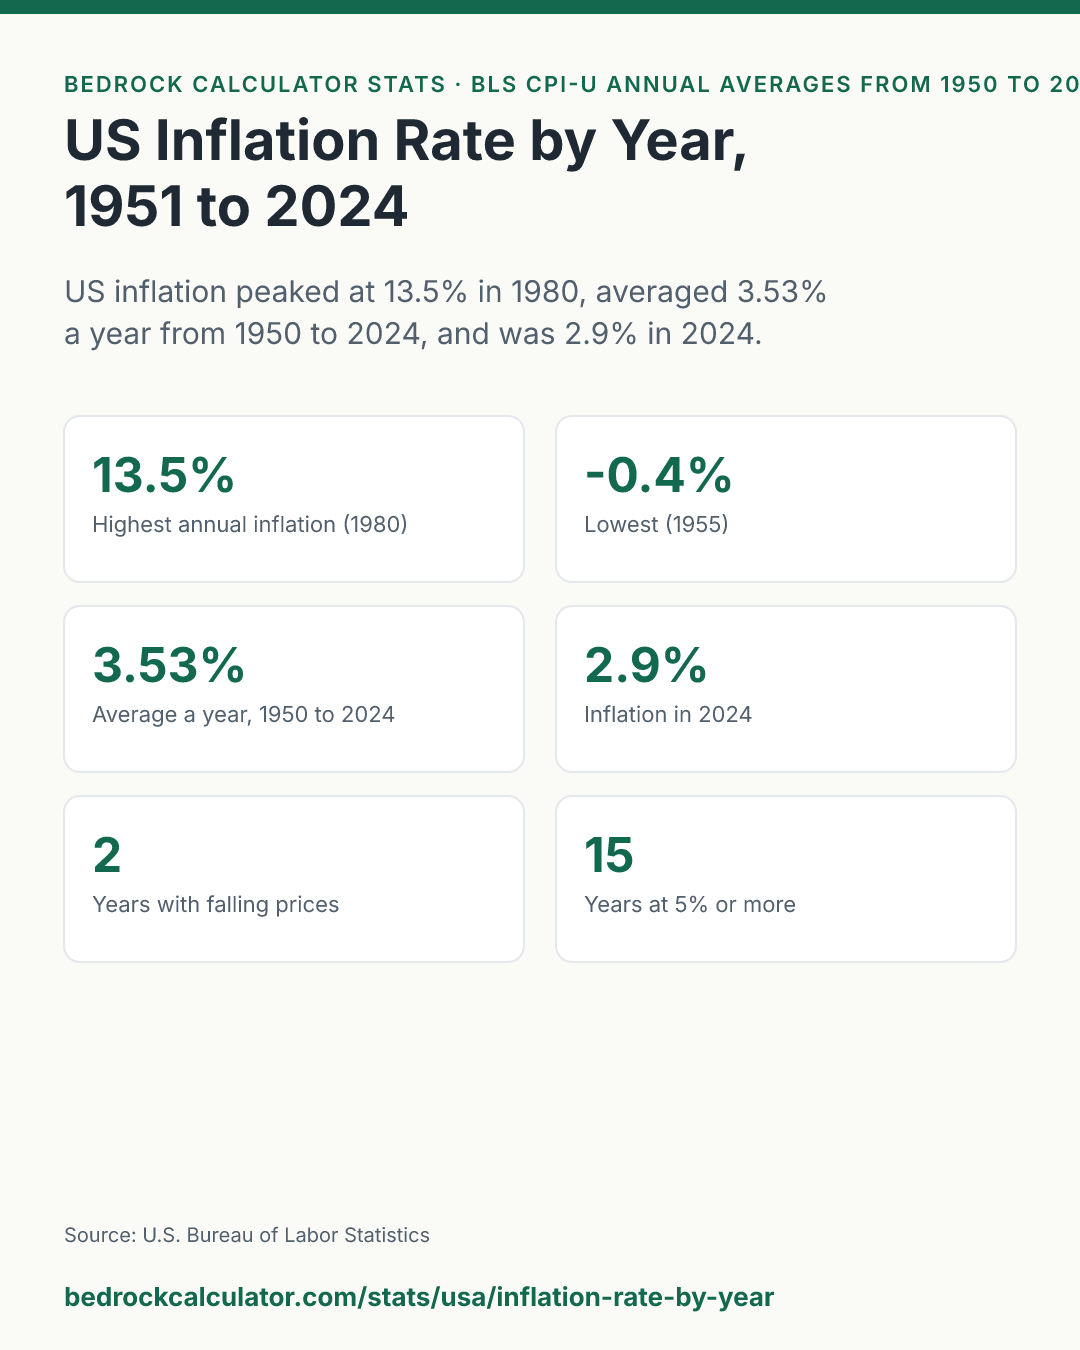
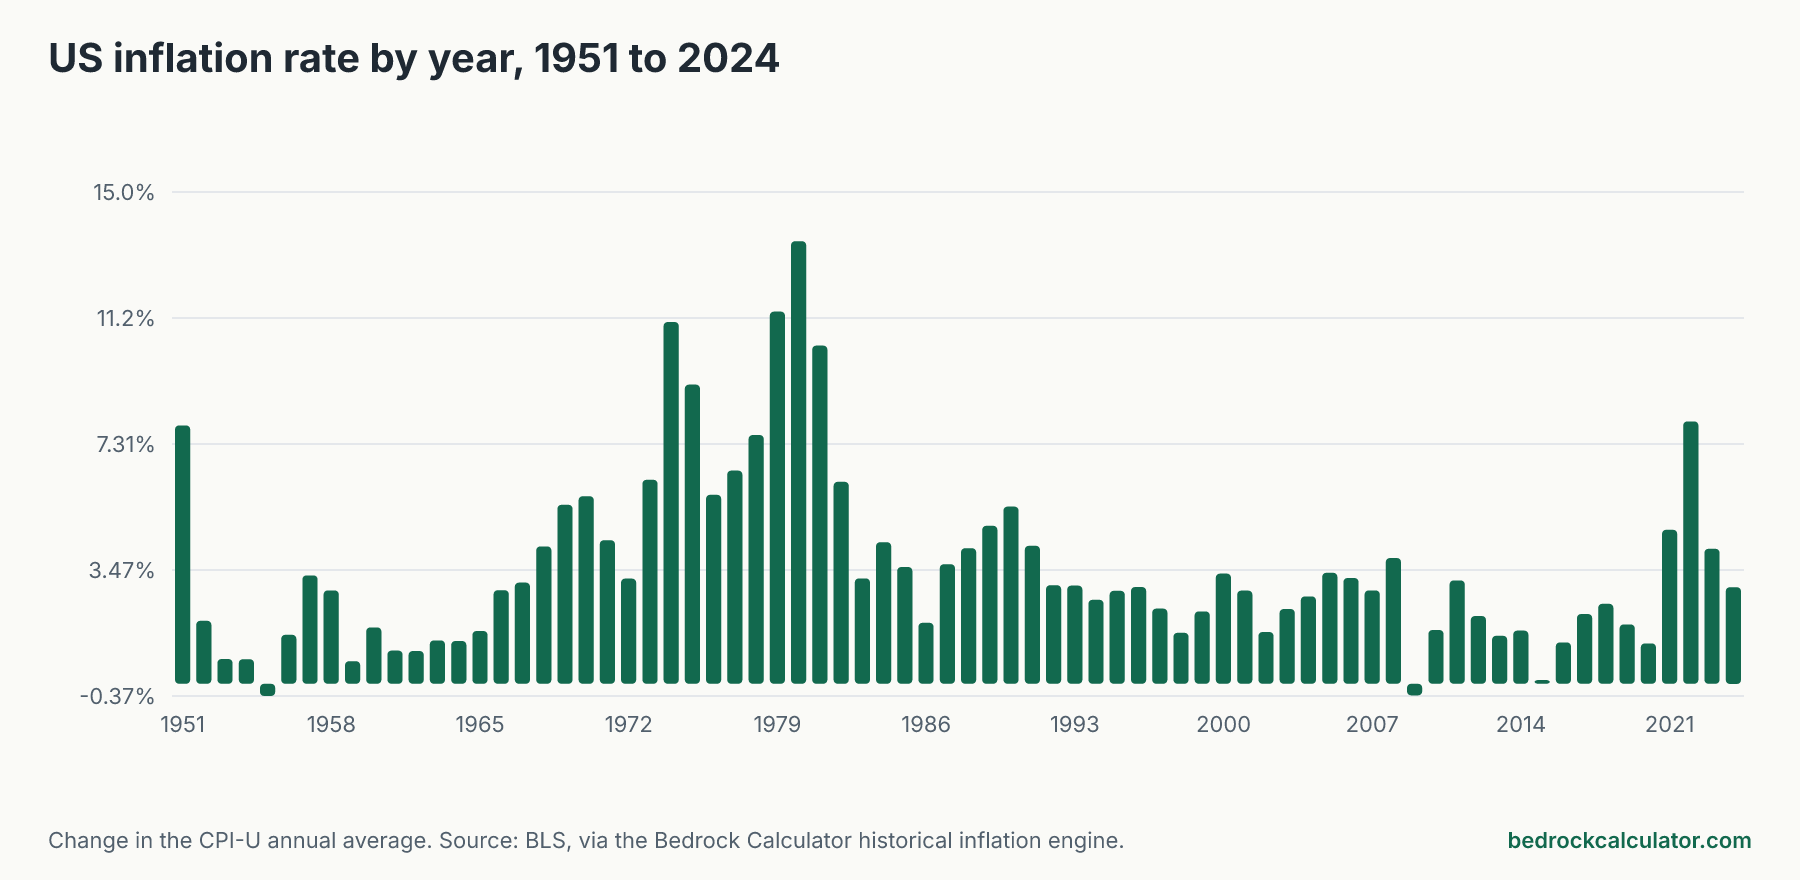
US inflation has averaged 3.53% a year since 1950, but almost never sat near that average for long. It peaked at 13.5% in 1980, turned slightly negative in 2 years, and came in at 2.9% in 2024, the latest full year of official data.
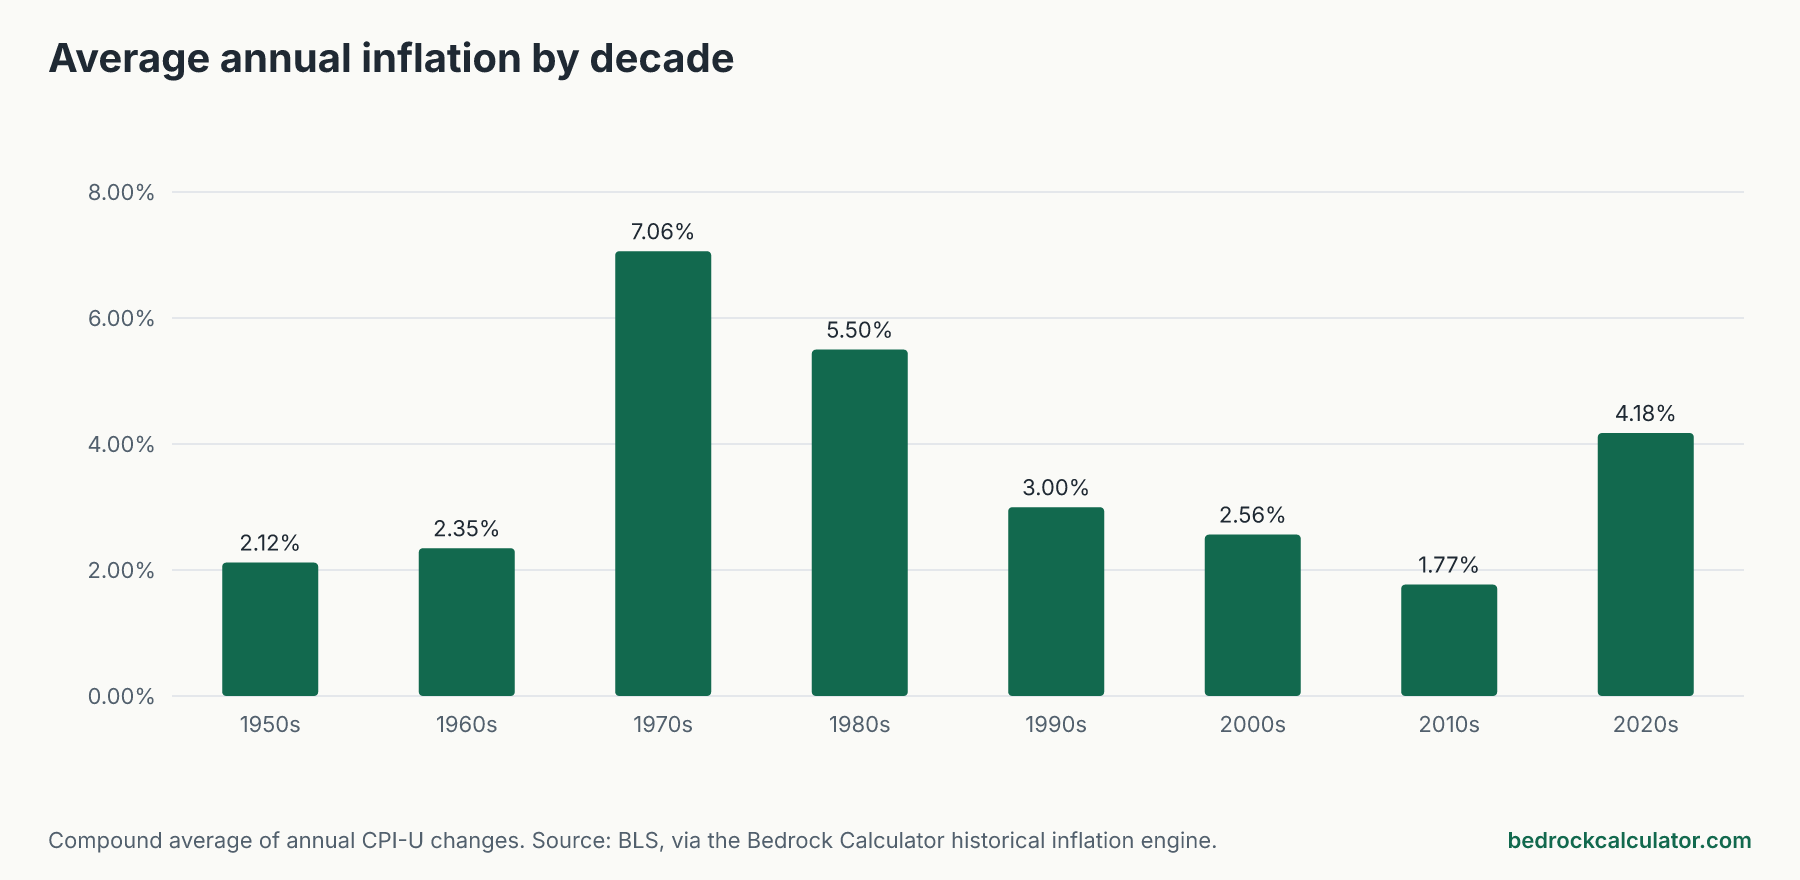
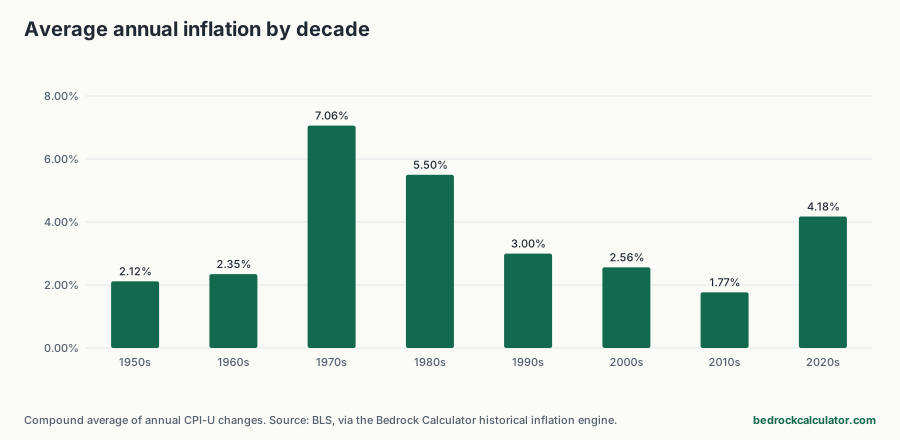
The 1970s were the worst decade by far, averaging 7.06% a year. The 2010s were the calmest, at 1.77%.
How we measured inflation for each year
Each rate on this page is the percent change in the Consumer Price Index for All Urban Consumers (CPI-U) from one year's annual average to the next. That's the series BLS calls the headline CPI, for the U.S. city average and all items. We took the annual averages from the BLS historical table and ran each pair of years through the same conversion the historical inflation calculator uses.
Two things to know before you compare these with other sources:
- These are annual-average changes. News reports often quote the December-to-December change, or the change over the latest 12 months. Those can differ noticeably from the annual-average figure in the same year, especially when inflation is speeding up or slowing down.
- The series starts in 1951. Our table begins with the 1950 index, so 1950 has no earlier year to compare against here. The last year is 2024, because the 2025 annual average was never finalized after BLS missed two months of price collection during the federal shutdown.
Every year since 1951
Click a column heading to sort by the highest or lowest inflation. The index column lets you check any figure yourself: divide one year's index by the year before and subtract one.
US inflation rate by year, 1951 to 2024
Download CSVPercent change in the CPI-U annual average from the year before. U.S. city average, all items, not seasonally adjusted.
| 2024 | 2.9% | 313.689 |
| 2023 | 4.1% | 304.702 |
| 2022 | 8.0% | 292.655 |
| 2021 | 4.7% | 270.97 |
| 2020 | 1.2% | 258.811 |
| 2019 | 1.8% | 255.657 |
| 2018 | 2.4% | 251.107 |
| 2017 | 2.1% | 245.12 |
| 2016 | 1.3% | 240.007 |
| 2015 | 0.1% | 237.017 |
| 2014 | 1.6% | 236.736 |
| 2013 | 1.5% | 232.957 |
| 2012 | 2.1% | 229.594 |
| 2011 | 3.2% | 224.939 |
| 2010 | 1.6% | 218.056 |
| 2009 | -0.4% | 214.537 |
| 2008 | 3.8% | 215.303 |
| 2007 | 2.8% | 207.342 |
| 2006 | 3.2% | 201.6 |
| 2005 | 3.4% | 195.3 |
| 2004 | 2.7% | 188.9 |
| 2003 | 2.3% | 184 |
| 2002 | 1.6% | 179.9 |
| 2001 | 2.8% | 177.1 |
| 2000 | 3.4% | 172.2 |
| 1999 | 2.2% | 166.6 |
| 1998 | 1.6% | 163 |
| 1997 | 2.3% | 160.5 |
| 1996 | 3.0% | 156.9 |
| 1995 | 2.8% | 152.4 |
| 1994 | 2.6% | 148.2 |
| 1993 | 3.0% | 144.5 |
| 1992 | 3.0% | 140.3 |
| 1991 | 4.2% | 136.2 |
| 1990 | 5.4% | 130.7 |
| 1989 | 4.8% | 124 |
| 1988 | 4.1% | 118.3 |
| 1987 | 3.6% | 113.6 |
| 1986 | 1.9% | 109.6 |
| 1985 | 3.6% | 107.6 |
| 1984 | 4.3% | 103.9 |
| 1983 | 3.2% | 99.6 |
| 1982 | 6.2% | 96.5 |
| 1981 | 10.3% | 90.9 |
| 1980 | 13.5% | 82.4 |
| 1979 | 11.3% | 72.6 |
| 1978 | 7.6% | 65.2 |
| 1977 | 6.5% | 60.6 |
| 1976 | 5.8% | 56.9 |
| 1975 | 9.1% | 53.8 |
| 1974 | 11.0% | 49.3 |
| 1973 | 6.2% | 44.4 |
| 1972 | 3.2% | 41.8 |
| 1971 | 4.4% | 40.5 |
| 1970 | 5.7% | 38.8 |
| 1969 | 5.5% | 36.7 |
| 1968 | 4.2% | 34.8 |
| 1967 | 3.1% | 33.4 |
| 1966 | 2.9% | 32.4 |
| 1965 | 1.6% | 31.5 |
| 1964 | 1.3% | 31 |
| 1963 | 1.3% | 30.6 |
| 1962 | 1.0% | 30.2 |
| 1961 | 1.0% | 29.9 |
| 1960 | 1.7% | 29.6 |
| 1959 | 0.7% | 29.1 |
| 1958 | 2.8% | 28.9 |
| 1957 | 3.3% | 28.1 |
| 1956 | 1.5% | 27.2 |
| 1955 | -0.4% | 26.8 |
| 1954 | 0.7% | 26.9 |
| 1953 | 0.8% | 26.7 |
| 1952 | 1.9% | 26.5 |
| 1951 | 7.9% | 26 |
The peaks: the 1970s and early 1980s
The five highest years were 1980 (13.5%), 1979 (11.3%), 1974 (11.0%), 1981 (10.3%), 1975 (9.1%). All of them fall in a single stretch of about seven years, driven by two oil price shocks and a long period of loose monetary policy. Inflation only came down after the Federal Reserve pushed interest rates to record highs. By 1983 the annual rate was back to 3.2%.
If you were taking out a mortgage or saving for retirement then, that matters. Prices roughly doubled over that decade, so a fixed income lost close to half its buying power in ten years.
The quiet years, and the 2 with falling prices
At the other end, 21 of the 74 years came in between zero and 2%. Prices fell on an annual-average basis in only 2 years: 1955, 2009. In 2009 the drop was -0.4%, mostly because energy prices collapsed after the financial crisis. It was a one-year dip, not a lasting fall.
Compare that with 15 years at 5% or more. For American savers, rising prices have been the real risk, not falling ones.
Decade by decade
Averaging by decade smooths out single-year spikes and shows the long swings. The 1990s averaged 3.00% and the 2010s 1.77%. The 2020s so far are running at 4.18% a year, pulled up by 4.7% in 2021 and 8.0% in 2022, the highest annual rate since 1981.
Average annual inflation by decade
Download CSVCompound average of the annual changes in each decade. The 1950s start from 1950 and the 2020s run to the latest full year.
| 1950s | 1950 to 1959 | 2.12% |
| 1960s | 1959 to 1969 | 2.35% |
| 1970s | 1969 to 1979 | 7.06% |
| 1980s | 1979 to 1989 | 5.50% |
| 1990s | 1989 to 1999 | 3.00% |
| 2000s | 1999 to 2009 | 2.56% |
| 2010s | 2009 to 2019 | 1.77% |
| 2020s | 2019 to 2024 | 4.18% |
Each decade is measured from the last year of the decade before, so it captures ten annual changes. The 1950s start from 1950 because that is where our table begins, and the 2020s run only to 2024.
What a long-run average of 3.53% means for you
A 3.53% average sounds small, but compounding makes it large. Over the 74 years in this table, prices rose more than thirteenfold, which is why a dollar from 1950 is now worth so much more. Our page on what a dollar from every year is worth today turns these rates into dollar figures.
For planning, a long-run average is a reasonable starting assumption, but the table shows how far a single decade can stray from it. Since 2000 the average has been 2.53%. If you're projecting costs 20 or 30 years out, it's worth running more than one rate. The inflation calculator lets you choose your own forward rate and shows what today's prices would cost later.
What these rates leave out
CPI-U is an average across a national basket of goods and services bought by urban households. It is not your personal inflation rate. Rent, health care, child care and tuition have often risen faster than the overall index, and electronics and clothing slower, so your own costs depend on what you buy.
It is also a different series from CPI-W, which sets Social Security cost-of-living adjustments, and from the chained CPI-U used for federal tax bracket indexing. Those can differ by a few tenths of a point in a given year. And because these are annual averages of a not seasonally adjusted index, they won't match monthly figures you might see quoted.
Use the rates in your own numbers
- Convert any sum between two years with the historical inflation calculator.
- Project future costs at a rate you choose with the inflation calculator.
- See whether a savings rate kept pace with these numbers on our page about savings versus inflation, or grow your own balance with the compound interest calculator.