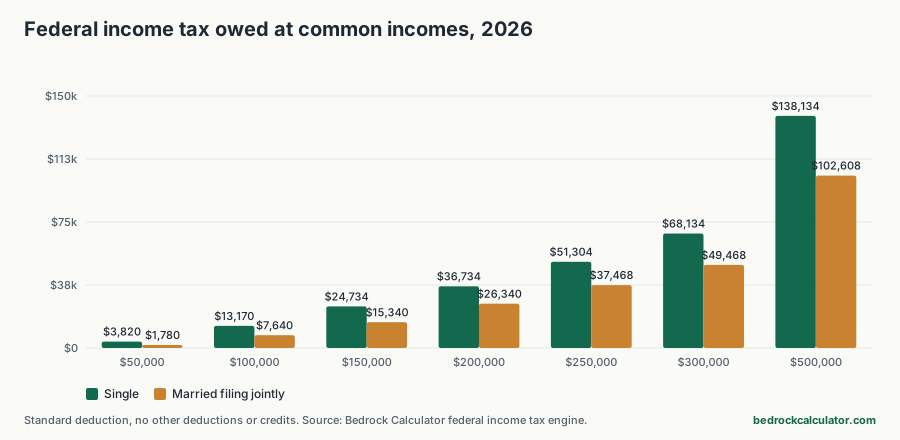
How much US federal income tax do you pay at each income in 2026?
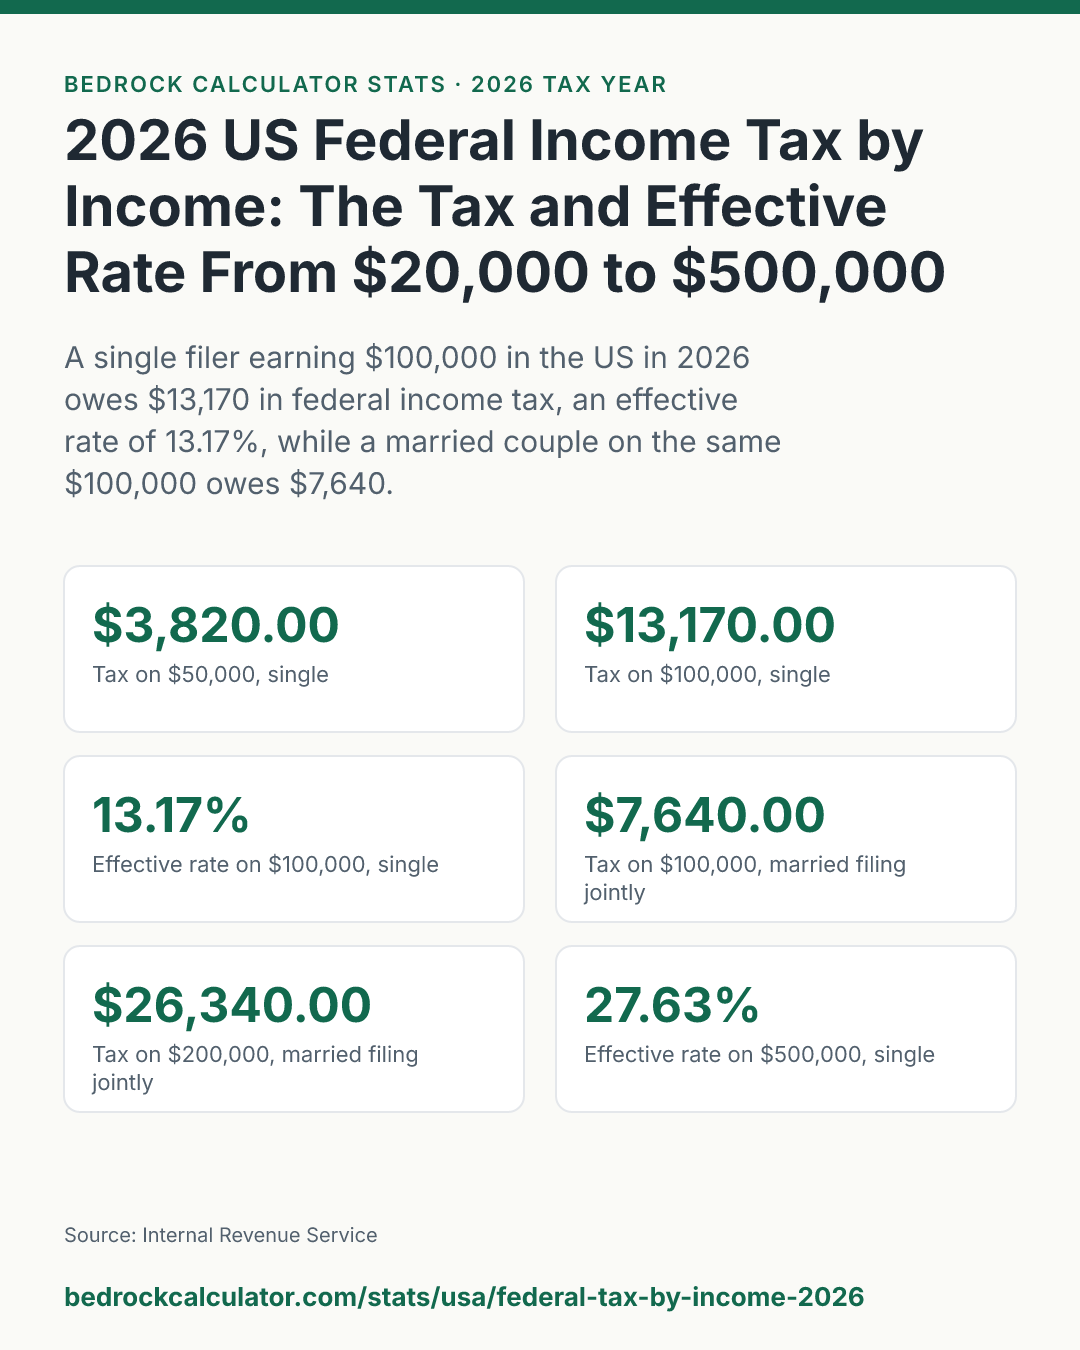
A single filer earning $100,000 in the US in 2026 owes $13,170.00 in federal income tax to the IRS. That's 13.17% of their income, even though their top dollar is taxed at 22%. A married couple filing jointly on the same $100,000 owes $7,640.00, or 7.64%.
At $50,000 a single filer owes $3,820.00, about $318.33 a month. At $500,000 the bill is $138,134.25 single and $102,608.00 joint.
How we worked out these numbers
We ran the federal income tax calculator on this site 49 times for each filing status, once at every $10,000 step from $20,000 to $500,000, and recorded what it returned. Nothing here is estimated or rounded to a bracket midpoint.
Every run uses the same simple setup:
- Gross income from wages or other ordinary income, nothing else
- The 2026 standard deduction: $16,100 for single filers and $32,200 for married couples filing jointly
- No 401(k), HSA or other pre-tax deductions, and no tax credits
- The seven 2026 brackets from IRS Revenue Procedure 2025-32
The effective rate in the table is the tax divided by gross income, not taxable income, because that's the share of your pay that actually goes to federal income tax. The marginal rate is the bracket your last dollar of taxable income lands in.
What's left out: Social Security and Medicare (FICA), state and local income tax, itemized deductions, the Alternative Minimum Tax, the Additional Medicare Tax and the Net Investment Income Tax. Credits such as the Child Tax Credit or the Earned Income Tax Credit aren't applied either, so a family with children will usually owe less than these figures. Capital gains are taxed on a separate schedule and aren't part of this table.
Federal income tax at every $10,000 of income
Click a column heading to sort. Each row is a separate run of the calculator at that gross income.
2026 federal income tax at every $10,000 of income, single and married filing jointly
Download CSVGross income with the 2026 standard deduction and no other deductions or credits. Effective rate is tax divided by gross income. Marginal rate is the bracket the last dollar falls in.
| $20,000 | $390.00 | 1.95% | 10.0% | $0.00 | 0.00% | 0.0% |
| $30,000 | $1,420.00 | 4.73% | 12.0% | $0.00 | 0.00% | 0.0% |
| $40,000 | $2,620.00 | 6.55% | 12.0% | $780.00 | 1.95% | 10.0% |
| $50,000 | $3,820.00 | 7.64% | 12.0% | $1,780.00 | 3.56% | 10.0% |
| $60,000 | $5,020.00 | 8.37% | 12.0% | $2,840.00 | 4.73% | 12.0% |
| $70,000 | $6,570.00 | 9.39% | 22.0% | $4,040.00 | 5.77% | 12.0% |
| $80,000 | $8,770.00 | 10.96% | 22.0% | $5,240.00 | 6.55% | 12.0% |
| $90,000 | $10,970.00 | 12.19% | 22.0% | $6,440.00 | 7.16% | 12.0% |
| $100,000 | $13,170.00 | 13.17% | 22.0% | $7,640.00 | 7.64% | 12.0% |
| $110,000 | $15,370.00 | 13.97% | 22.0% | $8,840.00 | 8.04% | 12.0% |
| $120,000 | $17,570.00 | 14.64% | 22.0% | $10,040.00 | 8.37% | 12.0% |
| $130,000 | $19,934.00 | 15.33% | 24.0% | $11,240.00 | 8.65% | 12.0% |
| $140,000 | $22,334.00 | 15.95% | 24.0% | $13,140.00 | 9.39% | 22.0% |
| $150,000 | $24,734.00 | 16.49% | 24.0% | $15,340.00 | 10.23% | 22.0% |
| $160,000 | $27,134.00 | 16.96% | 24.0% | $17,540.00 | 10.96% | 22.0% |
| $170,000 | $29,534.00 | 17.37% | 24.0% | $19,740.00 | 11.61% | 22.0% |
| $180,000 | $31,934.00 | 17.74% | 24.0% | $21,940.00 | 12.19% | 22.0% |
| $190,000 | $34,334.00 | 18.07% | 24.0% | $24,140.00 | 12.71% | 22.0% |
| $200,000 | $36,734.00 | 18.37% | 24.0% | $26,340.00 | 13.17% | 22.0% |
| $210,000 | $39,134.00 | 18.64% | 24.0% | $28,540.00 | 13.59% | 22.0% |
| $220,000 | $41,704.00 | 18.96% | 32.0% | $30,740.00 | 13.97% | 22.0% |
| $230,000 | $44,904.00 | 19.52% | 32.0% | $32,940.00 | 14.32% | 22.0% |
| $240,000 | $48,104.00 | 20.04% | 32.0% | $35,140.00 | 14.64% | 22.0% |
| $250,000 | $51,304.00 | 20.52% | 32.0% | $37,468.00 | 14.99% | 24.0% |
| $260,000 | $54,504.00 | 20.96% | 32.0% | $39,868.00 | 15.33% | 24.0% |
| $270,000 | $57,704.00 | 21.37% | 32.0% | $42,268.00 | 15.65% | 24.0% |
| $280,000 | $61,134.25 | 21.83% | 35.0% | $44,668.00 | 15.95% | 24.0% |
| $290,000 | $64,634.25 | 22.29% | 35.0% | $47,068.00 | 16.23% | 24.0% |
| $300,000 | $68,134.25 | 22.71% | 35.0% | $49,468.00 | 16.49% | 24.0% |
| $310,000 | $71,634.25 | 23.11% | 35.0% | $51,868.00 | 16.73% | 24.0% |
| $320,000 | $75,134.25 | 23.48% | 35.0% | $54,268.00 | 16.96% | 24.0% |
| $330,000 | $78,634.25 | 23.83% | 35.0% | $56,668.00 | 17.17% | 24.0% |
| $340,000 | $82,134.25 | 24.16% | 35.0% | $59,068.00 | 17.37% | 24.0% |
| $350,000 | $85,634.25 | 24.47% | 35.0% | $61,468.00 | 17.56% | 24.0% |
| $360,000 | $89,134.25 | 24.76% | 35.0% | $63,868.00 | 17.74% | 24.0% |
| $370,000 | $92,634.25 | 25.04% | 35.0% | $66,268.00 | 17.91% | 24.0% |
| $380,000 | $96,134.25 | 25.30% | 35.0% | $68,668.00 | 18.07% | 24.0% |
| $390,000 | $99,634.25 | 25.55% | 35.0% | $71,068.00 | 18.22% | 24.0% |
| $400,000 | $103,134.25 | 25.78% | 35.0% | $73,468.00 | 18.37% | 24.0% |
| $410,000 | $106,634.25 | 26.01% | 35.0% | $75,868.00 | 18.50% | 24.0% |
| $420,000 | $110,134.25 | 26.22% | 35.0% | $78,268.00 | 18.64% | 24.0% |
| $430,000 | $113,634.25 | 26.43% | 35.0% | $80,668.00 | 18.76% | 24.0% |
| $440,000 | $117,134.25 | 26.62% | 35.0% | $83,408.00 | 18.96% | 32.0% |
| $450,000 | $120,634.25 | 26.81% | 35.0% | $86,608.00 | 19.25% | 32.0% |
| $460,000 | $124,134.25 | 26.99% | 35.0% | $89,808.00 | 19.52% | 32.0% |
| $470,000 | $127,634.25 | 27.16% | 35.0% | $93,008.00 | 19.79% | 32.0% |
| $480,000 | $131,134.25 | 27.32% | 35.0% | $96,208.00 | 20.04% | 32.0% |
| $490,000 | $134,634.25 | 27.48% | 35.0% | $99,408.00 | 20.29% | 32.0% |
| $500,000 | $138,134.25 | 27.63% | 35.0% | $102,608.00 | 20.52% | 32.0% |
A few rows are worth pointing out. A single filer on $20,000 owes $390.00, because only the slice above the standard deduction is taxed, and all of it at 10%. A married couple owes nothing at $20,000 or $30,000, since their $32,200 standard deduction covers the whole amount.
How much federal tax on $100,000, $150,000 and $200,000 in 2026
These are the incomes people search for most, so here they are side by side.
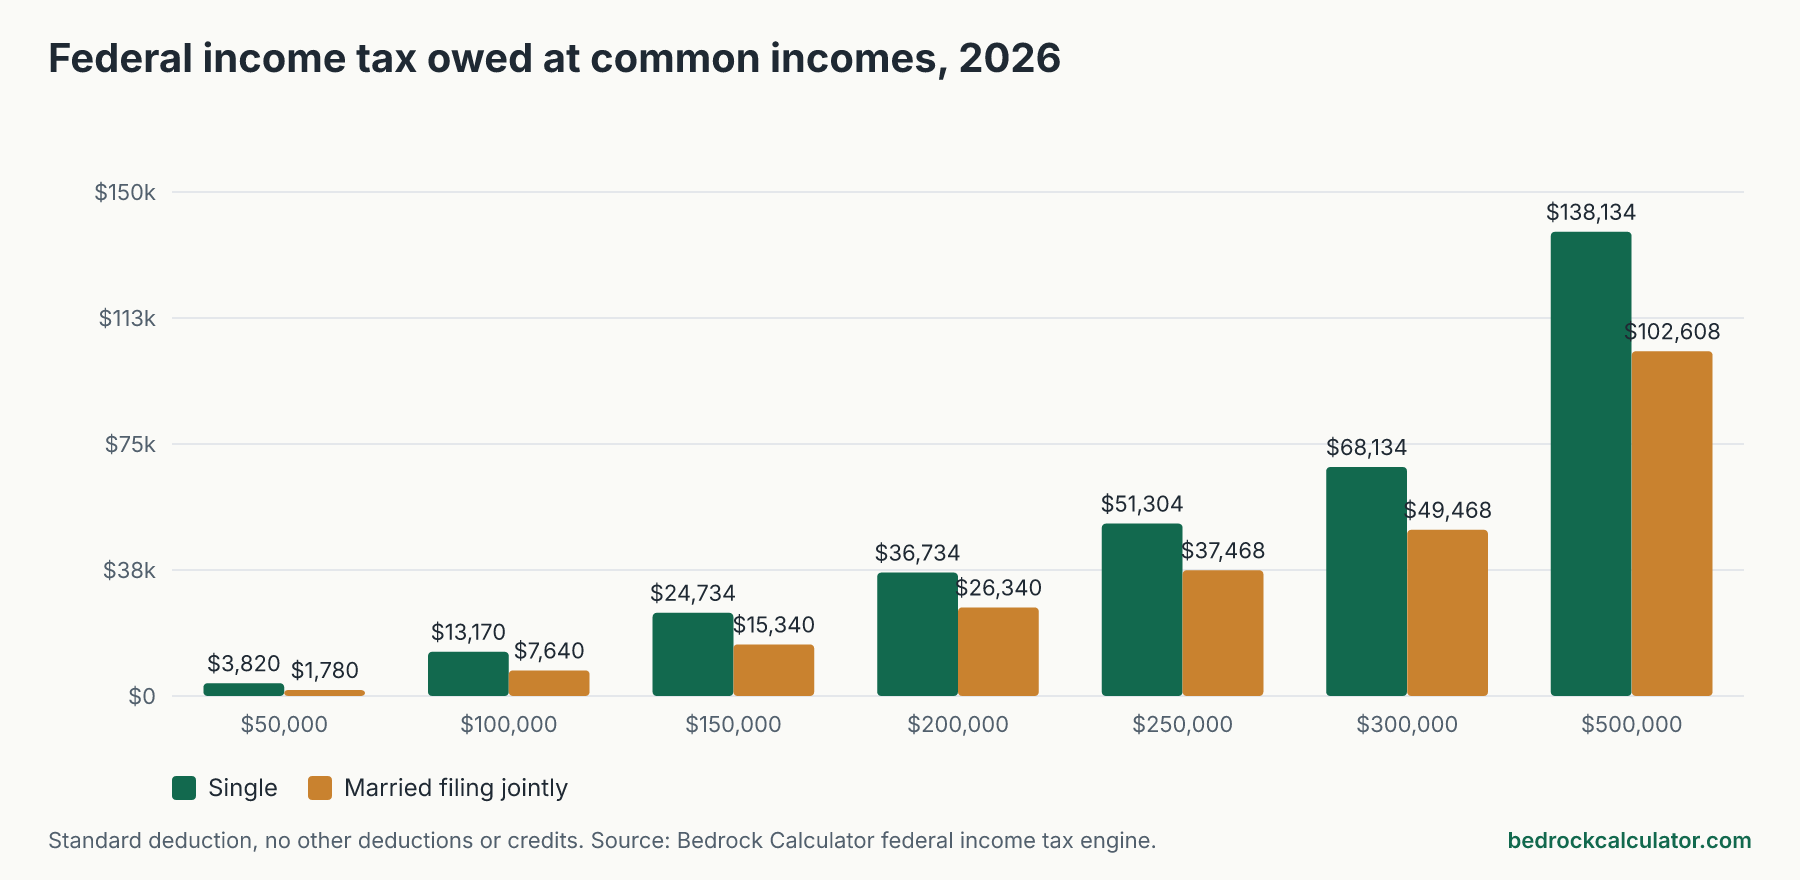
- $100,000: $13,170.00 single (13.17%), $7,640.00 joint (7.64%)
- $150,000: $24,734.00 single (16.49%), $15,340.00 joint (10.23%)
- $200,000: $36,734.00 single (18.37%), $26,340.00 joint (13.17%)
- $300,000: $68,134.25 single (22.71%), $49,468.00 joint (16.49%)
The joint figure is lower at every income because the joint brackets and standard deduction are twice as wide. At $200,000 the difference is $10,394.00 a year. That's the gap between one person earning $200,000 alone and a couple earning it together, not a bonus for marrying someone who earns nothing.
Why your effective rate is so much lower than your bracket
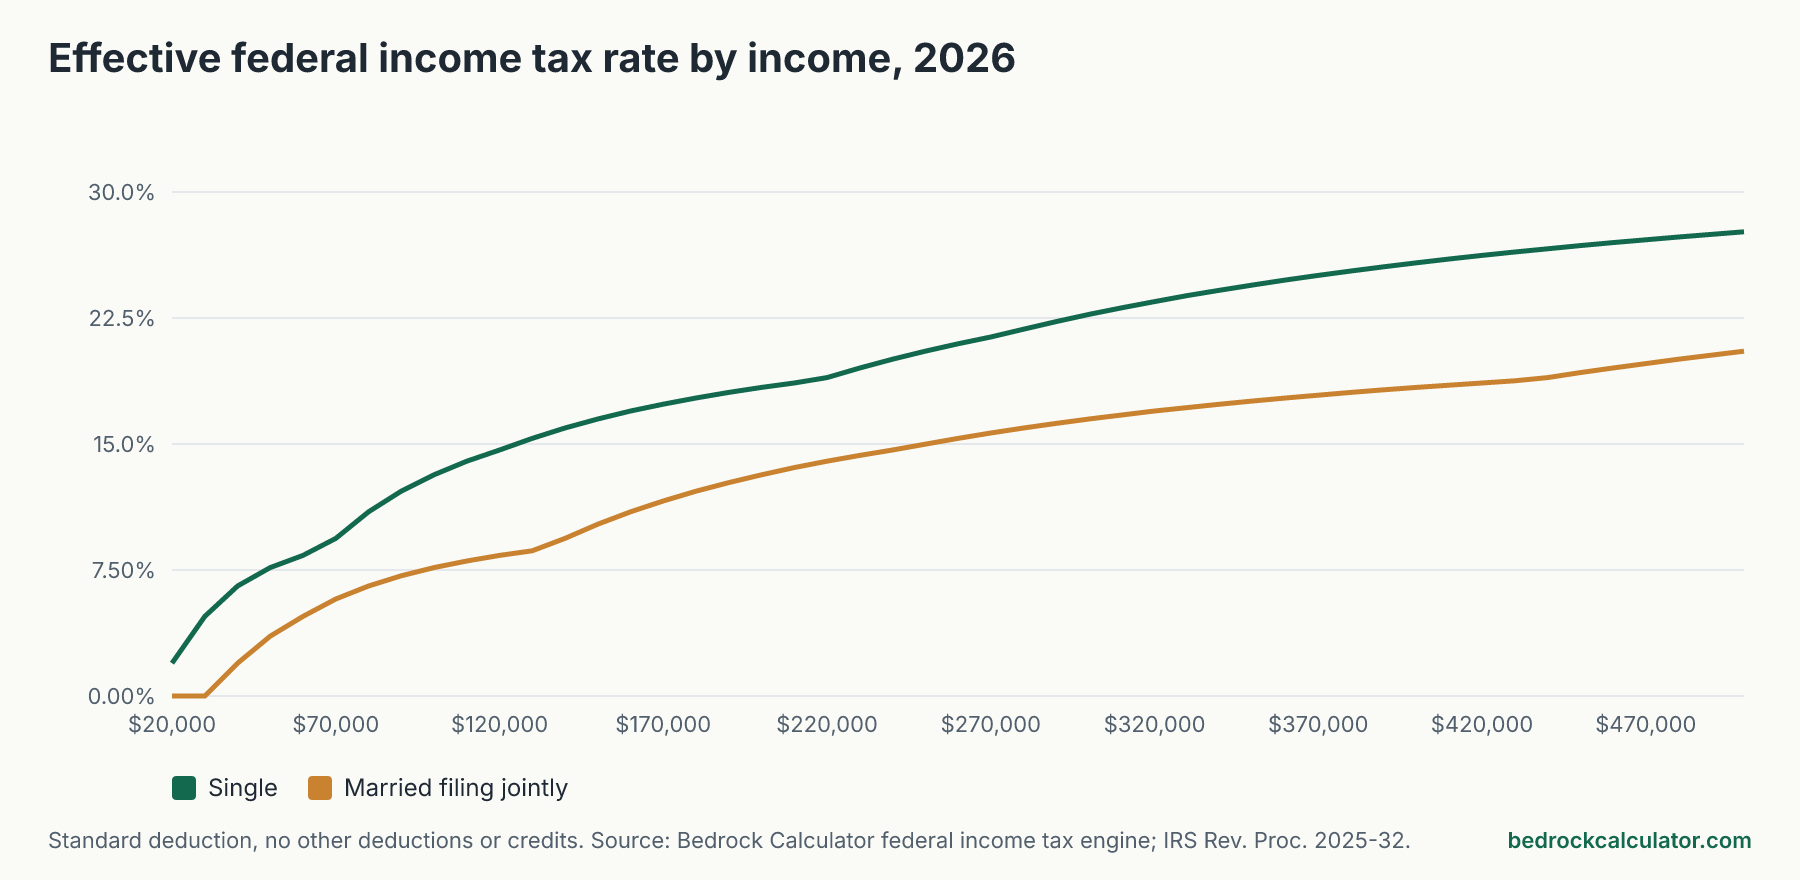
The federal income tax charges each rate only on the slice of income inside its band. A single filer on $100,000 has $50,400 of taxable income taxed at 10% and 12%, and only the part above that at 22%. Add the standard deduction, which isn't taxed at all, and the blended rate comes out at 13.17%.
That's why the effective rate curve rises smoothly while the marginal rate jumps. Look at a few milestones in the table:
- A single filer's effective rate first passes 10% at $80,000, where it's 10.96%.
- A joint filer's first passes 10% at $150,000.
- A single filer's first passes 20% at $240,000, where it's 20.04%.
Even at $500,000 a single filer pays 27.63% overall, well below the 35% bracket they sit in. The top 37% rate doesn't start until $640,600 of taxable income for a single filer and $768,700 for a joint return, so nobody in this table reaches it.
For the full explanation, with the slices worked through step by step, see our guide to marginal vs effective tax rates. The bracket boundaries for every filing status, including head of household, are in the 2026 federal tax brackets guide.
When do you hit the 22% bracket in 2026?
The 22% rate starts at $50,400 of taxable income for a single filer. With the standard deduction that works out to $66,500 of gross income. For a married couple the 22% rate starts at $100,800 of taxable income, or $133,000 of gross.
Crossing into a higher bracket never reduces your take-home pay. Only the dollars above the line are taxed at the higher rate. A raise that pushes you over $66,500 costs you 22% of the raise instead of 12%, and nothing more.
Married filing jointly vs single: is there a penalty?
For couples who earn about the same, no, not anywhere in this table. The joint brackets are exactly double the single ones up to the 37% rate, and so is the standard deduction. So a couple on $100,000 pays $7,640.00, the same as two single people on $50,000 each ($7,640.00 between them).
A couple on $500,000 pays $102,608.00, the same as two singles on $250,000 each.
The penalty only shows up at the very top, because the joint 37% band starts at $768,700 rather than double the single figure. Couples with very different incomes see the opposite effect, a marriage bonus, because the lower earner's unused brackets absorb part of the higher earner's income.
Using these numbers for your own return
Treat this table as a quick read on the federal income tax alone. Your actual bill will be lower if you put money into a traditional 401(k) or HSA, itemize, or claim credits, and your total tax will be higher once FICA and state tax are added.
To get your own number, open the federal income tax calculator and enter your income, pre-tax deductions and credits. For what actually lands in your bank account after FICA and state tax, use the paycheck calculator. If part of your income is from selling investments, the capital gains tax calculator applies the separate long-term rates.