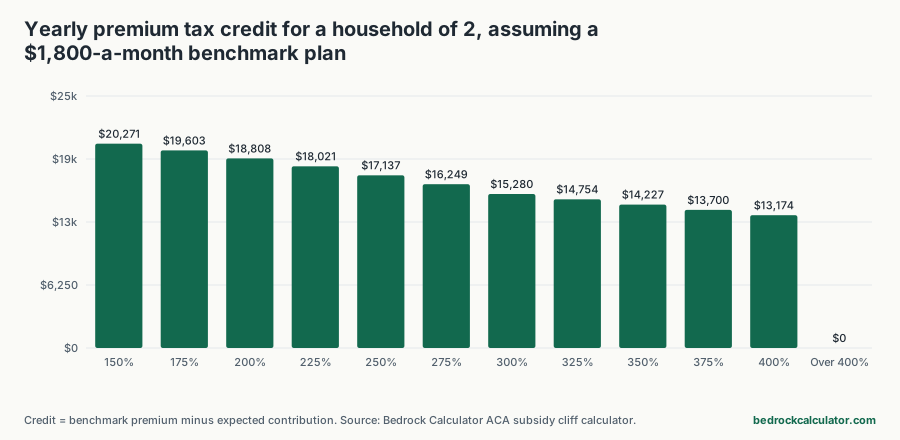
How much ACA premium tax credit do you get at each income in 2026?
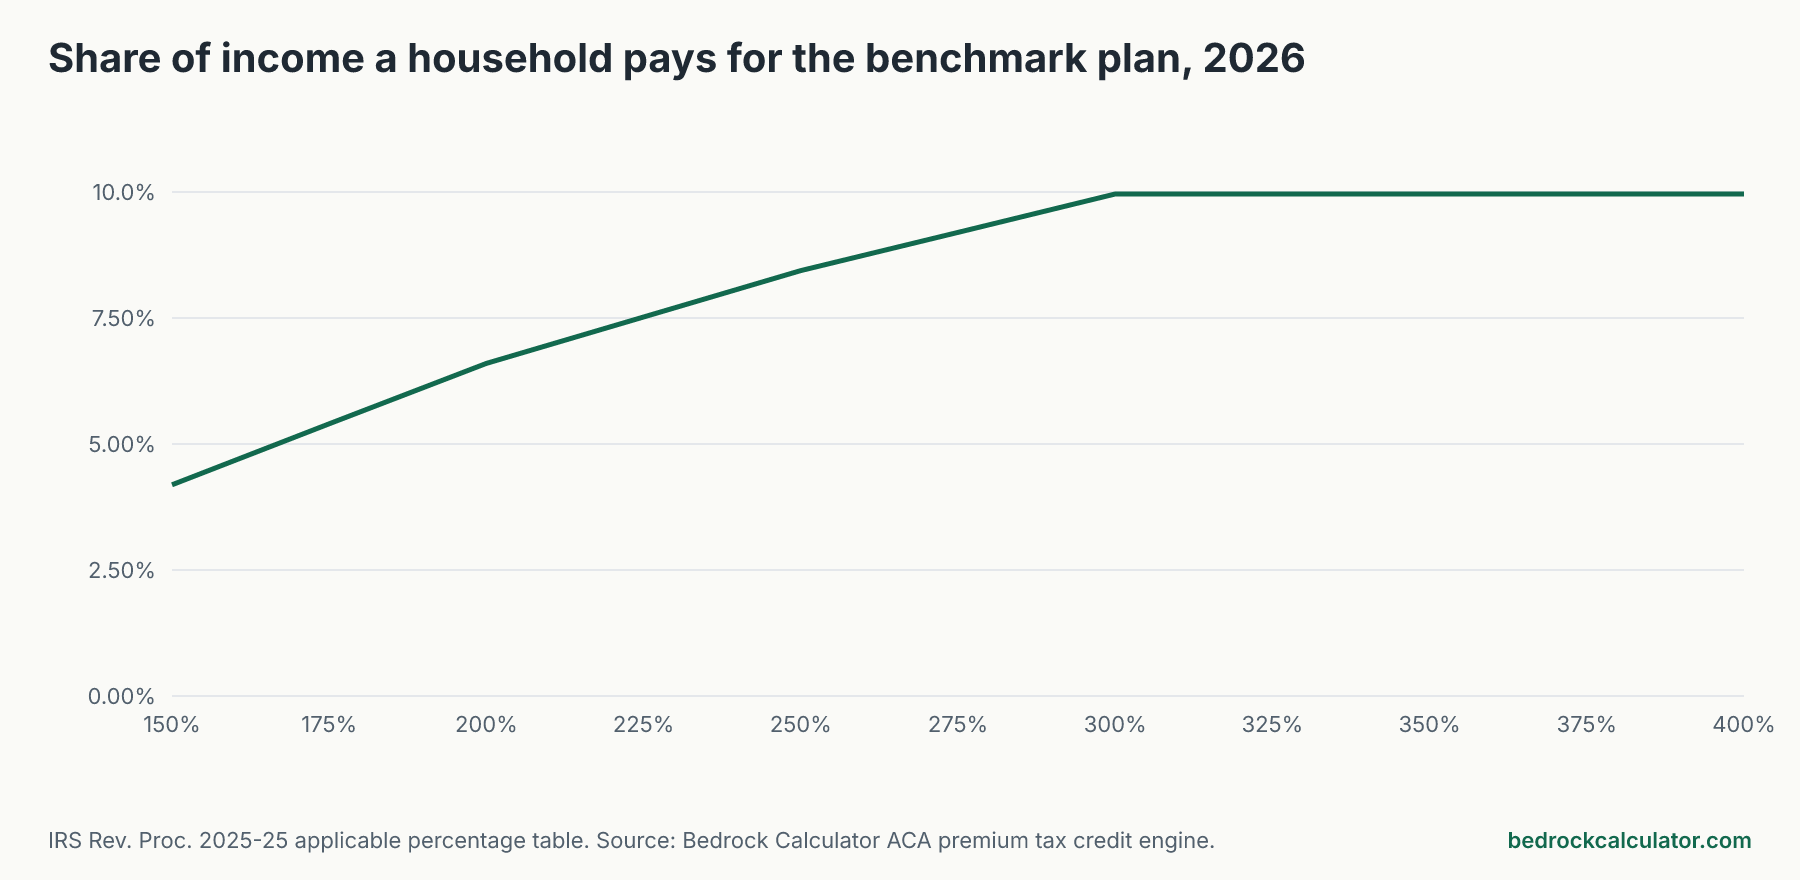
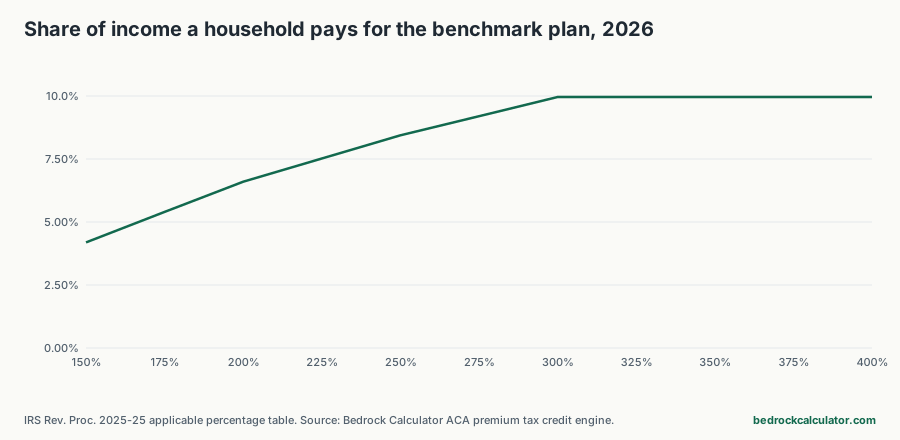
If you buy health insurance on a US ACA Marketplace in 2026, the premium tax credit caps what you pay for the benchmark silver plan at a share of your income. That share rises from 4.19% at 150% of the federal poverty line to 9.96% from 300% up to 400%.
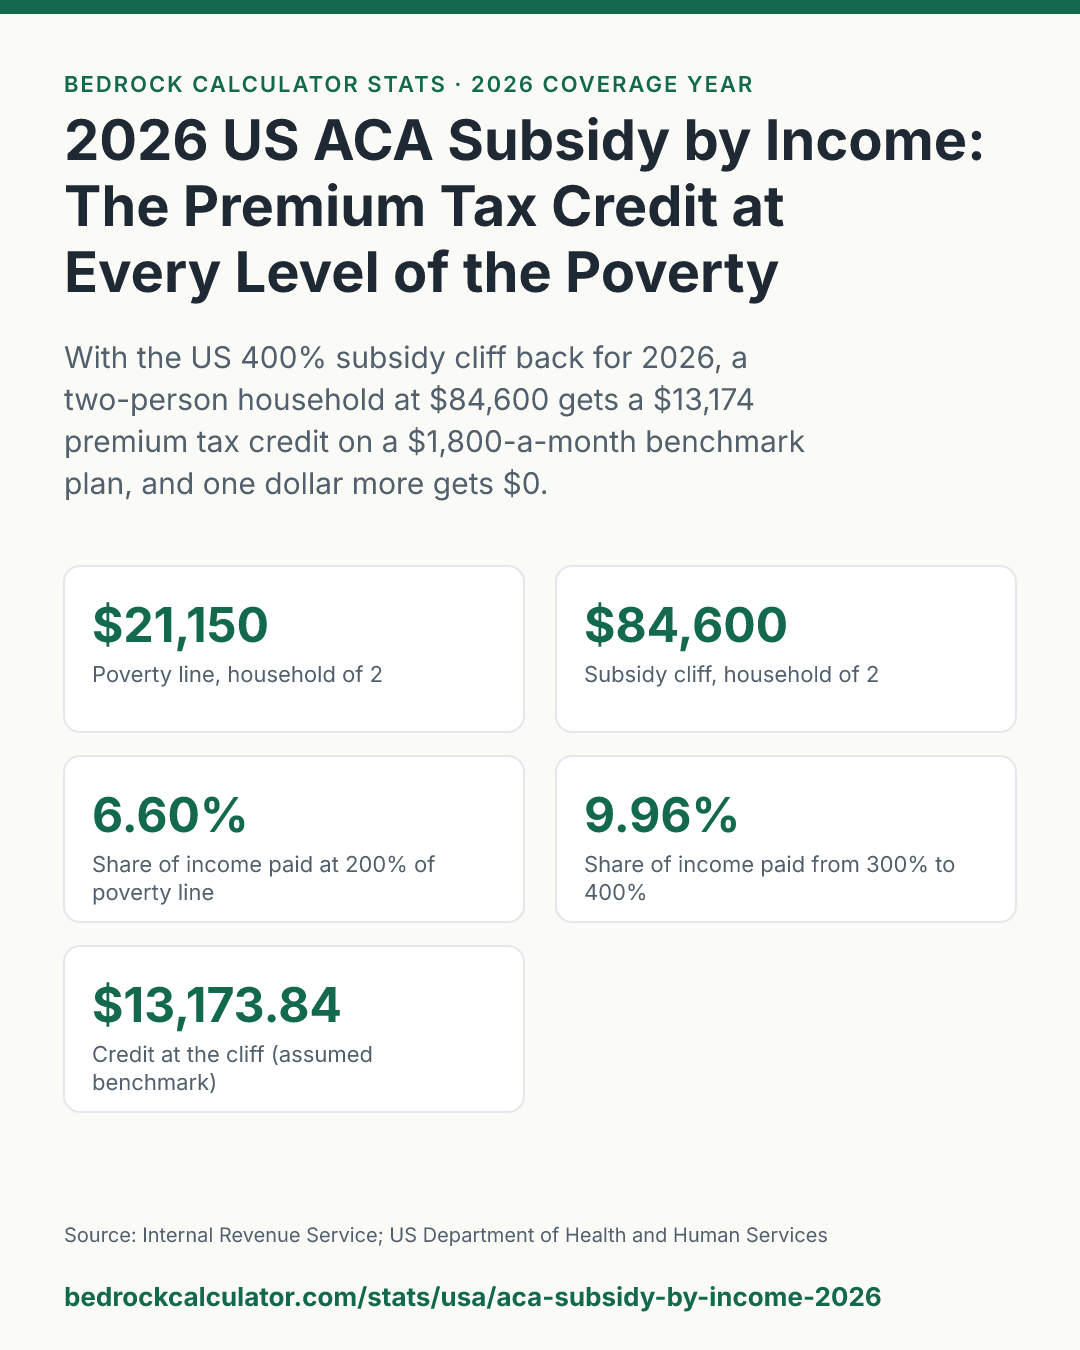
Above 400% the credit stops completely. The temporary rules that removed that cliff expired after 2025, so for a household of two the credit ends at $84,600 of income. One dollar more and, in our example, a $13,173.84 credit becomes $0.00.
How we worked out these numbers
We ran the ACA subsidy cliff calculator on this site for a household of 2 in the 48 contiguous states at each 25-point step of the poverty line from 150% to 400%, and once just above it. The applicable percentages come from IRS Revenue Procedure 2025-25, and the poverty line from the 2025 HHS guidelines, which the Marketplace uses for 2026 coverage. For two people that's $21,150.
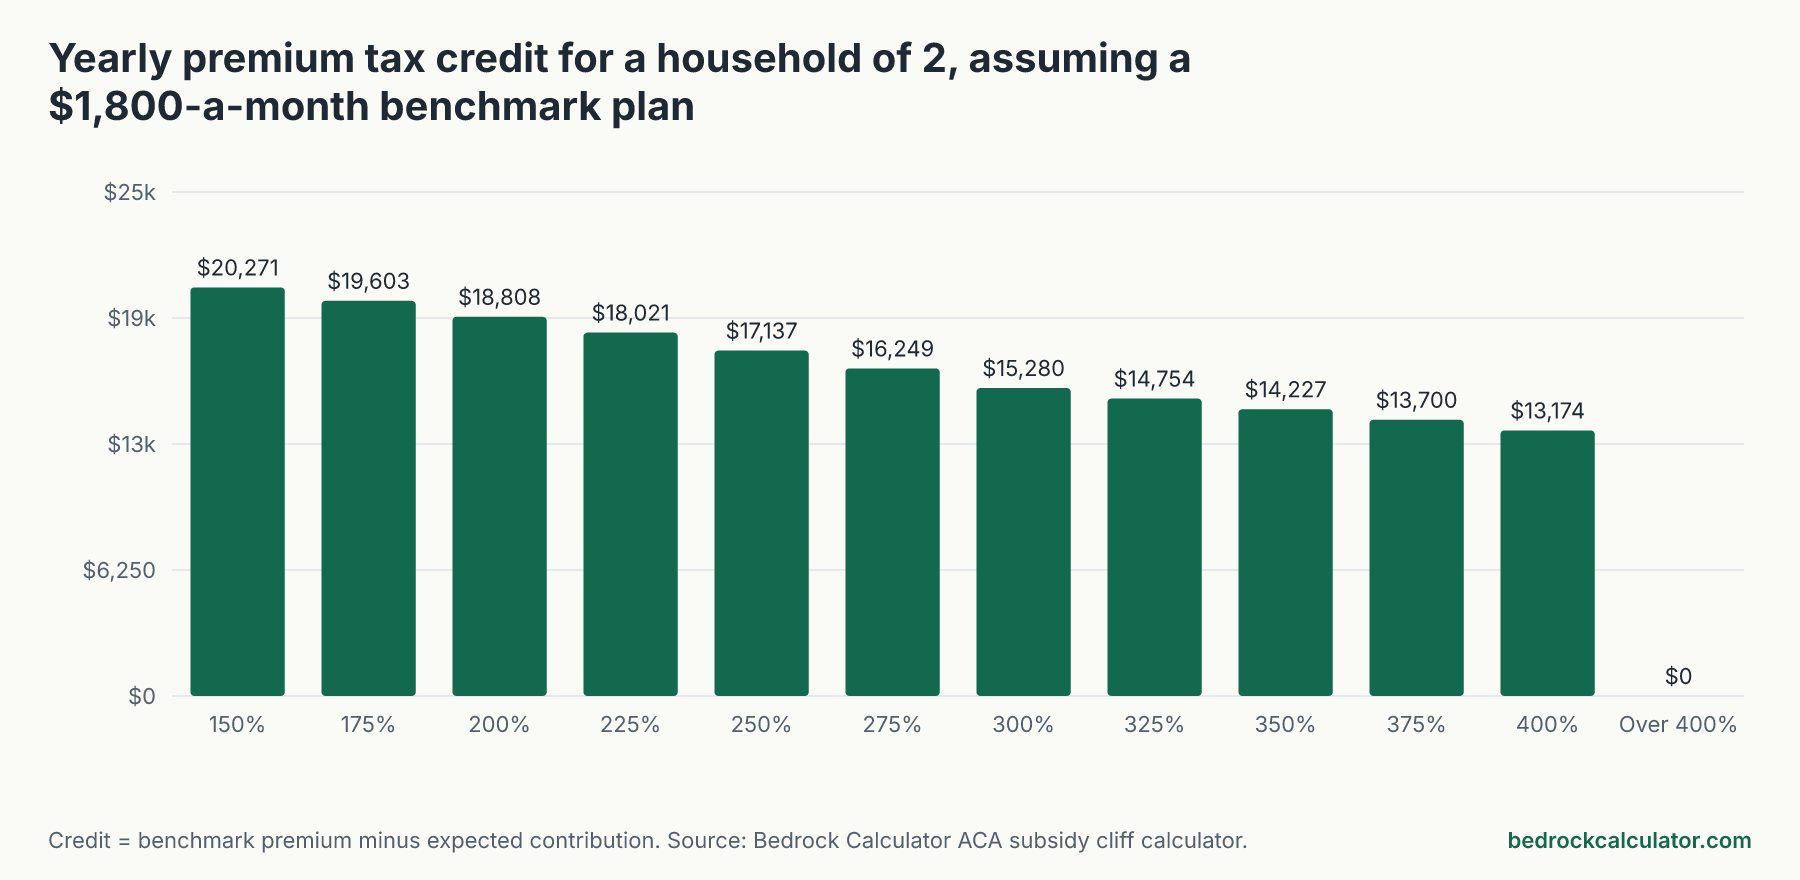
The benchmark premium is an assumption. The credit is the cost of the second-lowest-cost silver plan where you live, minus your expected contribution. That benchmark depends on your ZIP code and the ages of everyone covered, so no single figure fits everyone. We used the calculator's default of $1,800 a month, or $21,600 a year. Treat the credit column as an example.
The good news is that the most useful column doesn't depend on the benchmark at all. "Your yearly contribution" is what you pay for the benchmark plan whatever it costs. If your benchmark is different, your credit is simply your benchmark minus that figure.
What the calculator leaves out:
- Medicaid. In states that expanded Medicaid, adults with the lowest incomes qualify for Medicaid instead of a credit, so our table starts at 150%.
- Cost-sharing reductions, the lower deductibles on silver plans for incomes under 250%.
- State subsidies. Some states add their own help, including above 400%. None is included.
- Repayment caps. If you take the credit in advance and your income ends up higher, repayment can be capped for some households. The calculator doesn't apply a cap.
- Employer coverage. An affordable offer of job-based coverage can make you ineligible. That test isn't run.
The premium tax credit at every income level
2026 premium tax credit by income as a percentage of the poverty line, household of 2
Download CSV48 contiguous states. Assumes a benchmark silver premium of $1,800 a month ($21,600 a year). The expected contribution does not depend on the benchmark; the credit is the benchmark minus it.
| 150% | $31,725 | 4.19% | $1,329.28 | $20,270.72 | $110.77 |
| 175% | $37,013 | 5.40% | $1,996.89 | $19,603.11 | $166.41 |
| 200% | $42,300 | 6.60% | $2,791.80 | $18,808.20 | $232.65 |
| 225% | $47,588 | 7.52% | $3,578.66 | $18,021.34 | $298.22 |
| 250% | $52,875 | 8.44% | $4,462.65 | $17,137.35 | $371.89 |
| 275% | $58,163 | 9.20% | $5,351.04 | $16,248.96 | $445.92 |
| 300% | $63,450 | 9.96% | $6,319.62 | $15,280.38 | $526.64 |
| 325% | $68,738 | 9.96% | $6,846.30 | $14,753.70 | $570.53 |
| 350% | $74,025 | 9.96% | $7,372.89 | $14,227.11 | $614.41 |
| 375% | $79,313 | 9.96% | $7,899.57 | $13,700.43 | $658.30 |
| 400% | $84,600 | 9.96% | $8,426.16 | $13,173.84 | $702.18 |
| Just over 400% | $84,601 | n/a | n/a | $0.00 | $1,800.00 |
n/a means the column does not apply to that row.
At 200% of the poverty line, $42,300 for two people, you're expected to pay 6.60% of income, which is $2,791.80 a year or $232.65 a month. At 250% it's 8.44%, or $371.89 a month. From 300% to 400% the share stays at 9.96%, so your contribution grows only because your income does: $526.64 a month at 300% and $702.18 at 400%.
Within each band the percentage rises in a straight line, so there are no jumps until the cliff. A raise of a few thousand dollars below 400% costs you only a few hundred dollars of credit.
The 2026 subsidy cliff at 400% of the poverty line
The last bar is the problem. Up to $84,600, our two-person household with a $1,800 benchmark pays $702.18 a month. At one dollar more, there's no credit, and the same plan costs the full $1,800.00 a month.
The calculator's default example shows how lopsided that is. A two-person household at $84,000 that takes $1,000 of extra income, from a Roth conversion, a capital gain or a bit of consulting work, loses $13,233.60 of credit. That's 1323.4% of the extra income, before any income tax on it.
The cliff matters most for early retirees and the self-employed, whose income is often partly in their own hands. If you're near the line, check where your income will land before you sell investments or convert to a Roth.
Where the 400% cliff falls for your household
The poverty line rises with household size, so the cliff does too.
Poverty line and the 400% subsidy cliff by household size, 2026 coverage
Download CSV2025 HHS poverty guidelines, which the Marketplace uses for 2026 coverage. 48 contiguous states and DC; Alaska and Hawaii are higher.
| 1 | $15,650 | $23,475 | $62,600 |
| 2 | $21,150 | $31,725 | $84,600 |
| 3 | $26,650 | $39,975 | $106,600 |
| 4 | $32,150 | $48,225 | $128,600 |
| 5 | $37,650 | $56,475 | $150,600 |
| 6 | $43,150 | $64,725 | $172,600 |
For one person the cliff is $62,600. For a family of four it's $128,600. These are for the 48 contiguous states and DC; Alaska and Hawaii have higher poverty guidelines.
Income here means modified adjusted gross income for everyone on the tax return. That's your adjusted gross income plus any tax-exempt interest, untaxed foreign income and the untaxed part of Social Security benefits. Pre-tax contributions to a 401(k), traditional IRA or HSA reduce it, which is one of the few ways to pull income back below the line after the fact.
Getting your own figure
Two numbers decide your credit: your expected income for 2026 and your local benchmark premium, which HealthCare.gov or your state's exchange will show you when you enter your ZIP code and ages. Put both into the ACA subsidy cliff calculator and it will show your credit, your net premium and how close you are to the cliff.
If you're retiring before Medicare starts, the early retirement health insurance calculator prices the years in between. To manage income around the cliff with Roth conversions, try the Roth conversion ladder calculator, and see our guide to marginal vs effective tax rates for why a cliff like this behaves so differently from a tax bracket.