How much of your salary do you keep in each Canadian province?
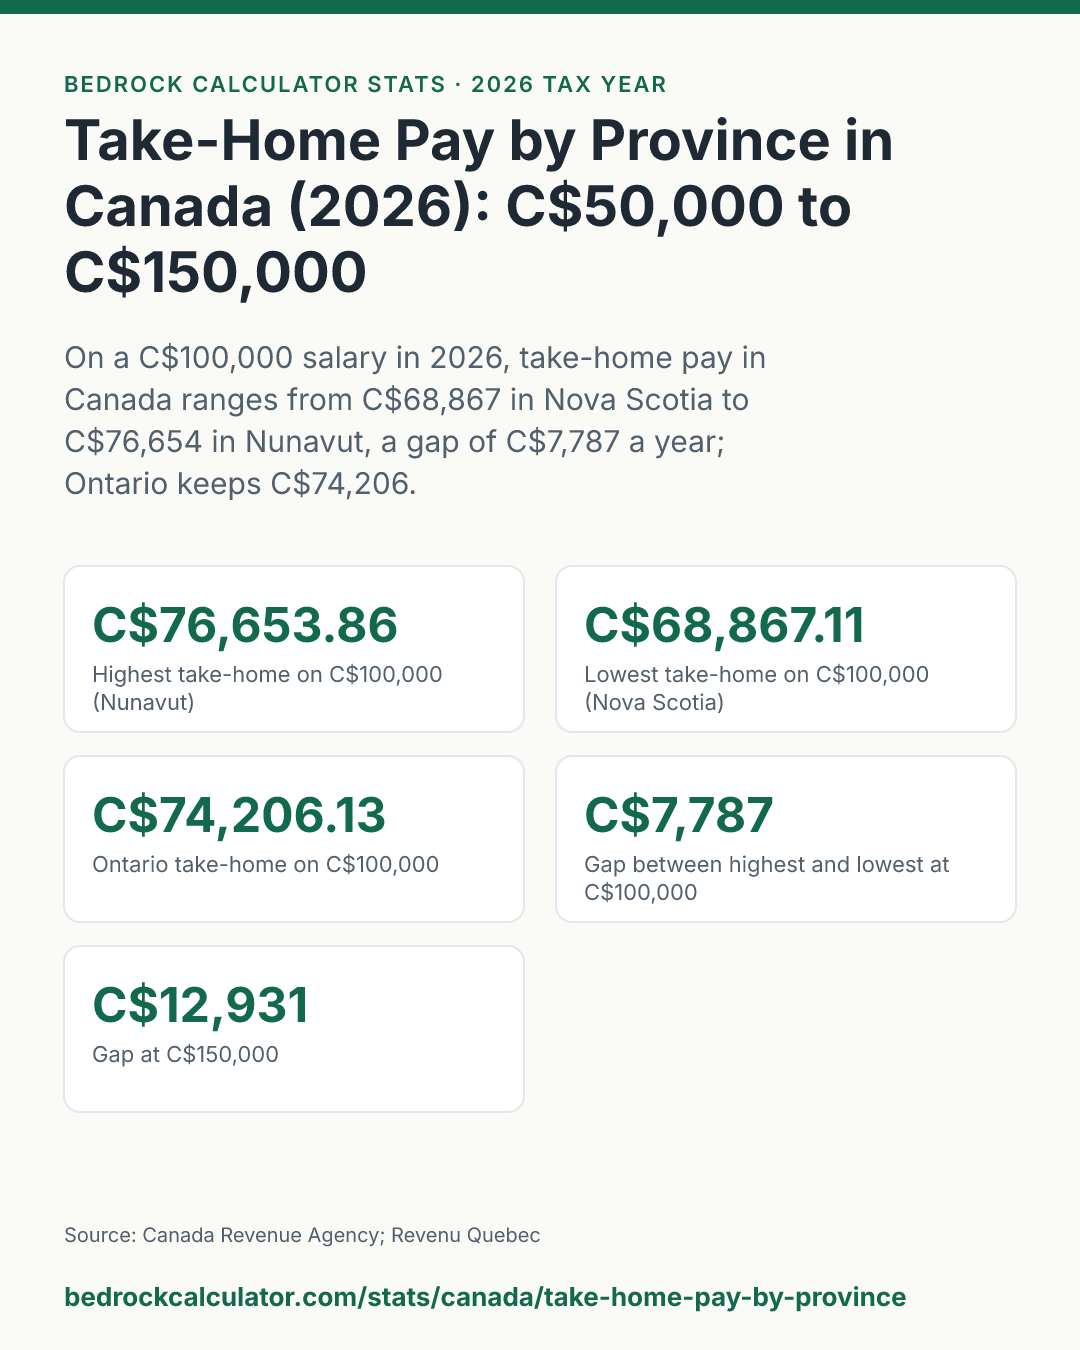
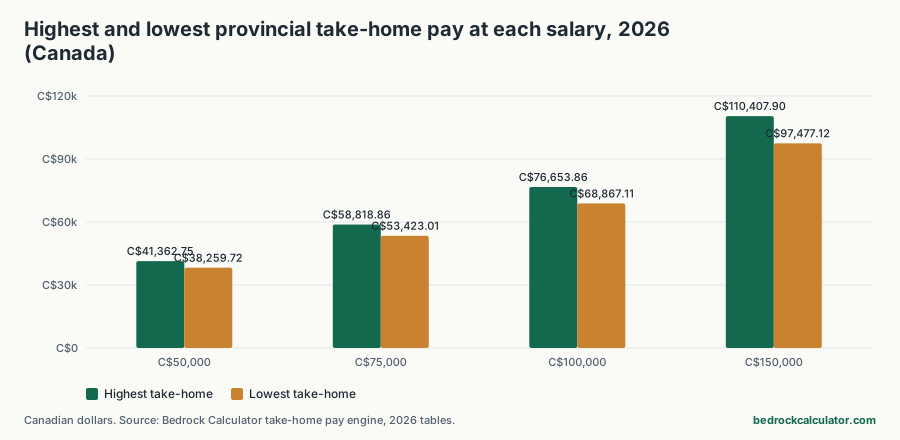
On a C$100,000 salary in 2026, take-home pay in Canada runs from C$68,867.11 in Nova Scotia to C$76,653.86 in Nunavut. That's a gap of C$7,787 a year on exactly the same paycheque, and almost all of it comes from the provincial layer of income tax. Ontario sits in the middle at C$74,206.13.
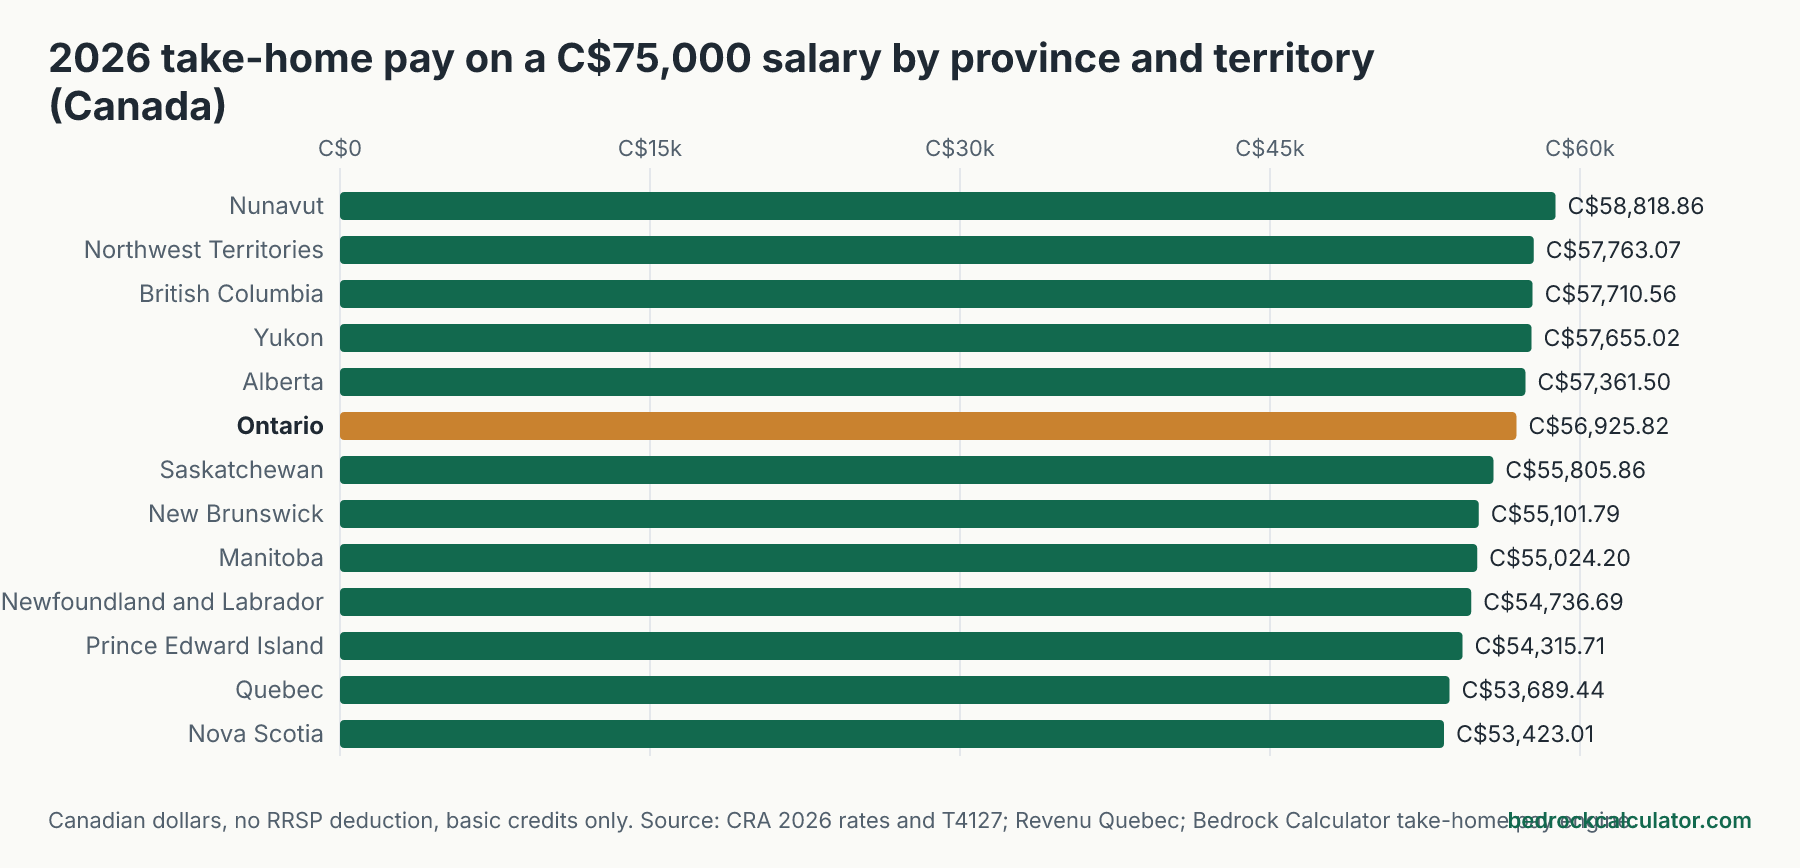
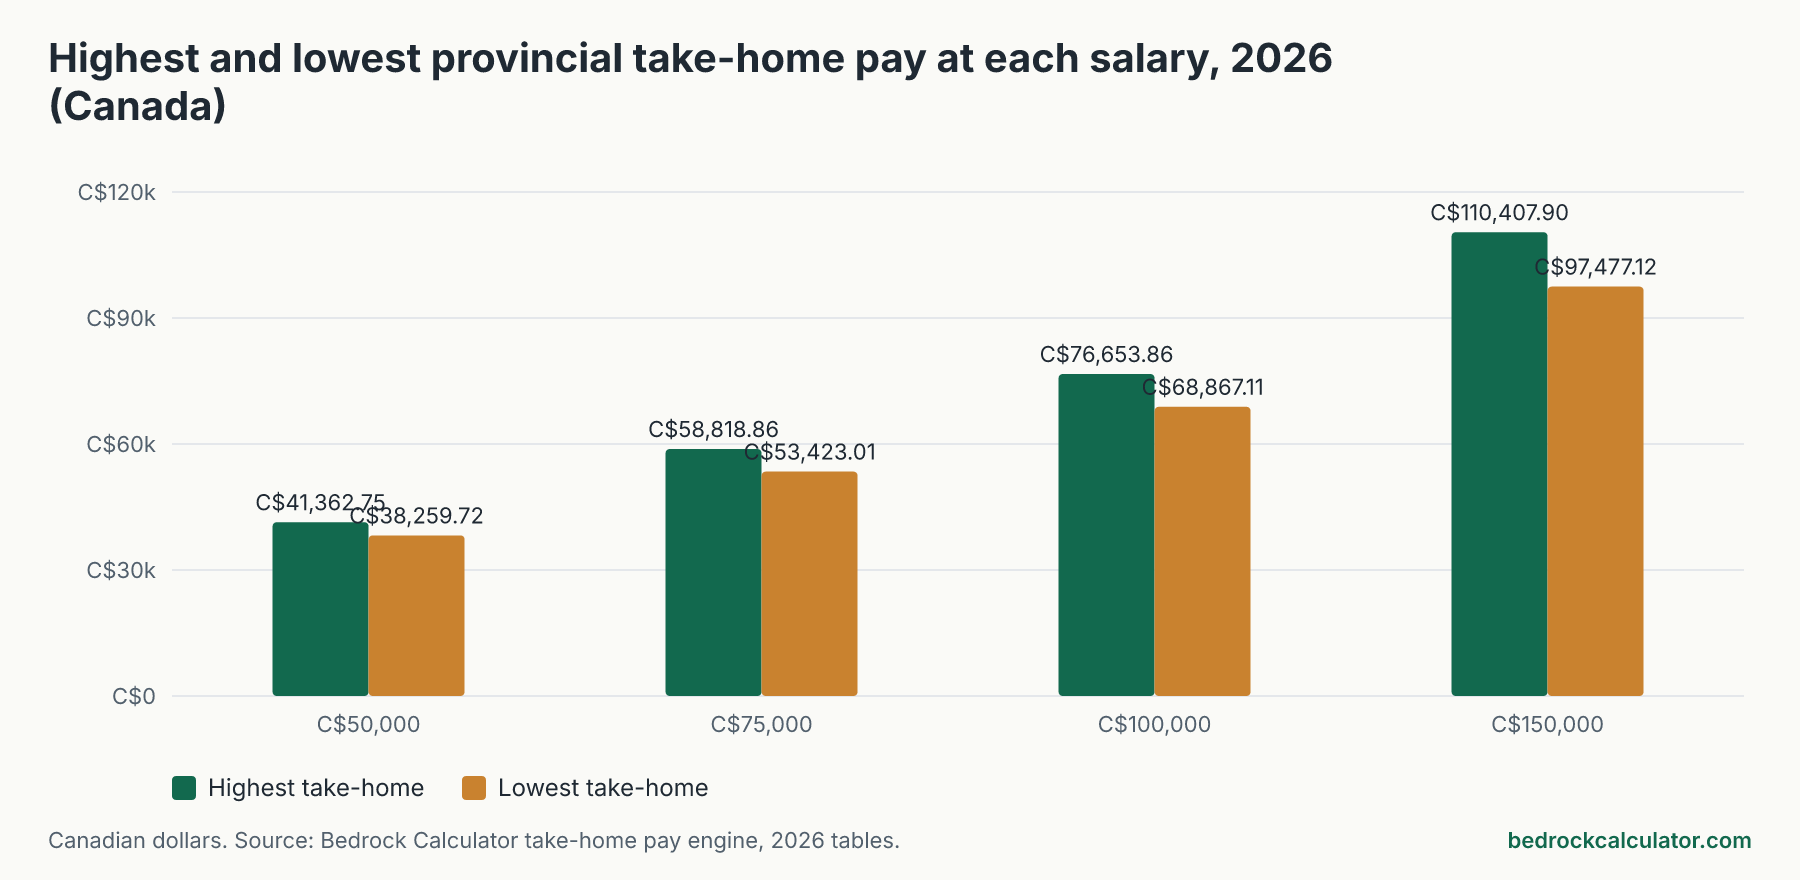
The gap grows with income. It's C$3,103 at C$50,000, C$5,396 at C$75,000 and C$12,931 at C$150,000.
How we worked out these numbers
Every figure here comes from the Canada take-home pay calculator on this site, run once for each province and territory at each salary. It applies the 2026 federal brackets and the 2026 brackets and basic personal amount for the province you pick, all taken from the Canada Revenue Agency's 2026 rate table and its T4127 payroll formulas, and from Revenu Quebec for Quebec.
On top of income tax it takes off CPP (QPP in Quebec), the second-tier CPP2 contribution on pay above the first ceiling, EI premiums and, in Quebec, QPIP premiums. In Ontario it adds the Ontario surtax and the Ontario Health Premium, and in Ontario and British Columbia it applies the low-income tax reduction.
We assumed a single employee with no RRSP contribution or other deduction, paid every two weeks, claiming only the basic credits: the basic personal amount, the Canada employment amount and the credits for CPP and EI. That's what a default TD1 form gives you. Spousal, dependant, tuition, medical and donation credits aren't included, and neither are the low-income reductions that some provinces grant on the return, so pay at modest incomes in Nova Scotia, New Brunswick, Newfoundland and Labrador, Prince Edward Island and Manitoba may be a little higher than shown.
Every province and territory at four salaries
Click a column to sort. The marginal rate is income tax on the next dollar of salary, federal plus provincial.
2026 take-home pay by province and territory in Canada (Canadian dollars, no RRSP deduction)
Download CSVAnnual pay after federal and provincial income tax, CPP or QPP, EI and (Quebec) QPIP. Basic credits only.
| Nunavut | C$41,362.75 | C$58,818.86 | C$76,653.86 | C$110,407.90 | 76.65% | 27.50% |
| British Columbia | C$40,573.79 | C$57,710.56 | C$75,373.36 | C$107,376.55 | 75.37% | 28.20% |
| Northwest Territories | C$40,768.12 | C$57,763.07 | C$75,204.47 | C$107,360.82 | 75.20% | 29.10% |
| Yukon | C$40,611.34 | C$57,655.02 | C$74,998.02 | C$107,892.75 | 75.00% | 29.50% |
| Alberta | C$40,541.18 | C$57,361.50 | C$74,458.50 | C$107,457.96 | 74.46% | 30.50% |
| Ontario | C$40,144.94 | C$56,925.82 | C$74,206.13 | C$104,319.89 | 74.21% | 31.48% |
| Saskatchewan | C$39,699.20 | C$55,805.86 | C$72,287.86 | C$104,037.32 | 72.29% | 33.00% |
| Manitoba | C$39,074.76 | C$55,024.20 | C$71,444.70 | C$100,796.57 | 71.44% | 33.25% |
| New Brunswick | C$39,354.22 | C$55,101.79 | C$71,214.79 | C$101,330.11 | 71.21% | 34.50% |
| Newfoundland and Labrador | C$39,252.20 | C$54,736.69 | C$70,602.95 | C$100,702.41 | 70.60% | 36.30% |
| Prince Edward Island | C$38,828.79 | C$54,315.71 | C$69,789.11 | C$98,972.67 | 69.79% | 37.10% |
| Quebec | C$38,621.16 | C$53,689.44 | C$69,309.60 | C$97,477.12 | 69.31% | 36.11% |
| Nova Scotia | C$38,259.72 | C$53,423.01 | C$68,867.11 | C$98,116.57 | 68.87% | 38.00% |
Why the territories come out ahead
Nunavut tops the list at every salary we tested: C$41,362.75 at C$50,000, C$58,818.86 at C$75,000, C$76,653.86 at C$100,000 and C$110,407.90 at C$150,000. Its territorial rates start low and its basic personal amount is large, so less of each dollar goes to the territory.
British Columbia, the Northwest Territories and Yukon follow close behind. At C$100,000 British Columbia keeps C$75,373.36, a little ahead of Alberta's C$74,458.50. Alberta's provincial basic personal amount is the biggest of any province, which helps most at lower salaries, but its first-bracket rate is higher than British Columbia's.
Where the paycheque shrinks most
At C$50,000, C$75,000 and C$100,000, Nova Scotia leaves the least: C$38,259.72, C$53,423.01 and C$68,867.11. It has a low first bracket ceiling and some of the highest middle-bracket rates in the country, so a typical salary climbs into its expensive brackets quickly.
At C$150,000 the bottom spot goes to Quebec, at C$97,477.12. At that income Quebec's provincial tax is the highest in the country, and the 16.5% federal abatement Quebec residents get doesn't make up for it.
The marginal rate tells the same story from the other side. At C$100,000 the next dollar of salary costs 38.00% in income tax in Nova Scotia and 27.50% in Nunavut.
The federal part is the same almost everywhere
Federal tax doesn't depend on your province, with one exception. On C$100,000 every employee outside Quebec pays C$13,301.60 of federal tax. Quebec residents pay C$11,054.06, because federal tax is cut by the 16.5% Quebec abatement.
CPP and EI are also national, up to their ceilings. What changes from province to province is the provincial or territorial income tax, which on C$100,000 runs from a few thousand dollars in the territories to C$13,415.34 in Quebec.
Where a C$100,000 salary goes, by province and territory (Canadian dollars)
Download CSV| Nunavut | C$13,301.60 | C$4,275.02 | C$5,769.52 | C$76,653.86 | C$2,948.23 |
| British Columbia | C$13,301.60 | C$5,555.52 | C$5,769.52 | C$75,373.36 | C$2,898.98 |
| Northwest Territories | C$13,301.60 | C$5,724.41 | C$5,769.52 | C$75,204.47 | C$2,892.48 |
| Yukon | C$13,301.60 | C$5,930.86 | C$5,769.52 | C$74,998.02 | C$2,884.54 |
| Alberta | C$13,301.60 | C$6,470.38 | C$5,769.52 | C$74,458.50 | C$2,863.79 |
| Ontario | C$13,301.60 | C$6,722.75 | C$5,769.52 | C$74,206.13 | C$2,854.08 |
| Saskatchewan | C$13,301.60 | C$8,641.02 | C$5,769.52 | C$72,287.86 | C$2,780.30 |
| Manitoba | C$13,301.60 | C$9,484.18 | C$5,769.52 | C$71,444.70 | C$2,747.87 |
| New Brunswick | C$13,301.60 | C$9,714.09 | C$5,769.52 | C$71,214.79 | C$2,739.03 |
| Newfoundland and Labrador | C$13,301.60 | C$10,325.93 | C$5,769.52 | C$70,602.95 | C$2,715.50 |
| Prince Edward Island | C$13,301.60 | C$11,139.77 | C$5,769.52 | C$69,789.11 | C$2,684.20 |
| Nova Scotia | C$13,301.60 | C$12,061.77 | C$5,769.52 | C$68,867.11 | C$2,648.74 |
| Quebec | C$11,054.06 | C$13,415.34 | C$6,221 | C$69,309.60 | C$2,665.75 |
Quebec works differently
Quebec is the one province where the whole payroll picture changes, not just the provincial tax. Instead of CPP, employees pay into the Quebec Pension Plan at a higher rate. They also pay QPIP premiums for parental insurance, and in return pay a lower EI rate. On C$100,000 those payroll contributions add up to C$6,221.00, compared with C$5,769.52 in Ontario.
Quebec income tax is set by Revenu Quebec, not the CRA, and it's the biggest provincial bill in the country at the higher salaries. Put together, a C$100,000 salary in Quebec takes home C$69,309.60, against C$74,206.13 in Ontario.
What it means for a monthly budget
Annual gaps can look abstract, so here's the monthly view. At C$100,000, the difference between the best and worst province works out to about C$649 a month: C$6,387.82 in Nunavut against C$5,738.93 in Nova Scotia.
In Ontario, C$100,000 is about C$6,183.84 a month, or C$2,854.08 on each biweekly cheque. Of the full salary, C$13,301.60 goes to federal tax, C$6,722.75 to Ontario (including the health premium) and C$5,769.52 to CPP and EI. You keep 74.21%.
How to get your own number
These figures assume no RRSP contribution. Putting money into an RRSP lowers your income tax at your marginal rate but never touches CPP or EI, because those are charged on gross pay. The take-home pay calculator lets you enter your RRSP and other deductions and pick your pay frequency.
If you only want the income tax part, the Canada income tax calculator works from taxable income. And if you're deciding how much to put into an RRSP, the RRSP calculator shows what the deduction is worth over time.
For the tax schedules behind all of this, see our 2026 federal and provincial tax brackets, and for how a capital gain is taxed in each province, capital gains tax by province.