How much is an hourly wage worth after taxes in each US state?
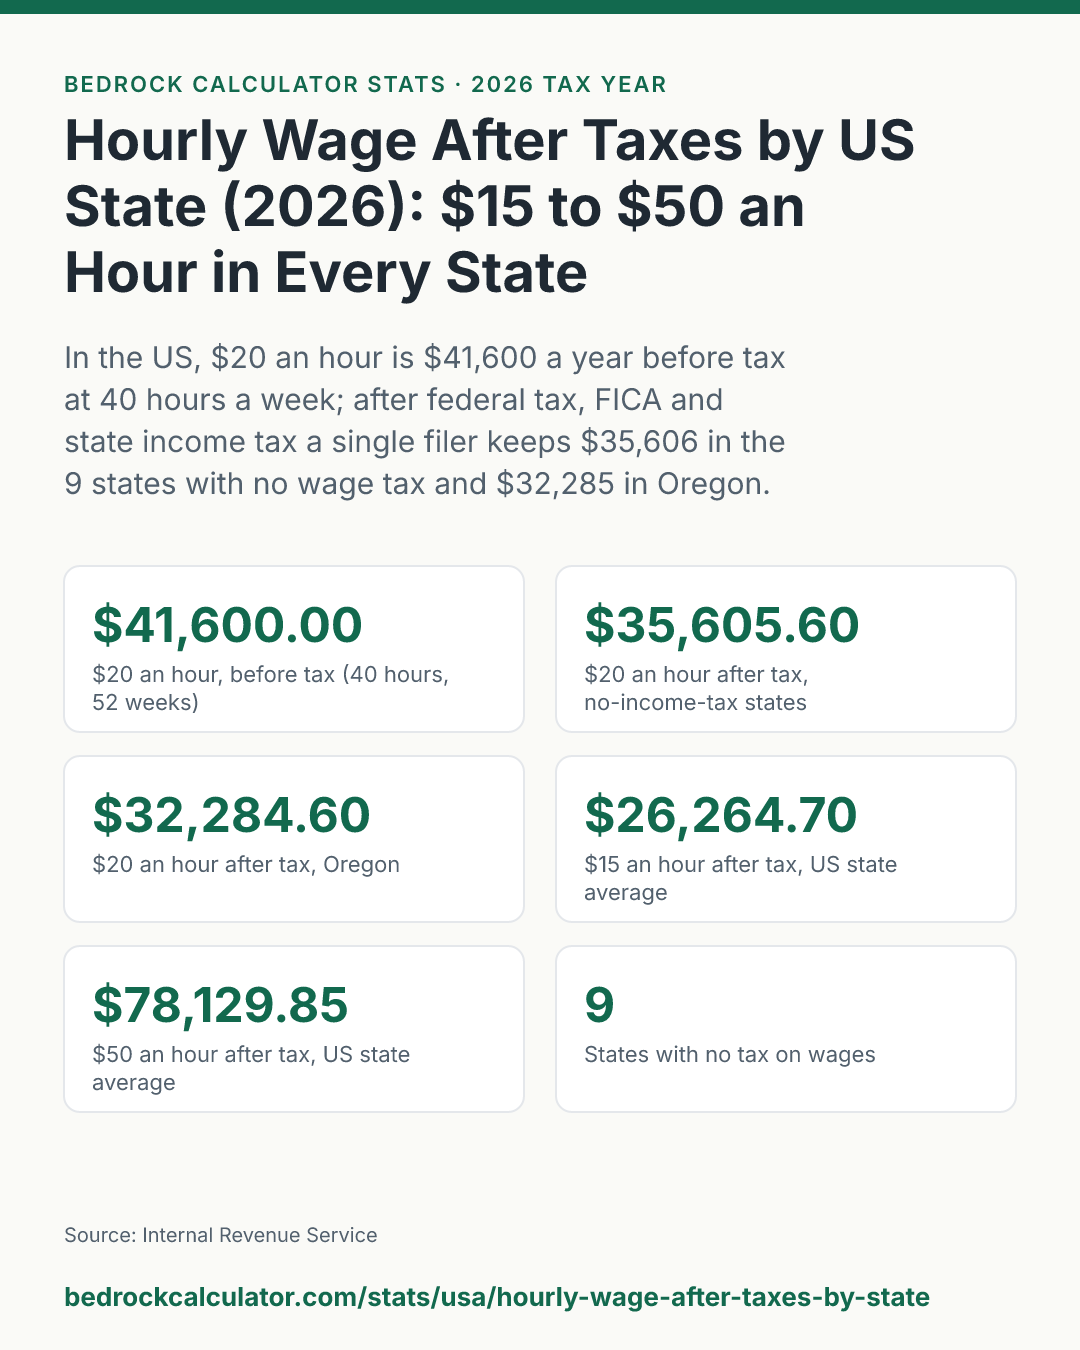
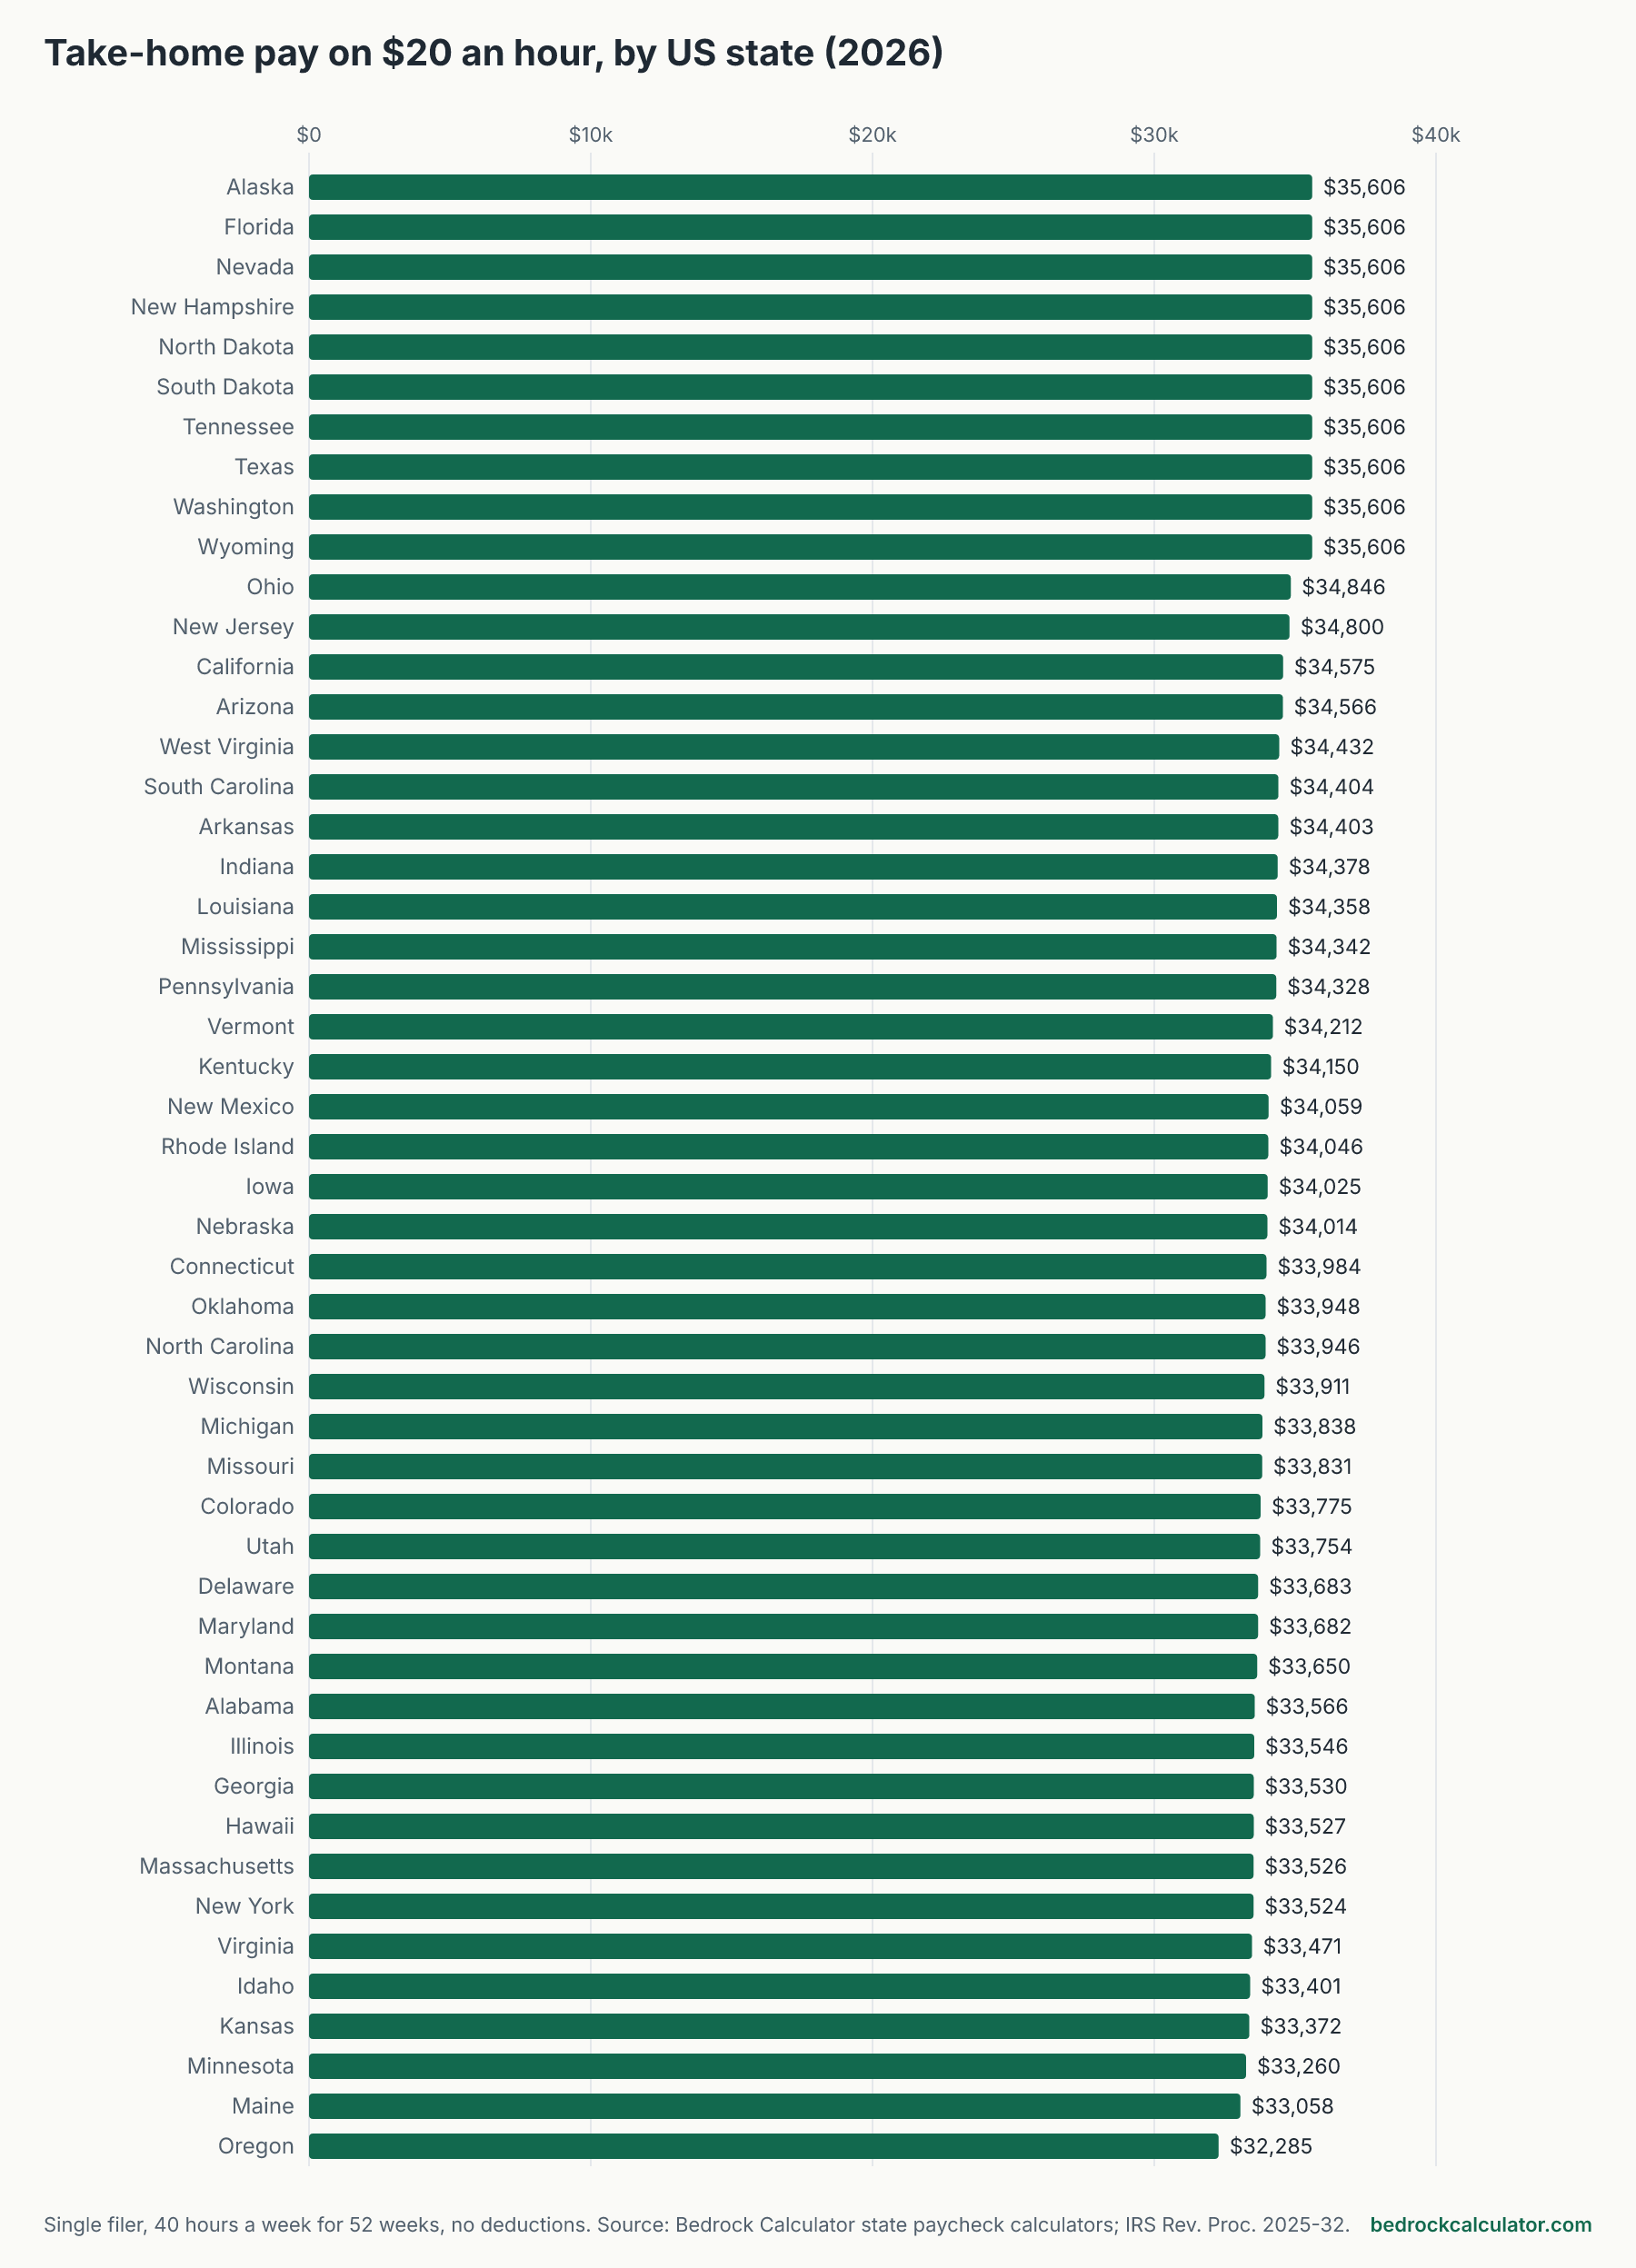
Working full time in the US at $20 an hour earns $41,600.00 a year before tax. A single filer with no deductions keeps $35,605.60 of that in the 9 states that don't tax wages, and $32,284.60 in Oregon, the lowest figure the state calculators return. That's $1,369.45 or $1,241.72 every two weeks.
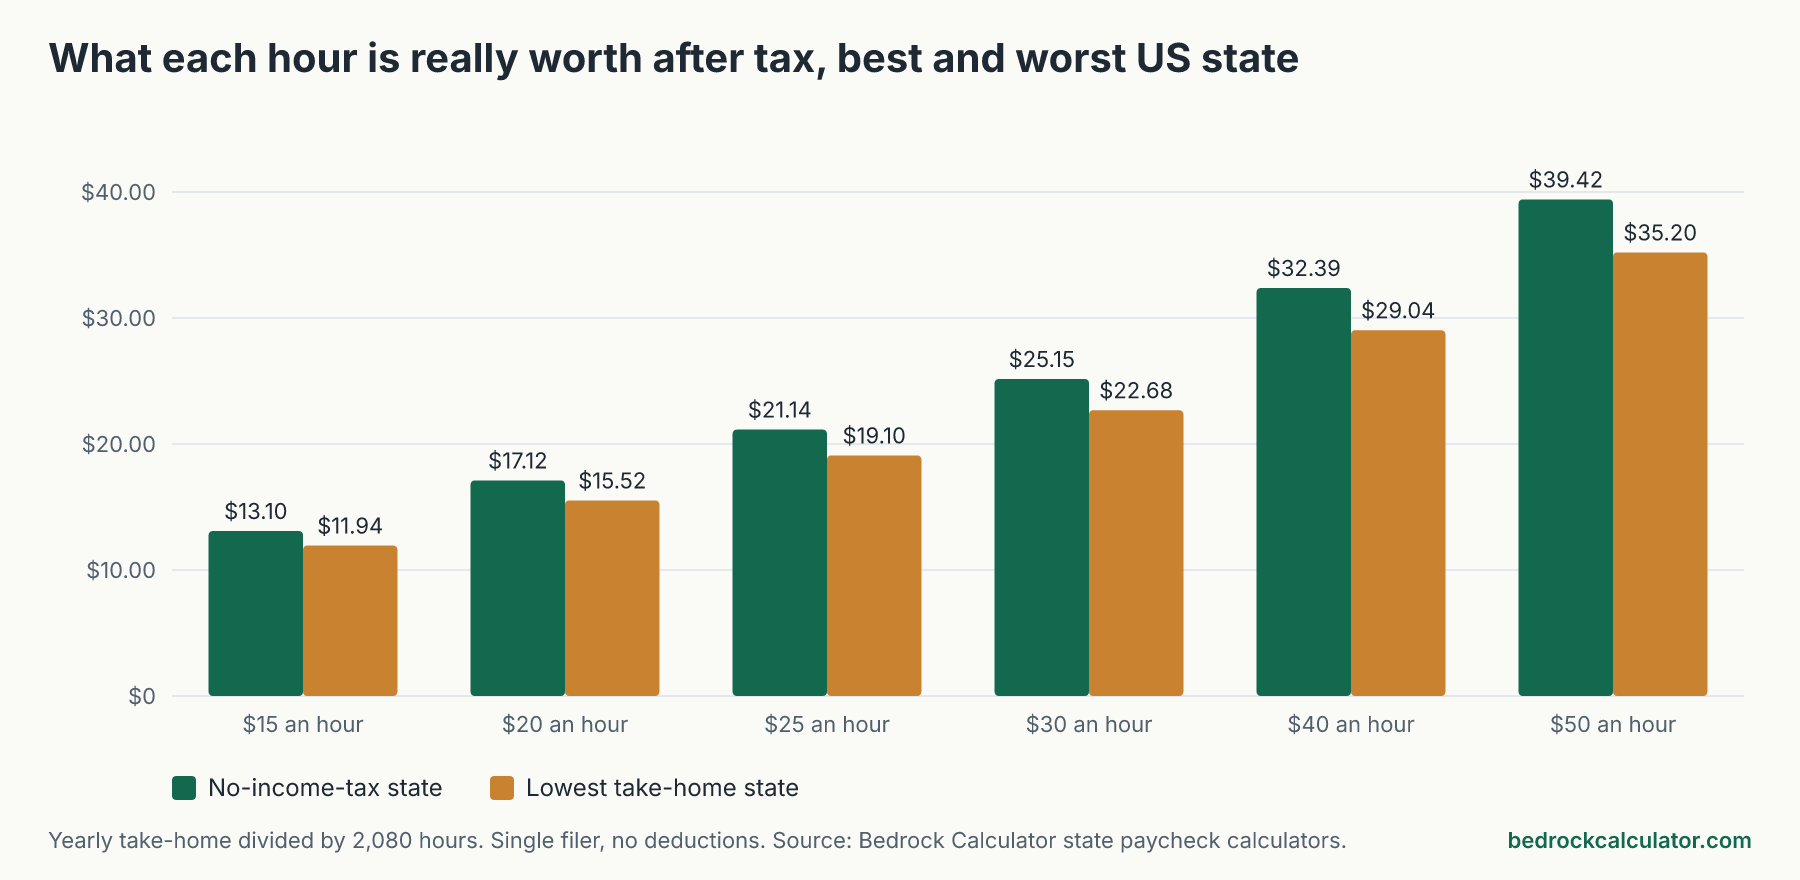
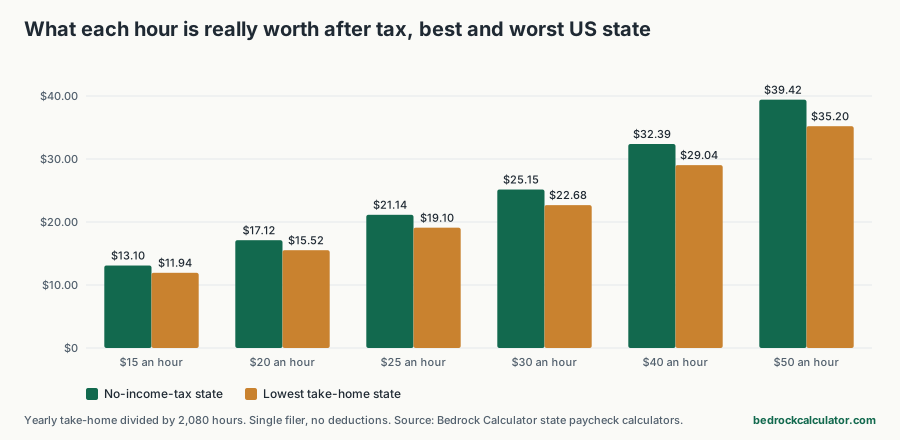
Spread over every hour you work, $20 an hour becomes about $17.12 after tax in a no-income-tax state and $15.52 at the bottom of the list.
How we worked out these numbers
These aren't survey figures. Each state on this site has its own paycheck calculator, and we ran every one of them with the Hourly pay type at six wages: $15, $20, $25, $30, $40 and $50 an hour. That's 50 calculators and six runs each. The District of Columbia isn't here because the site doesn't have a DC paycheck calculator, and we'd rather leave it out than guess.
Every run uses the same setup, so the state is the only thing that changes:
- 40 hours a week for all 52 weeks, which is 2,080 paid hours a year
- Every hour paid at the same rate, with no overtime premium
- Single filer, paid every two weeks
- No 401(k), health insurance, HSA or other deductions before or after tax
- 2026 federal brackets and standard deduction, Social Security and Medicare, and each state's income tax schedule
There's one limit you should know before reading the state rankings. The state calculators apply each state's rate schedule to your wages without that state's own standard deduction, personal exemption or credits. Oregon is a clear case: its calculator notes that the Oregon standard deduction and exemption credit aren't applied, so the Oregon line runs high. So treat the state tax in these figures as an upper bound. The real gap between states is usually somewhat smaller than shown here.
Local income taxes aren't included either. If you work somewhere with a city or county wage tax, such as New York City, Philadelphia or parts of Ohio, Maryland and Pennsylvania, your take-home will be lower. Payroll items like state disability insurance or paid leave contributions also aren't counted.
What every hourly wage leaves you, state by state
Sort any column by clicking its heading. Each number is a year of take-home pay after federal income tax, Social Security, Medicare and state income tax.
Yearly take-home pay by hourly wage, every US state (2026, single filer, 40 hours a week)
Download CSVHourly rate x 40 hours x 52 weeks, paid biweekly, no 401(k) or other deductions. After federal income tax, Social Security, Medicare and state income tax only. No local taxes. DC is not included because the site has no DC paycheck calculator.
| Alaska | $27,249.20 | $35,605.60 | $43,962.00 | $52,318.40 | $67,361.20 | $81,994.00 |
| Florida | $27,249.20 | $35,605.60 | $43,962.00 | $52,318.40 | $67,361.20 | $81,994.00 |
| Nevada | $27,249.20 | $35,605.60 | $43,962.00 | $52,318.40 | $67,361.20 | $81,994.00 |
| New Hampshire | $27,249.20 | $35,605.60 | $43,962.00 | $52,318.40 | $67,361.20 | $81,994.00 |
| North Dakota | $27,249.20 | $35,605.60 | $43,914.71 | $52,068.31 | $66,705.51 | $80,932.71 |
| South Dakota | $27,249.20 | $35,605.60 | $43,962.00 | $52,318.40 | $67,361.20 | $81,994.00 |
| Tennessee | $27,249.20 | $35,605.60 | $43,962.00 | $52,318.40 | $67,361.20 | $81,994.00 |
| Texas | $27,249.20 | $35,605.60 | $43,962.00 | $52,318.40 | $67,361.20 | $81,994.00 |
| Washington | $27,249.20 | $35,605.60 | $43,962.00 | $52,318.40 | $67,361.20 | $81,994.00 |
| Wyoming | $27,249.20 | $35,605.60 | $43,962.00 | $52,318.40 | $67,361.20 | $81,994.00 |
| Ohio | $26,775.57 | $34,845.97 | $42,916.37 | $50,986.77 | $65,457.57 | $79,518.37 |
| New Jersey | $26,773.20 | $34,799.70 | $42,581.50 | $50,363.30 | $64,187.61 | $77,495.45 |
| California | $26,637.27 | $34,574.71 | $42,307.11 | $49,942.35 | $63,184.96 | $75,883.36 |
| Arizona | $26,469.20 | $34,565.60 | $42,662.00 | $50,758.40 | $65,281.20 | $79,394.00 |
| West Virginia | $26,420.78 | $34,431.58 | $42,349.10 | $50,257.98 | $64,348.14 | $78,028.30 |
| South Carolina | $26,589.68 | $34,404.24 | $42,218.80 | $50,033.36 | $63,992.48 | $77,541.60 |
| Arkansas | $26,452.40 | $34,403.20 | $42,354.00 | $50,304.80 | $64,536.40 | $78,358.00 |
| Indiana | $26,328.80 | $34,378.40 | $42,428.00 | $50,477.60 | $64,906.80 | $78,926.00 |
| Louisiana | $26,313.20 | $34,357.60 | $42,402.00 | $50,446.40 | $64,865.20 | $78,874.00 |
| Mississippi | $26,401.20 | $34,341.60 | $42,282.00 | $50,222.40 | $64,433.20 | $78,234.00 |
| Pennsylvania | $26,291.36 | $34,328.48 | $42,365.60 | $50,402.72 | $64,806.96 | $78,801.20 |
| Vermont | $26,204.00 | $34,212.00 | $42,135.50 | $49,805.50 | $63,475.50 | $76,735.50 |
| Kentucky | $26,157.20 | $34,149.60 | $42,142.00 | $50,134.40 | $64,449.20 | $78,354.00 |
| New Mexico | $26,182.60 | $34,059.40 | $41,927.00 | $49,794.60 | $63,826.40 | $77,440.00 |
| Rhode Island | $26,079.20 | $34,045.60 | $42,012.00 | $49,978.40 | $64,229.70 | $77,874.50 |
| Iowa | $26,063.60 | $34,024.80 | $41,986.00 | $49,947.20 | $64,199.60 | $78,042.00 |
| Nebraska | $26,130.47 | $34,013.67 | $41,896.87 | $49,780.07 | $63,876.47 | $77,562.87 |
| Connecticut | $26,095.20 | $33,983.60 | $41,852.00 | $49,636.40 | $63,535.20 | $77,004.00 |
| Oklahoma | $26,059.95 | $33,948.35 | $41,836.75 | $49,725.15 | $63,831.95 | $77,528.75 |
| North Carolina | $26,004.32 | $33,945.76 | $41,887.20 | $49,828.64 | $64,041.52 | $77,844.40 |
| Wisconsin | $26,012.39 | $33,911.19 | $41,809.54 | $49,614.74 | $63,555.14 | $77,085.54 |
| Michigan | $25,923.20 | $33,837.60 | $41,752.00 | $49,666.40 | $63,825.20 | $77,574.00 |
| Missouri | $25,963.43 | $33,831.03 | $41,698.63 | $49,566.23 | $63,631.43 | $77,286.63 |
| Colorado | $25,876.40 | $33,775.20 | $41,674.00 | $49,572.80 | $63,700.40 | $77,418.00 |
| Utah | $25,860.80 | $33,754.40 | $41,648.00 | $49,541.60 | $63,658.80 | $77,366.00 |
| Delaware | $25,904.10 | $33,683.30 | $41,462.50 | $49,216.50 | $62,886.50 | $76,146.50 |
| Maryland | $25,819.70 | $33,682.10 | $41,544.50 | $49,406.90 | $63,461.70 | $77,096.50 |
| Montana | $25,782.80 | $33,650.40 | $41,475.25 | $49,244.05 | $63,111.65 | $76,569.25 |
| Alabama | $25,729.20 | $33,565.60 | $41,402.00 | $49,238.40 | $63,241.20 | $76,834.00 |
| Illinois | $25,704.80 | $33,546.40 | $41,388.00 | $49,229.60 | $63,242.80 | $76,846.00 |
| Georgia | $25,692.32 | $33,529.76 | $41,367.20 | $49,204.64 | $63,209.52 | $76,804.40 |
| Hawaii | $25,900.40 | $33,527.20 | $41,118.80 | $48,684.80 | $62,146.80 | $75,198.80 |
| Massachusetts | $25,689.20 | $33,525.60 | $41,362.00 | $49,198.40 | $63,201.20 | $76,794.00 |
| New York | $25,729.40 | $33,524.20 | $41,319.00 | $49,113.80 | $63,020.65 | $76,426.25 |
| Virginia | $25,712.70 | $33,471.10 | $41,229.50 | $48,987.90 | $62,834.70 | $76,271.50 |
| Idaho | $25,595.60 | $33,400.80 | $41,206.00 | $49,011.20 | $62,951.60 | $76,482.00 |
| Kansas | $25,595.64 | $33,371.72 | $41,147.80 | $48,923.88 | $62,806.04 | $76,278.20 |
| Minnesota | $25,580.00 | $33,259.79 | $40,908.99 | $48,558.19 | $62,186.59 | $75,404.99 |
| Maine | $25,403.50 | $33,057.90 | $40,712.30 | $48,366.70 | $61,932.10 | $75,077.70 |
| Oregon | $24,838.20 | $32,284.60 | $39,731.00 | $47,177.40 | $60,400.20 | $73,213.00 |
A few anchors for the most common questions:
- $15 an hour is $31,200.00 a year gross. You keep $27,249.20 in a state with no wage tax and $24,838.20 in Oregon. The average across all 50 states is $26,264.70.
- $20 an hour averages $34,241.20 after tax across the states, or $16.46 per hour worked.
- $25 an hour is $52,000.00 gross and $42,201.43 after tax on average, with a range from $39,731.00 to $43,962.00.
- $30 an hour is $62,400.00 gross. A single filer keeps $52,318.40 in a no-income-tax state, about $4,359.87 a month.
- $40 an hour is $83,200.00 gross and $64,348.53 after tax on average.
- $50 an hour is $104,000.00 gross, and take-home runs from $73,213.00 to $81,994.00.
Why your hourly rate shrinks more as it rises
At $15 an hour, a worker in a no-income-tax state keeps 87.3% of gross pay. At $50 an hour that share falls to 78.8%. Two things drive it.
The first is the federal standard deduction. It shields the first $16,100 of a single filer's income whatever you earn, so it covers a bigger slice of a small paycheck than a large one. The second is the bracket system. As pay rises, more of it lands in the 12% and then the 22% federal bracket. Social Security and Medicare, by contrast, take the same share of every wage dollar at these income levels, so they don't explain the drop.
State income tax adds to the slide in most places. In the lowest-ranked state, the share kept falls from 79.6% at $15 an hour to 70.4% at $50.
The 9 states that leave hourly pay alone
Alaska, Florida, Nevada, New Hampshire, South Dakota, Tennessee, Texas, Washington and Wyoming don't tax wages, so all of them tie at the top of every column. At $20 an hour, workers there take home $35,605.60 a year. The only deductions are federal income tax and FICA.
The dollar gap to the lowest state widens as pay rises: $2,411.00 a year at $15 an hour, $3,321.00 at $20, $5,141.00 at $30 and $8,781.00 at $50. Most of that gap is state income tax. In Oregon the calculator puts state tax on $50 an hour at $8,780.98 a year, although, as explained above, that figure runs high because Oregon's deduction and credit aren't applied.
A state with no income tax isn't automatically cheaper to live in. States that skip the wage tax still need revenue, and several collect more through sales or property taxes. Rent usually matters more than any tax line for an hourly worker, so weigh both before you move for a paycheck.
Converting an hourly wage to a yearly salary
The quick math is your hourly rate times 2,080, which assumes 40 hours a week and 52 paid weeks. That's how the calculators get gross pay, and it's why $20 an hour is $41,600.00. If you take unpaid time off, work part time, or get overtime, your real yearly figure will differ.
Overtime doesn't fit this table because the calculators pay every hour at the rate you enter. Our article on overtime after tax covers time and a half and the federal overtime deduction separately.
What would change your number
These figures assume no deductions, so they overstate the paycheck for anyone who pays for workplace benefits out of their wages. Health insurance taken out before tax lowers your income tax but also your paycheck. A 401(k) contribution does the same. Filing as head of household or married filing jointly would lower federal tax, and the state calculators only support single and joint returns.
Your employer's withholding may also differ from the tax these calculators work out. Withholding depends on your W-4 and your state's withholding form, while these figures estimate the tax itself. Any difference comes back as a refund or a bill when you file.
Run your own hourly numbers
Open the paycheck calculator or your state's own page, such as the Texas paycheck calculator, the California paycheck calculator or the New York paycheck calculator. Choose Hourly as the pay type, enter your rate and weekly hours, and add any 401(k) or insurance deductions. Each state page lists the rules it leaves out for that state, which is worth a read before you budget around the result.