How far does $100,000 go in each US state after tax and living costs?
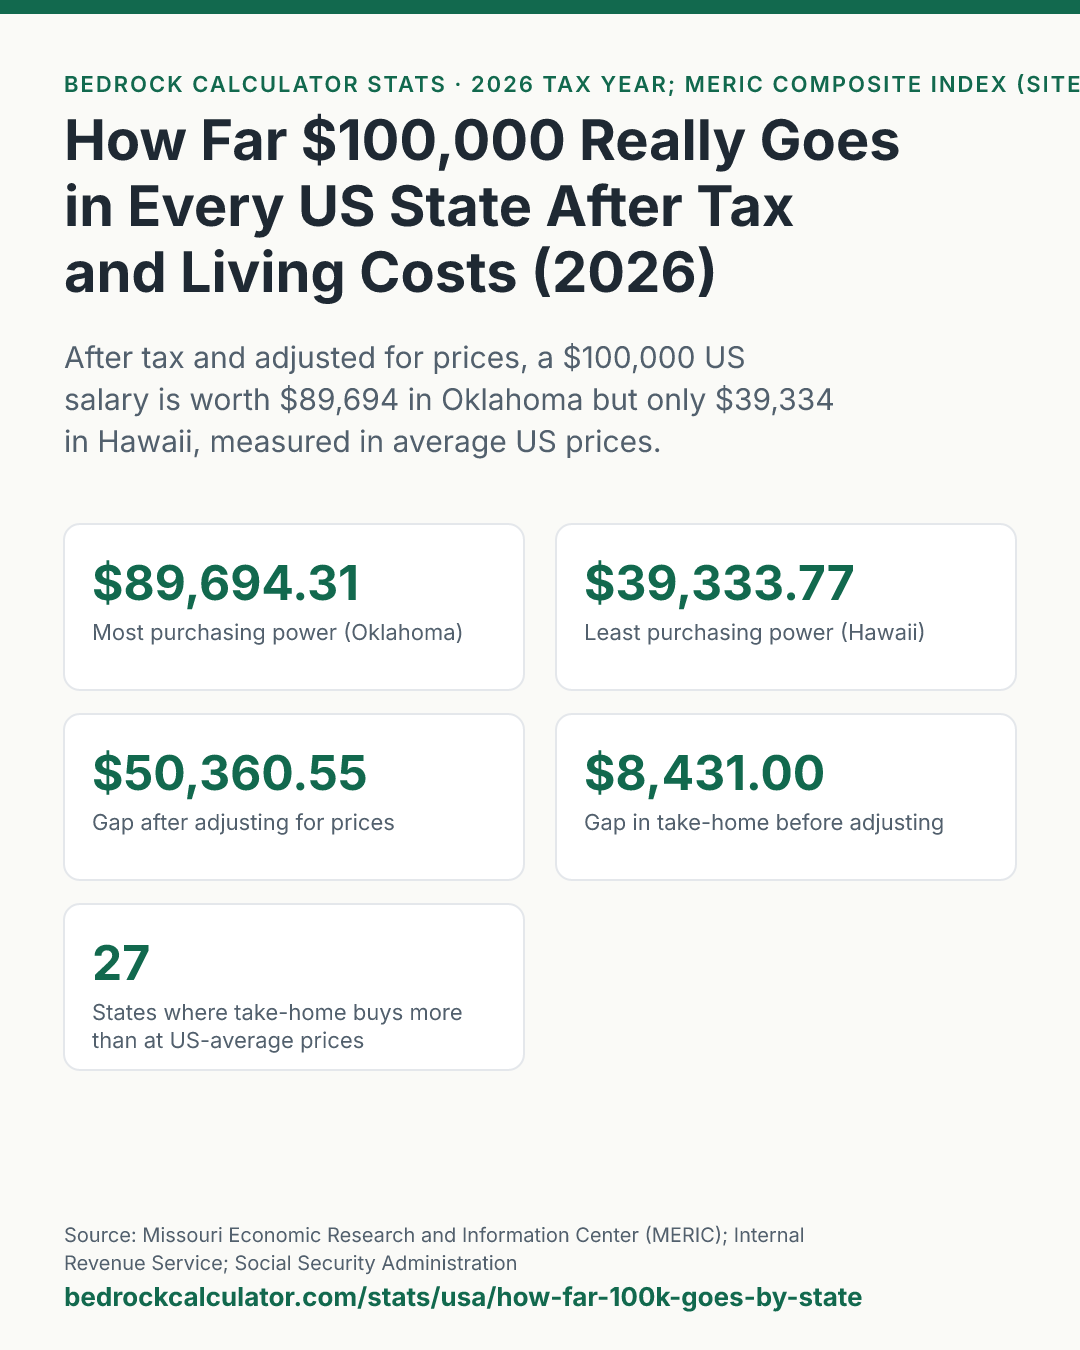
A $100,000 salary is the same number on every offer letter in the US, but it doesn't buy the same life. After tax, a single filer keeps between $70,749.00 and $79,180.00 depending on the state, a gap of $8,431.00. Prices change the picture far more than taxes do.
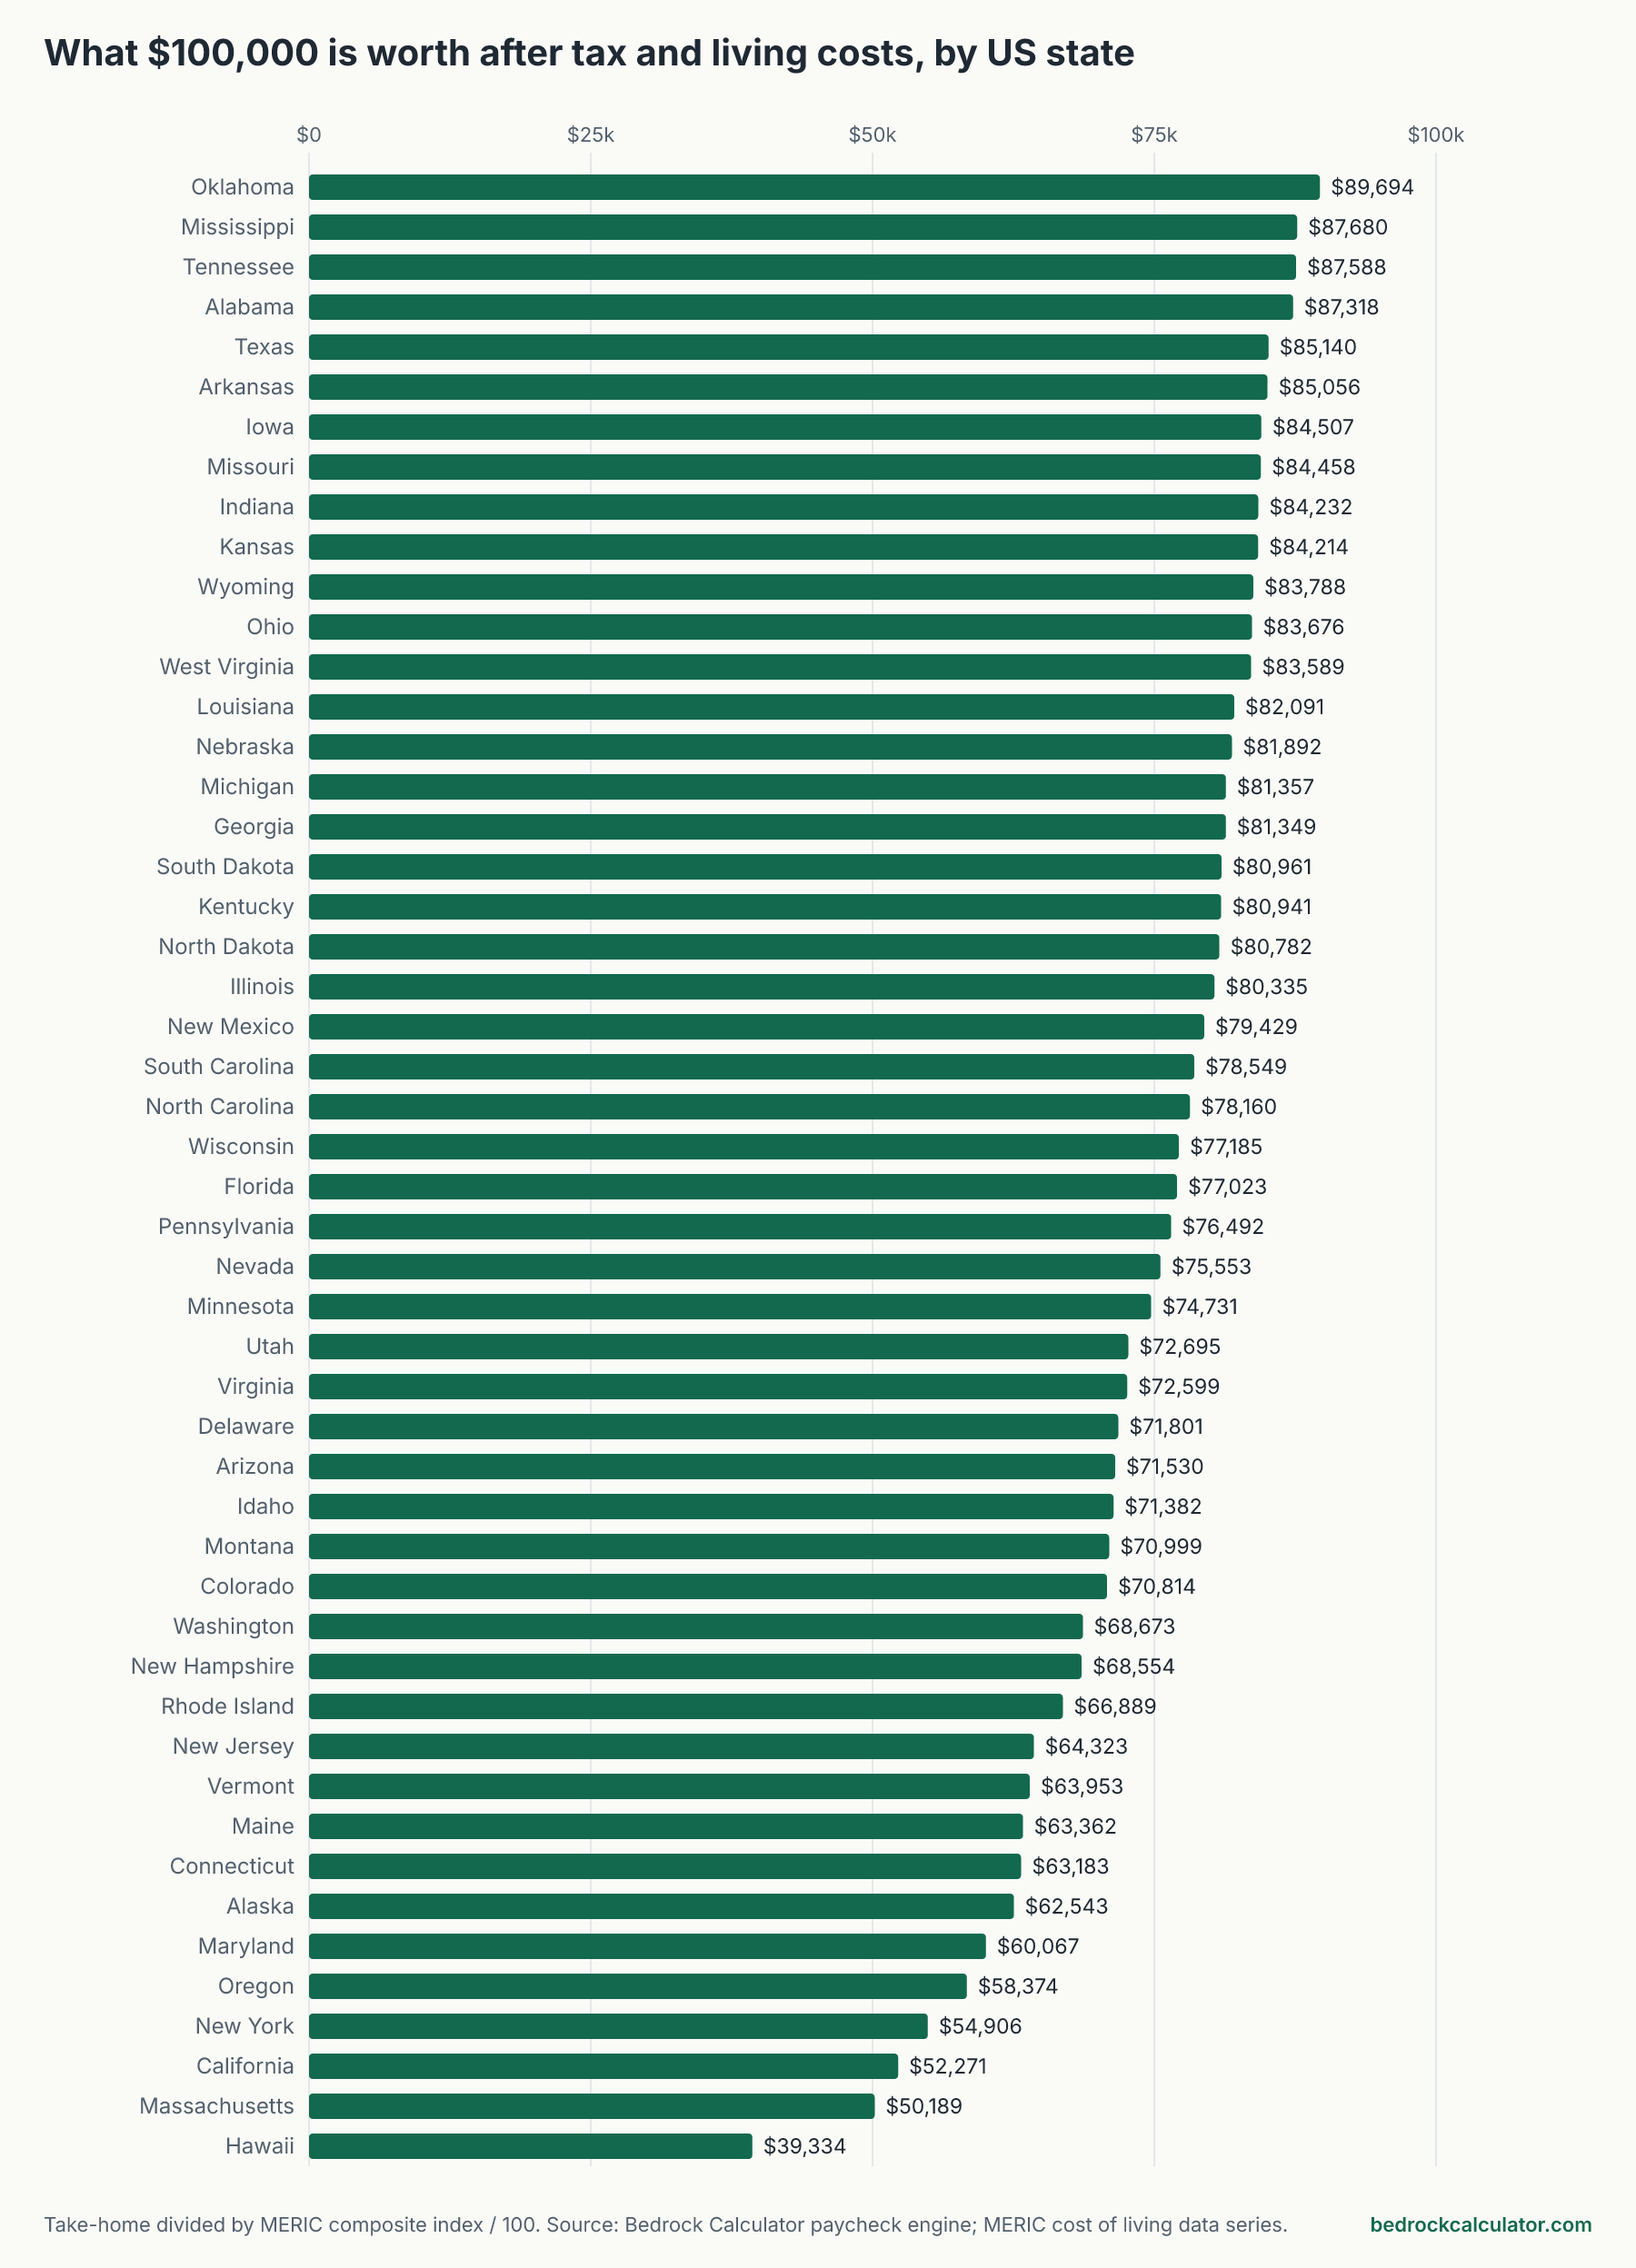
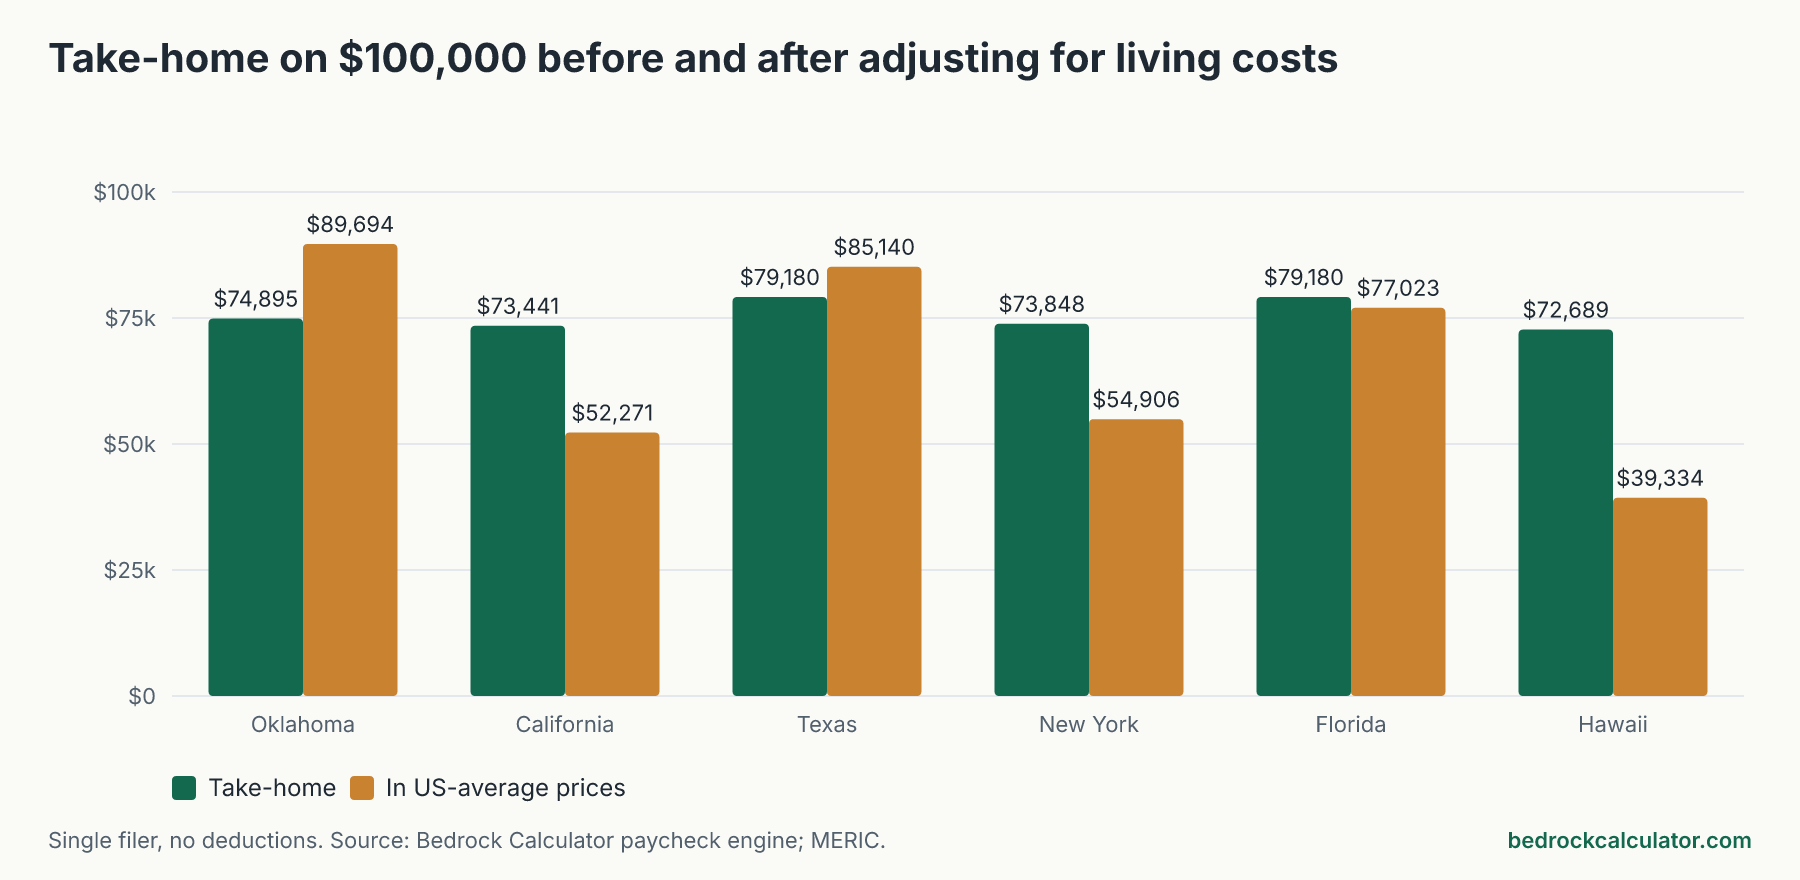
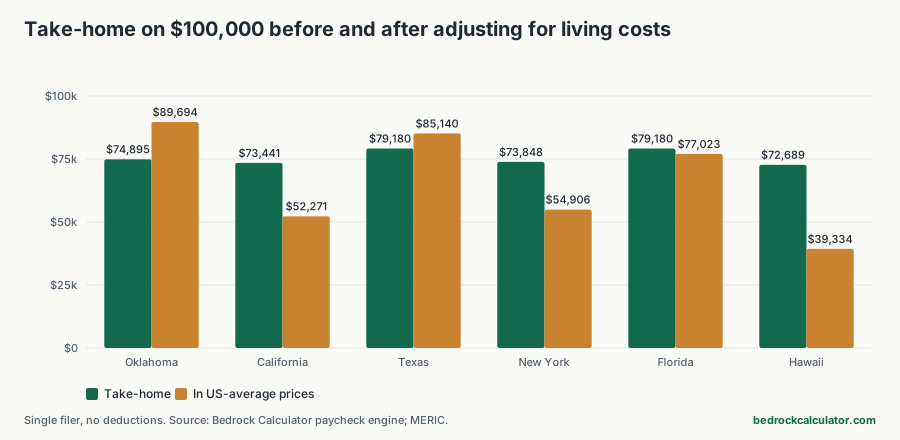
Adjust each state's take-home for its living costs and the spread jumps to $50,360.55. In Oklahoma, $100,000 leaves $74,894.75 after tax, which buys what $89,694.31 would at average US prices. In Hawaii, the take-home is $72,688.80, but it buys only what $39,333.77 would.
How we worked out these numbers
This is two calculations, both from tools on this site.
First, take-home pay. We ran the paycheck calculator for every state on a $100,000 salary, for a single filer paid every two weeks with no 401(k) or other deductions. It applies 2026 federal income tax, Social Security, Medicare and each state's income tax.
Second, prices. We divided each state's take-home by its cost of living index from MERIC, the Missouri Economic Research and Information Center, where the US average is 100. A state at 120 has prices a fifth above average, so its take-home is divided by 1.2. The result is what your paycheck is worth in average US prices. It's the same simple ratio the cost of living calculator uses, with no weighting by category.
Every state, before and after living costs
Sort by any column. The last column is the one to compare: it puts every state's take-home in the same prices.
What a $100,000 salary is worth after tax and prices, by state (2026)
Download CSVTake-home from the paycheck calculator (single filer, no deductions), divided by the MERIC composite index / 100. Adjusted figures are in US-average prices.
| Oklahoma | $74,894.75 | $4,285.25 | 83.5 | $89,694.31 |
| Mississippi | $75,580.00 | $3,600.00 | 86.2 | $87,679.81 |
| Tennessee | $79,180.00 | $0.00 | 90.4 | $87,588.50 |
| Alabama | $74,220.00 | $4,960.00 | 85 | $87,317.65 |
| Texas | $79,180.00 | $0.00 | 93 | $85,139.78 |
| Arkansas | $75,700.00 | $3,480.00 | 89 | $85,056.18 |
| Iowa | $75,380.00 | $3,800.00 | 89.2 | $84,506.73 |
| Missouri | $74,660.63 | $4,519.37 | 88.4 | $84,457.73 |
| Indiana | $76,230.00 | $2,950.00 | 90.5 | $84,232.04 |
| Kansas | $73,687.40 | $5,492.60 | 87.5 | $84,214.17 |
| Wyoming | $79,180.00 | $0.00 | 94.5 | $83,788.36 |
| Ohio | $76,814.37 | $2,365.63 | 91.8 | $83,675.78 |
| West Virginia | $75,397.50 | $3,782.50 | 90.2 | $83,589.25 |
| Louisiana | $76,180.00 | $3,000.00 | 92.8 | $82,090.52 |
| Nebraska | $74,930.87 | $4,249.13 | 91.5 | $81,891.66 |
| Michigan | $74,930.00 | $4,250.00 | 92.1 | $81,357.22 |
| Georgia | $74,190.00 | $4,990.00 | 91.2 | $81,348.68 |
| South Dakota | $79,180.00 | $0.00 | 97.8 | $80,961.15 |
| Kentucky | $75,680.00 | $3,500.00 | 93.5 | $80,941.18 |
| North Dakota | $78,196.71 | $983.29 | 96.8 | $80,781.73 |
| Illinois | $74,230.00 | $4,950.00 | 92.4 | $80,335.50 |
| New Mexico | $74,822.00 | $4,358.00 | 94.2 | $79,428.87 |
| South Carolina | $74,936.00 | $4,244.00 | 95.4 | $78,549.27 |
| North Carolina | $75,190.00 | $3,990.00 | 96.2 | $78,160.08 |
| Wisconsin | $74,483.54 | $4,696.46 | 96.5 | $77,185.02 |
| Florida | $79,180.00 | $0.00 | 102.8 | $77,023.35 |
| Pennsylvania | $76,110.00 | $3,070.00 | 99.5 | $76,492.46 |
| Nevada | $79,180.00 | $0.00 | 104.8 | $75,553.44 |
| Minnesota | $72,862.99 | $6,317.01 | 97.5 | $74,731.27 |
| Utah | $74,730.00 | $4,450.00 | 102.8 | $72,694.55 |
| Virginia | $73,687.50 | $5,492.50 | 101.5 | $72,598.52 |
| Delaware | $73,596.50 | $5,583.50 | 102.5 | $71,801.46 |
| Arizona | $76,680.00 | $2,500.00 | 107.2 | $71,529.85 |
| Idaho | $73,880.00 | $5,300.00 | 103.5 | $71,381.64 |
| Montana | $73,981.25 | $5,198.75 | 104.2 | $70,999.28 |
| Colorado | $74,780.00 | $4,400.00 | 105.6 | $70,814.39 |
| Washington | $79,180.00 | $0.00 | 115.3 | $68,673.03 |
| New Hampshire | $79,180.00 | $0.00 | 115.5 | $68,554.11 |
| Rhode Island | $75,250.50 | $3,929.50 | 112.5 | $66,889.33 |
| New Jersey | $74,936.25 | $4,243.75 | 116.5 | $64,322.96 |
| Vermont | $74,185.50 | $4,994.50 | 116 | $63,953.02 |
| Maine | $72,549.70 | $6,630.30 | 114.5 | $63,362.18 |
| Connecticut | $74,430.00 | $4,750.00 | 117.8 | $63,183.36 |
| Alaska | $79,180.00 | $0.00 | 126.6 | $62,543.44 |
| Maryland | $74,482.50 | $4,697.50 | 124 | $60,066.53 |
| Oregon | $70,749.00 | $8,431.00 | 121.2 | $58,373.76 |
| New York | $73,848.25 | $5,331.75 | 134.5 | $54,905.76 |
| California | $73,441.36 | $5,738.64 | 140.5 | $52,271.43 |
| Massachusetts | $74,180.00 | $5,000.00 | 147.8 | $50,189.45 |
| Hawaii | $72,688.80 | $6,491.20 | 184.8 | $39,333.77 |
Where $100,000 stretches furthest
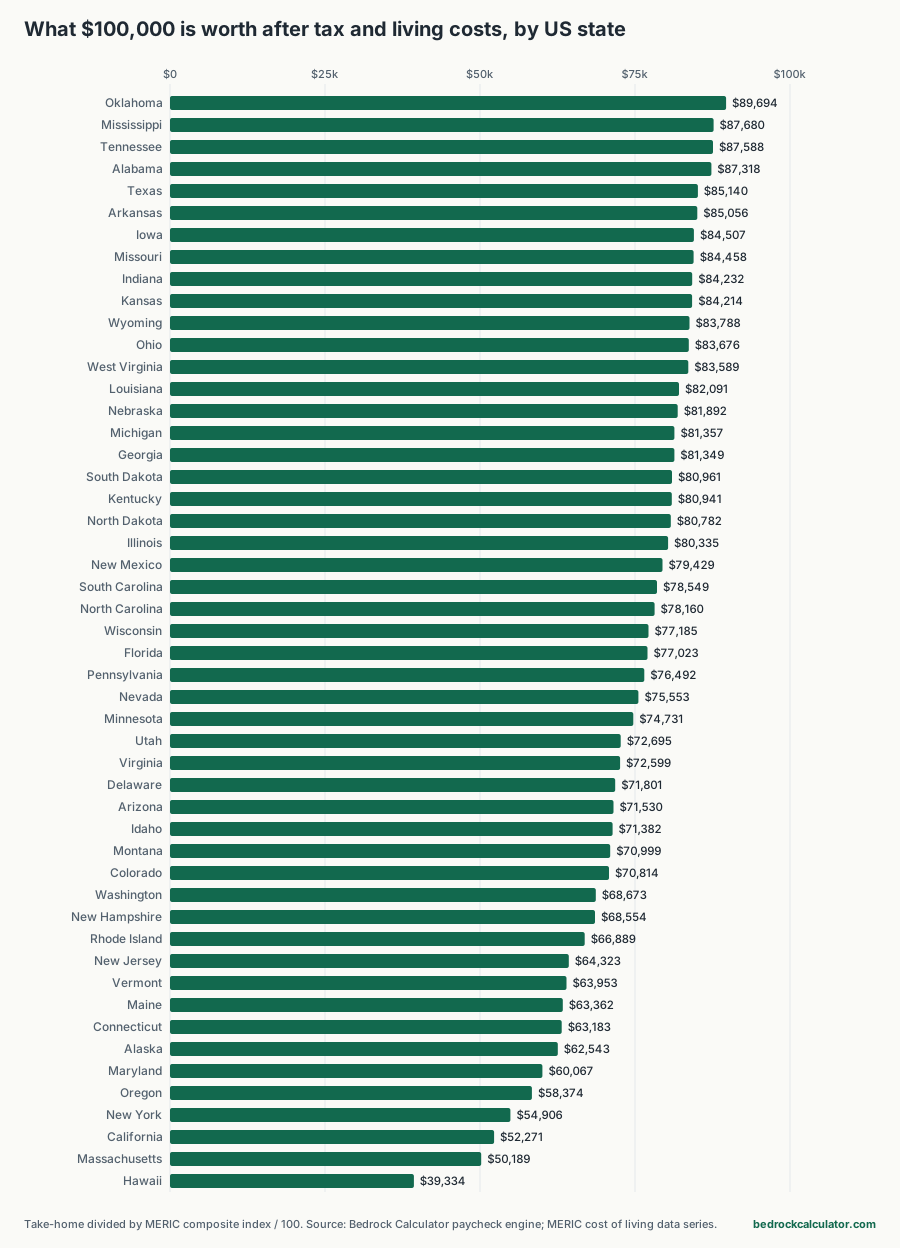
The top five states once prices are counted are Oklahoma, Mississippi, Tennessee, Alabama and Texas. Their state income taxes differ, but they share one thing: housing and everyday costs well below the national average.
At the bottom are Hawaii, Massachusetts, California, New York and Oregon. In Hawaii, living costs run at 184.8 on the index, so a take-home of $72,688.80, a little under the 50-state average of $75,480.08, shrinks to $39,333.77 in average-price terms.
27 of the 50 states have prices below the US average, so a paycheck there buys more than the same dollars would at average prices.
Taxes matter less than prices
Compare Texas and California, the most common move people ask about. Before prices, the gap is $5,738.64: $79,180.00 in Texas against $73,441.36 in California. That's the effect of California's income tax. After prices, the gap grows to $32,868.35, because California's living costs are far higher. The tax difference is real, but it's the smaller part of the story.
The same goes the other way for some states with no income tax. Of the 9 states that don't tax wages, Alaska, New Hampshire and Washington still come in below the 50-state average take-home of $75,480.08 once prices are counted. Skipping the income tax doesn't make up for high housing costs there.
New York and Florida show the same split. New York's take-home is worth $54,905.76 in average prices, while Florida's is worth $77,023.35.
What this leaves out
This is a fair way to compare states, but it's a rough guide to your own situation, for a few reasons:
- One number per state. The cost of living index gives each state a single figure. A city and a small town in the same state can differ more than two states do.
- Your own spending. The index assumes an average household's mix. If you own your home outright, housing costs matter much less to you than the index assumes.
- Other taxes. Sales and property taxes aren't in the take-home figure, and they're not in the cost of living index either.
- State deductions and local income tax. The paycheck calculator applies each state's tax rates without state-specific deductions or credits, and leaves out city income taxes like New York City's.
- Pay differences. A job that pays $100,000 in one state might pay more or less in another. This compares the same salary everywhere.
Run your own numbers
This page keeps the salary fixed and asks what it buys. To flip the question and find the pay a job in each state must offer to match a given standard of living, see the salary each state needs to match a mid-range paycheck.
Put your own salary and deductions into the paycheck calculator, then compare the two states you're weighing in the cost of living calculator. The California paycheck calculator and Texas paycheck calculator explain each state's rules in more detail.