What salary matches $75,000 in an average-cost US state?
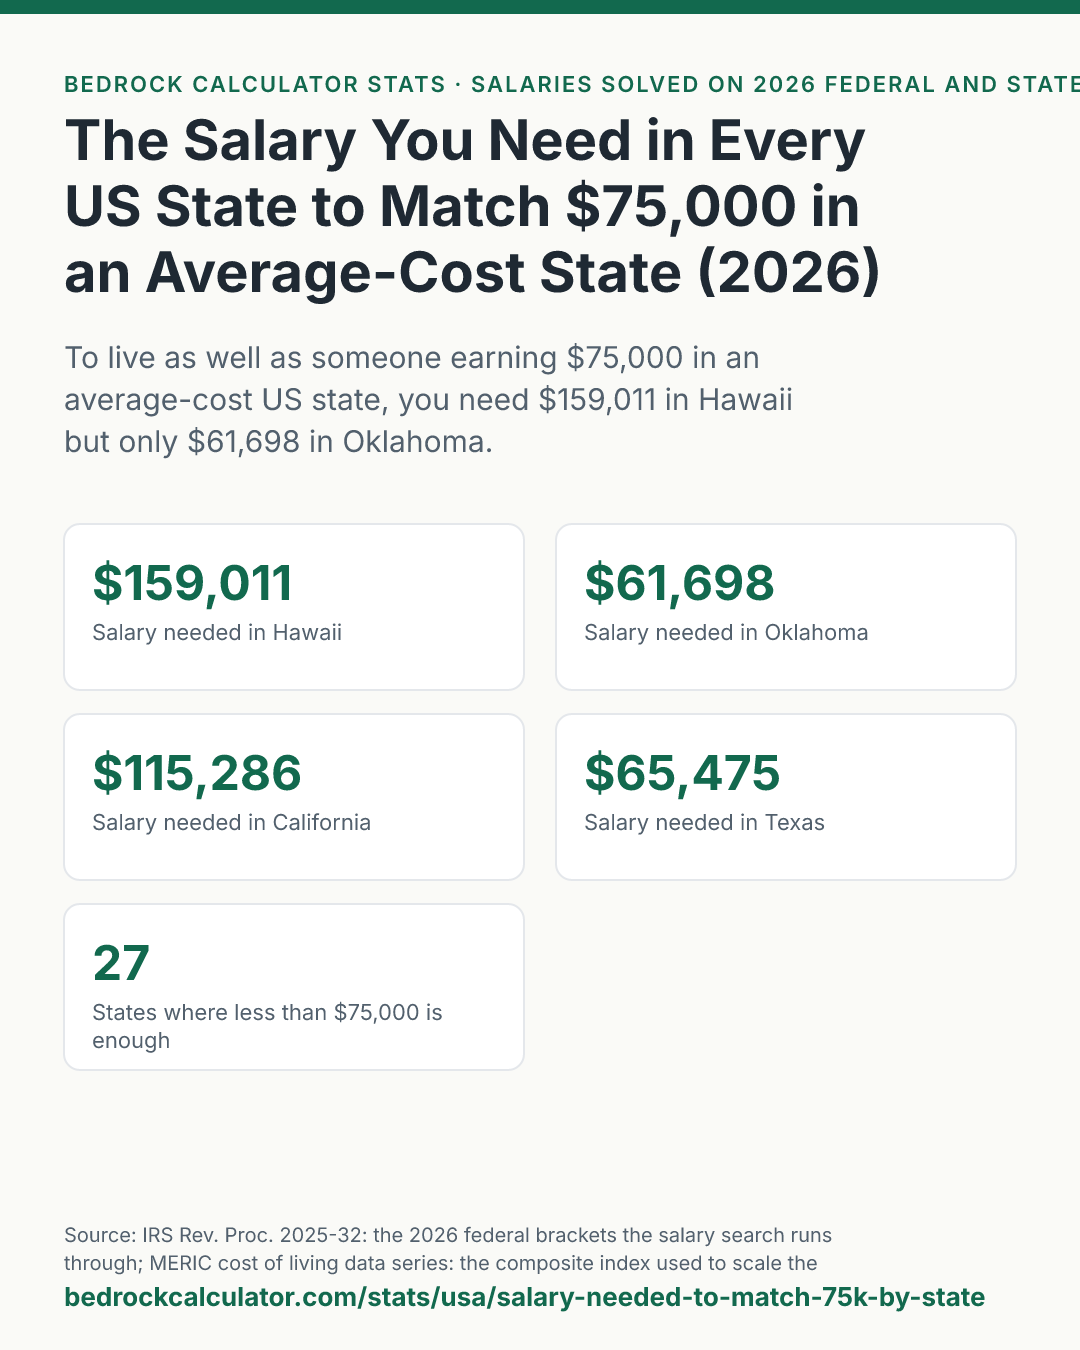
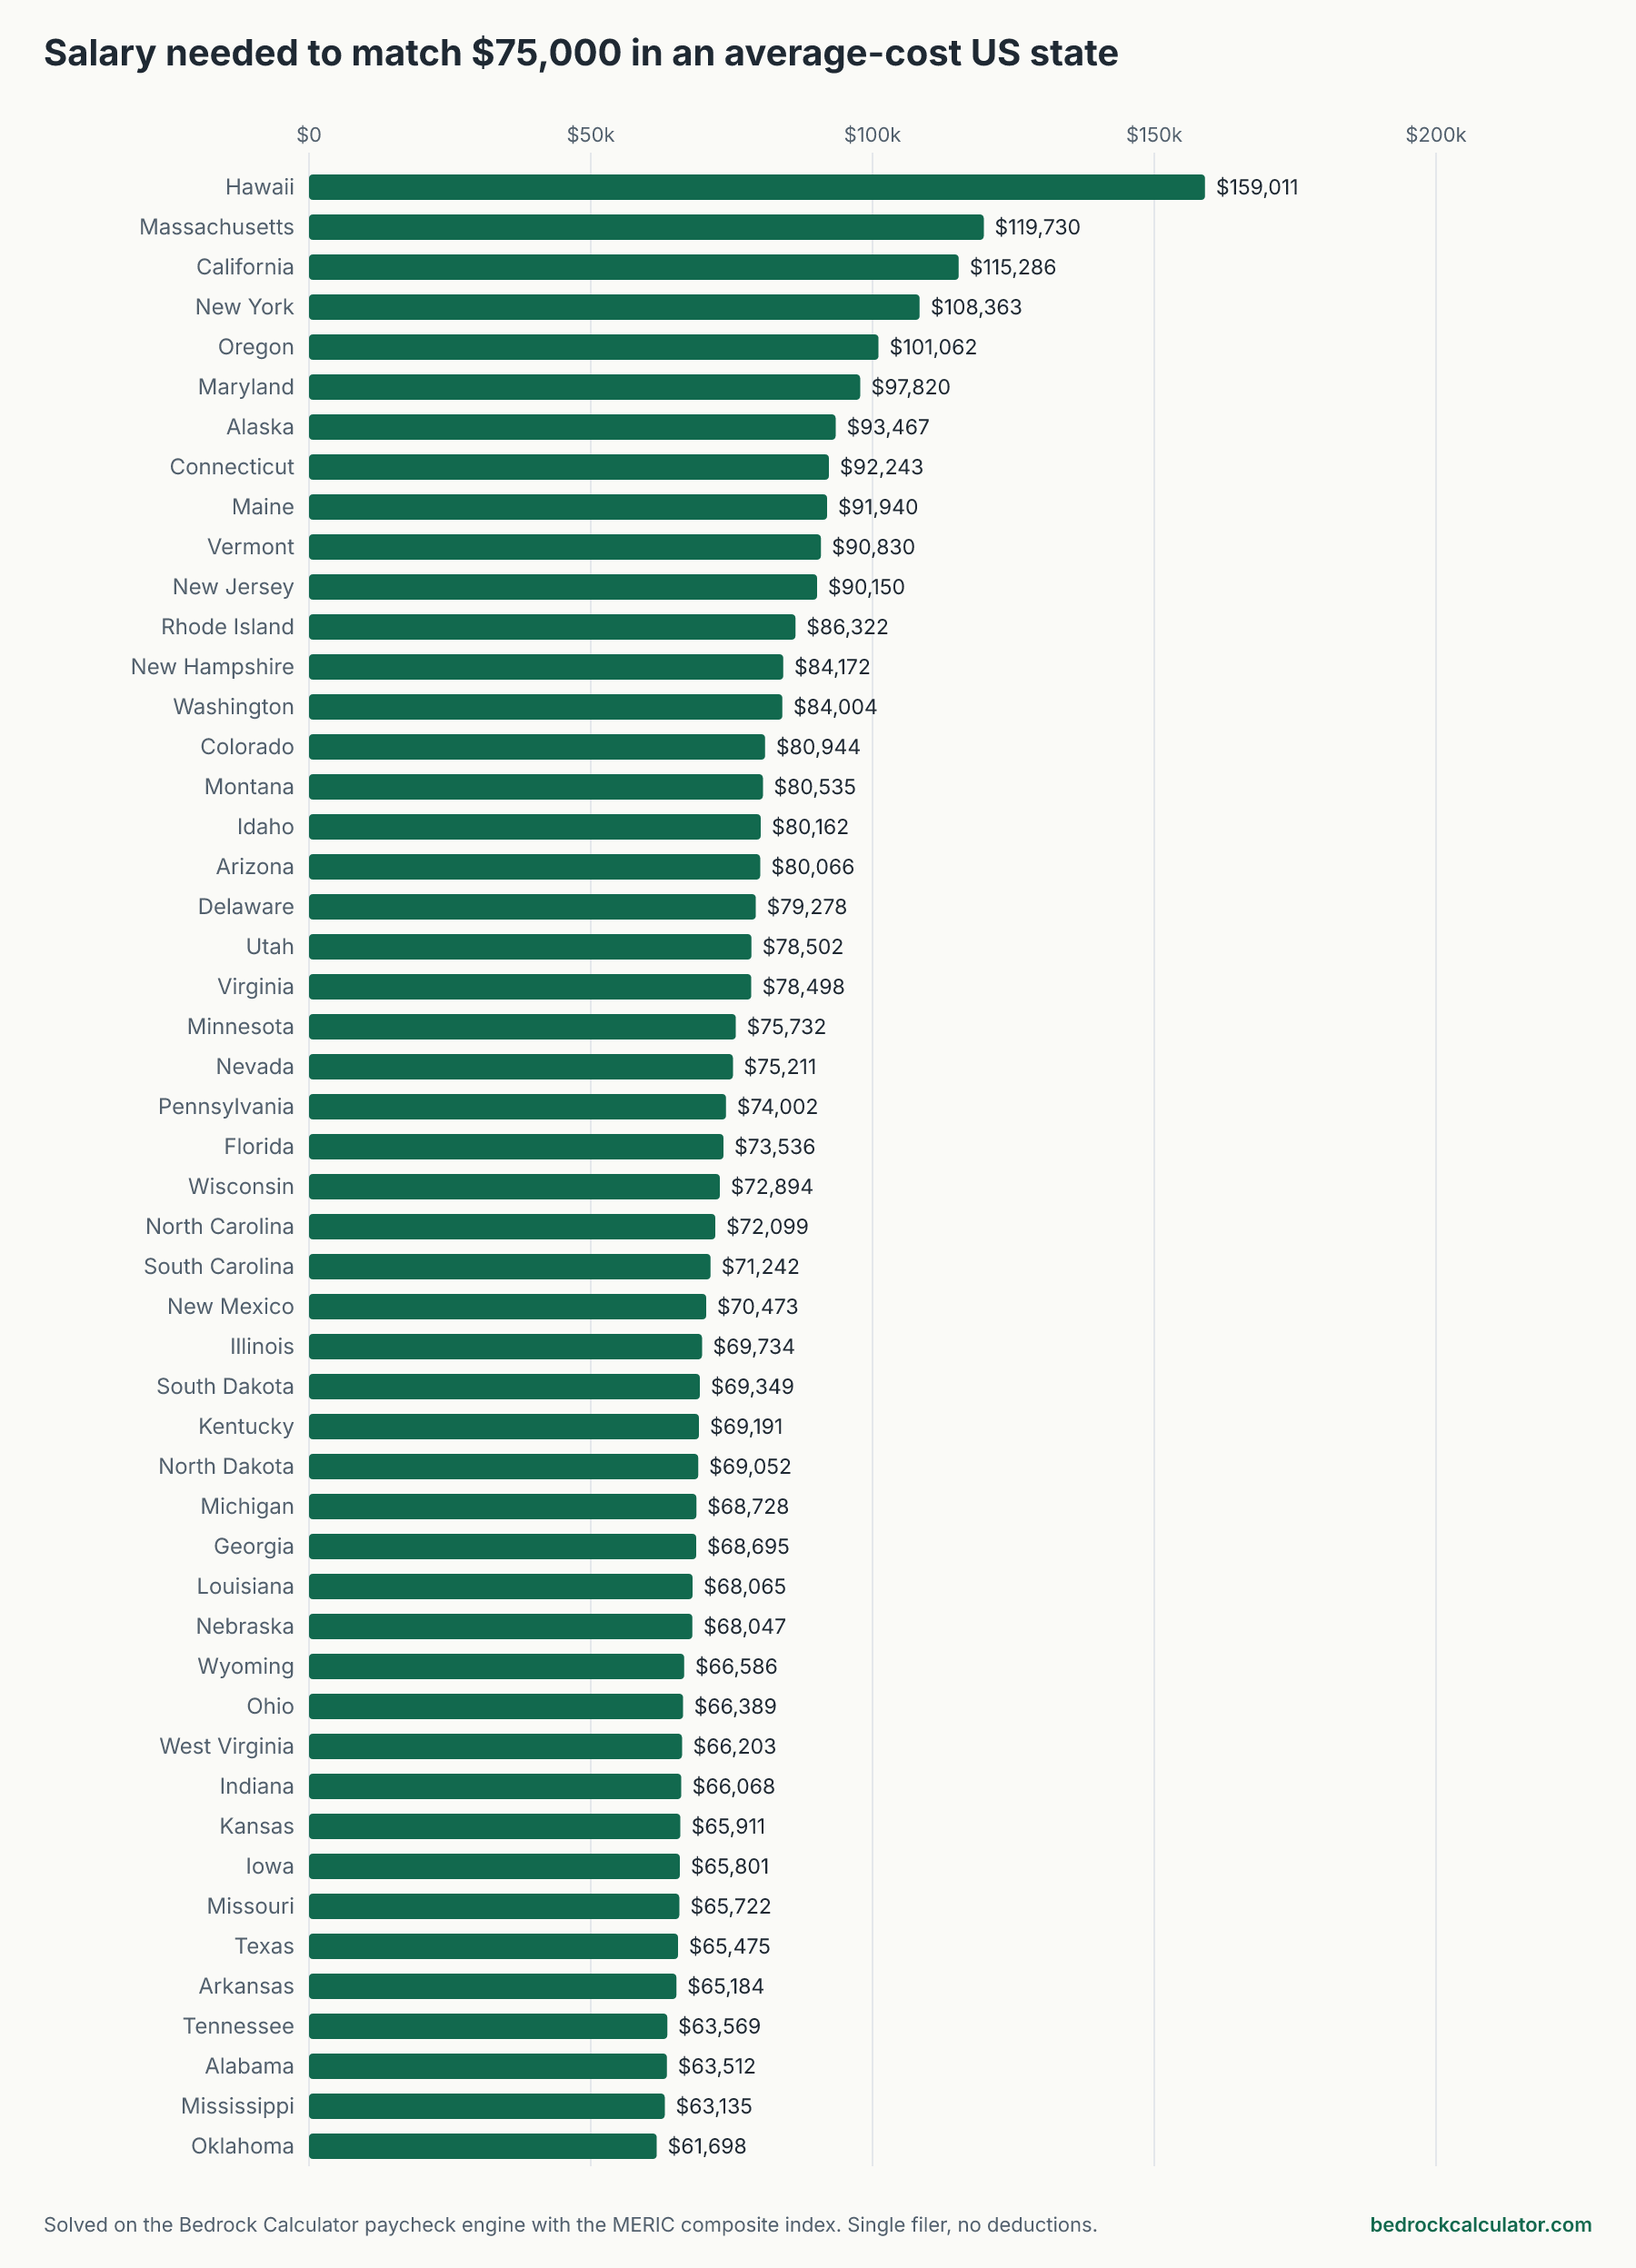
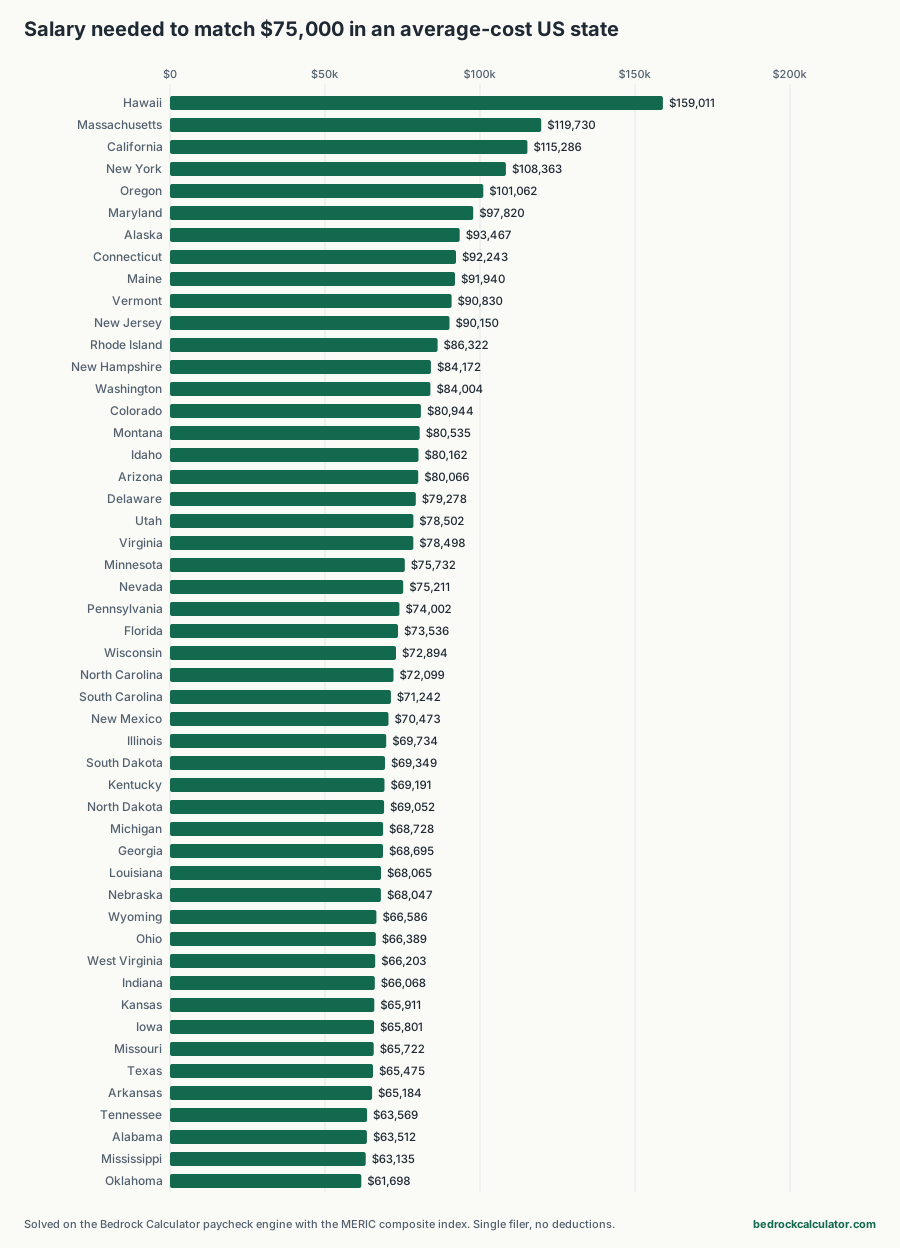
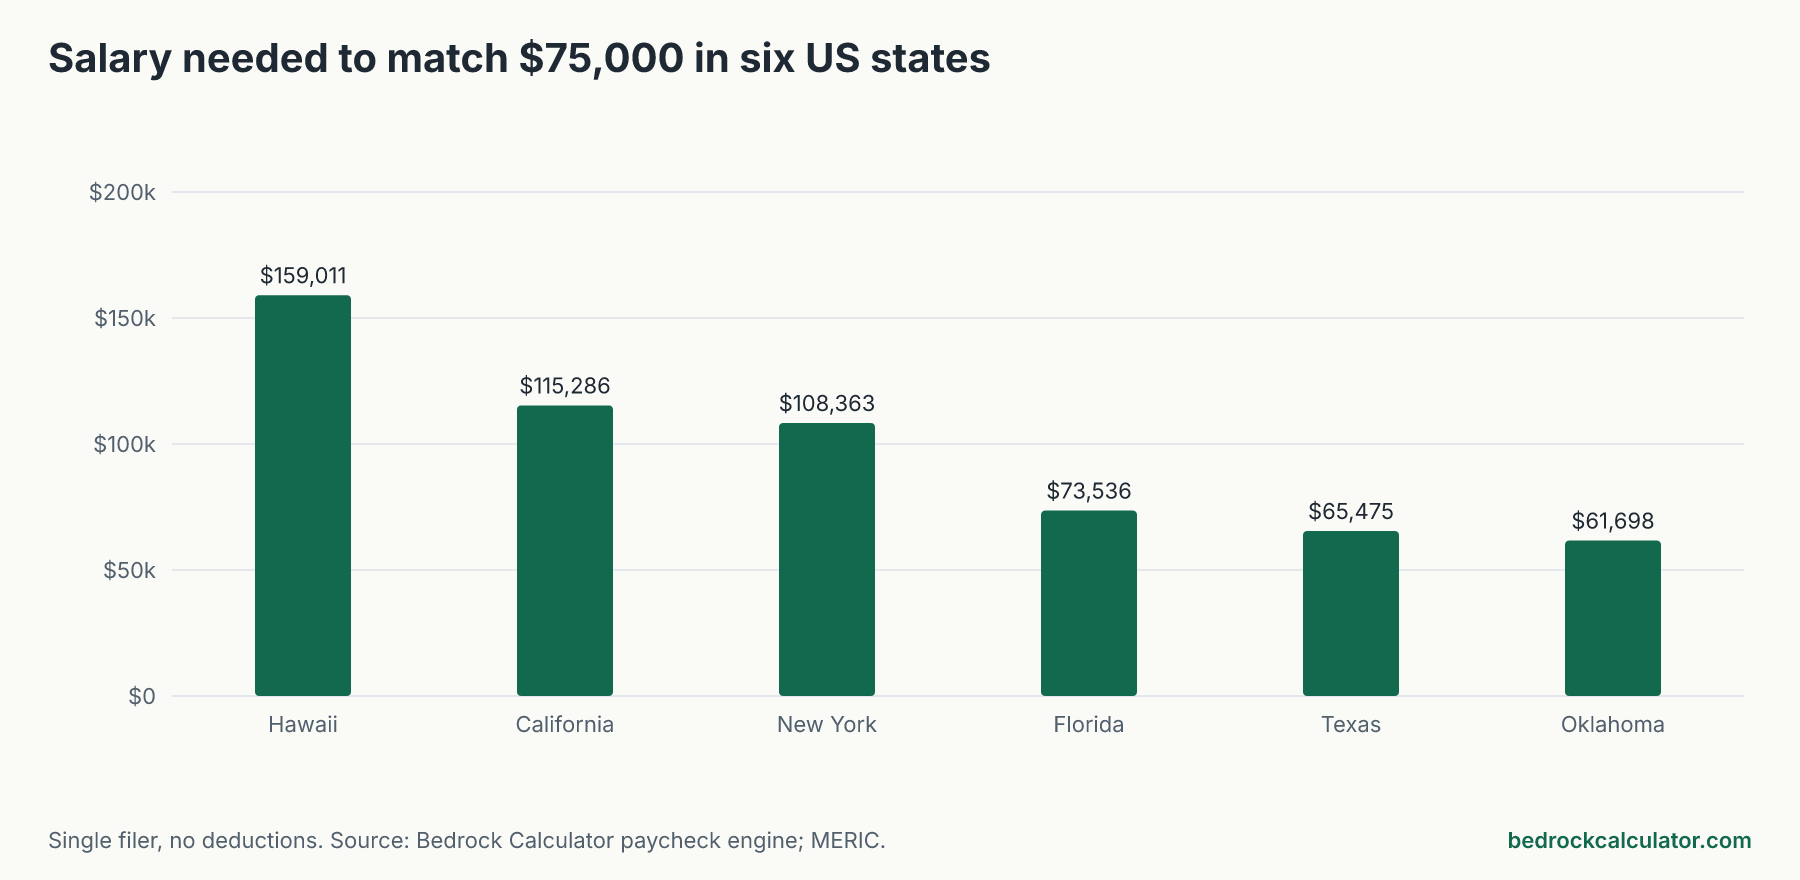
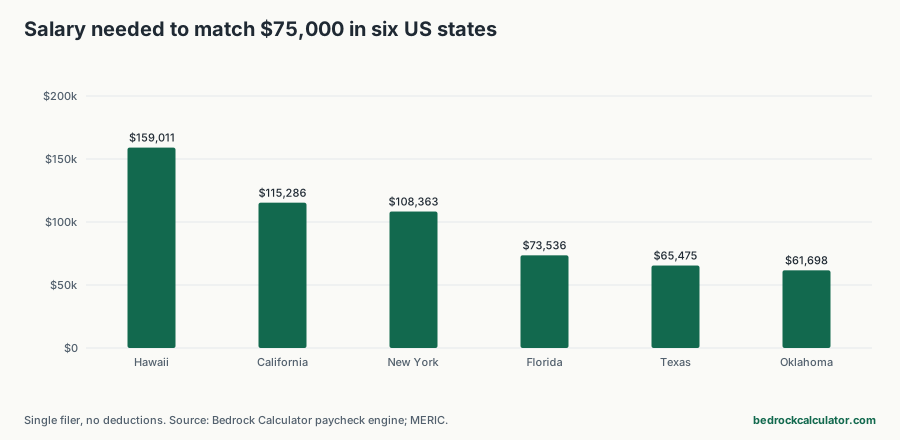
If you earn $75,000 somewhere with average US prices and an average state tax bill, how much would you need to earn to live just as well in another US state? The answer runs from about $61,698 in Oklahoma to about $159,011 in Hawaii.
In 27 states, less than $75,000 does the job, because prices are below average. In 5 states, Hawaii, Massachusetts, California, New York and Oregon, you'd need a six-figure salary to keep the same standard of living. California takes about $115,286, and Texas about $65,475.
This page answers a negotiating question
Most state comparisons hold the salary fixed and ask what it buys. This one turns it around and holds your standard of living fixed: it asks what a job offer in each state has to pay before the move leaves you no worse off. That's the number to bring to a relocation or remote-pay conversation. If instead you want to see how far one fixed salary stretches in each state, how far a six-figure salary goes in every state runs that calculation, and the two pages use the same price index.
The method in three steps
Step 1: a benchmark take-home. We put $75,000 through the site's paycheck calculator in all 50 states (single return, biweekly pay, no pre-tax or post-tax deductions) and took the average take-home, $58,913.30. Think of it as $75,000 after a middle-of-the-road state tax bill, spent at prices of exactly 100 on the MERIC cost of living index.
Step 2: the take-home each state requires. Multiply the benchmark by the state's index over 100. Prices a fifth above average call for a fifth more take-home.
Step 3: the salary that produces it. Tax isn't a fixed share of pay, so the salary can't be found by simple division. We searched for it on the paycheck calculator itself, halving the range each time until it was under a cent wide, then ran the calculator once more on the answer to confirm the take-home. Salaries are rounded to whole dollars.
You can reproduce any row: enter the salary from the table as a single filer with both deduction fields at zero, and the paycheck calculator returns the "take-home needed" figure to within the dollar rounding.
The salary you need in every state
Sort by any column. "Versus $75,000" shows how much more or less you'd need.
Salary needed to match $75,000 in an average-cost state, by state (2026)
Download CSVTarget take-home = 50-state average take-home on $75,000 x (MERIC composite / 100). Salary solved on the paycheck calculator: single filer, no deductions.
| Hawaii | 184.8 | $108,871.78 | $159,011 | $84,011 | $11,078.05 |
| Massachusetts | 147.8 | $87,073.86 | $119,730 | $44,730 | $5,986.52 |
| California | 140.5 | $82,773.19 | $115,286 | $40,286 | $7,160.19 |
| New York | 134.5 | $79,238.39 | $108,363 | $33,363 | $5,825.18 |
| Oregon | 121.2 | $71,402.92 | $101,062 | $26,062 | $8,523.89 |
| Maryland | 124 | $73,052.49 | $97,820 | $22,820 | $4,593.96 |
| Alaska | 126.6 | $74,584.24 | $93,467 | $18,467 | $0.00 |
| Connecticut | 117.8 | $69,399.87 | $92,243 | $17,243 | $4,323.39 |
| Maine | 114.5 | $67,455.73 | $91,940 | $16,940 | $6,054.01 |
| Vermont | 116 | $68,339.43 | $90,830 | $15,830 | $4,389.26 |
| New Jersey | 116.5 | $68,634.00 | $90,150 | $15,150 | $3,616.28 |
| Rhode Island | 112.5 | $66,277.47 | $86,322 | $11,322 | $3,279.78 |
| New Hampshire | 115.5 | $68,044.86 | $84,172 | $9,172 | $0.00 |
| Washington | 115.3 | $67,927.04 | $84,004 | $9,004 | $0.00 |
| Colorado | 105.6 | $62,212.45 | $80,944 | $5,944 | $3,561.53 |
| Montana | 104.2 | $61,387.66 | $80,535 | $5,535 | $4,099.00 |
| Idaho | 103.5 | $60,975.27 | $80,162 | $5,162 | $4,248.58 |
| Arizona | 107.2 | $63,155.06 | $80,066 | $5,066 | $2,001.66 |
| Delaware | 102.5 | $60,386.13 | $79,278 | $4,278 | $4,215.84 |
| Utah | 102.8 | $60,562.87 | $78,502 | $3,502 | $3,493.34 |
| Virginia | 101.5 | $59,797.00 | $78,498 | $3,498 | $4,256.12 |
| Minnesota | 97.5 | $57,440.47 | $75,732 | $732 | $4,666.76 |
| Nevada | 104.8 | $61,741.14 | $75,211 | $211 | $0.00 |
| Pennsylvania | 99.5 | $58,618.74 | $74,002 | -$998 | $2,271.87 |
| Florida | 102.8 | $60,562.87 | $73,536 | -$1,464 | $0.00 |
| Wisconsin | 96.5 | $56,851.34 | $72,894 | -$2,106 | $3,259.86 |
| North Carolina | 96.2 | $56,674.60 | $72,099 | -$2,901 | $2,876.73 |
| South Carolina | 95.4 | $56,203.29 | $71,242 | -$3,758 | $2,745.73 |
| New Mexico | 94.2 | $55,496.33 | $70,473 | -$4,527 | $2,911.16 |
| Illinois | 92.4 | $54,435.89 | $69,734 | -$5,266 | $3,451.82 |
| South Dakota | 97.8 | $57,617.21 | $69,349 | -$5,651 | $0.00 |
| Kentucky | 93.5 | $55,083.94 | $69,191 | -$5,809 | $2,421.67 |
| North Dakota | 96.8 | $57,028.08 | $69,052 | -$5,948 | $379.80 |
| Michigan | 92.1 | $54,259.15 | $68,728 | -$6,272 | $2,920.94 |
| Georgia | 91.2 | $53,728.93 | $68,695 | -$6,305 | $3,427.87 |
| Louisiana | 92.8 | $54,671.54 | $68,065 | -$6,935 | $2,041.94 |
| Nebraska | 91.5 | $53,905.67 | $68,047 | -$6,953 | $2,795.26 |
| Wyoming | 94.5 | $55,673.07 | $66,586 | -$8,414 | $0.00 |
| Ohio | 91.8 | $54,082.41 | $66,389 | -$8,611 | $1,441.33 |
| West Virginia | 90.2 | $53,139.80 | $66,203 | -$8,797 | $2,234.61 |
| Indiana | 90.5 | $53,316.54 | $66,068 | -$8,932 | $1,949.00 |
| Kansas | 87.5 | $51,549.14 | $65,911 | -$9,089 | $3,590.44 |
| Iowa | 89.2 | $52,550.67 | $65,801 | -$9,199 | $2,500.44 |
| Missouri | 88.4 | $52,079.36 | $65,722 | -$9,278 | $2,908.30 |
| Texas | 93 | $54,789.37 | $65,475 | -$9,525 | $0.00 |
| Arkansas | 89 | $52,432.84 | $65,184 | -$9,816 | $2,122.16 |
| Tennessee | 90.4 | $53,257.63 | $63,569 | -$11,431 | $0.00 |
| Alabama | 85 | $50,076.31 | $63,512 | -$11,488 | $3,135.60 |
| Mississippi | 86.2 | $50,783.27 | $63,135 | -$11,865 | $2,125.38 |
| Oklahoma | 83.5 | $49,192.61 | $61,698 | -$13,302 | $2,561.66 |
Tax makes expensive states dearer still
Prices do most of the work. Hawaii has a cost of living index of 184.8, so it needs far more take-home to buy the same life.
Tax adds a second layer on top. Each dollar of the extra salary is taxed at your top federal rate and, in most states, a state rate as well, so you need more than the price gap alone. Scaling $75,000 by Hawaii's index gives $138,600. The salary that actually delivers the take-home is $159,011, another $20,411. That tax drag shows up in 22 states.
California is the clearest large-state case: its index of 140.5 on its own points to $105,375, but federal and California income tax on the higher pay push the answer to $115,286. Texas, at an index of 93 with no wage tax, needs about $65,475, so the two differ by $49,810 a year. New York needs about $108,363 and Florida about $73,536.
In cheaper states, tax works in your favor
The same arithmetic runs in reverse. A lower salary is taxed less, and the benchmark already includes an average state tax bill, so in 28 states the salary you need falls below what prices alone would suggest. Wyoming shows it most: an index of 94.5 points to $70,875, but because it has no wage tax and the smaller salary pays less federal tax, about $66,586 is enough, $4,289 less.
At the cheapest end, Oklahoma's index of 83.5 means about $61,698 buys what $75,000 buys at average prices. If a remote employer offers location-based pay, that's the floor below which a move to Oklahoma would cost you.
Where the model stops
It treats every state the same way, which makes it a fair comparison but not a personal budget:
- One price level per state. The MERIC index gives a single statewide figure. Moving within a state, from a metro to a small town, can swing costs more than moving between states.
- An average household's basket. If your housing cost is locked in or your mortgage is paid off, your personal gap is smaller than the index implies.
- Spending power only. The model matches what you can buy each year, not what you can save. Someone saving a fixed share of pay needs a different salary.
- Statewide tax rates only. State-specific deductions and credits aren't applied, and city income taxes, such as New York City's, are left out, so the state tax column can run a little high.
- One single filer. A joint return, children or pre-tax retirement contributions all move the answer.
Test a specific offer
Run the offered salary through the paycheck calculator for the new state, compare the two states' prices in the cost of living calculator, and use the salary raise calculator to see what a counteroffer adds after tax. For the most expensive state on this list, the Hawaii paycheck calculator covers its brackets in detail.