How much property tax is due on a median-priced home in each US state?
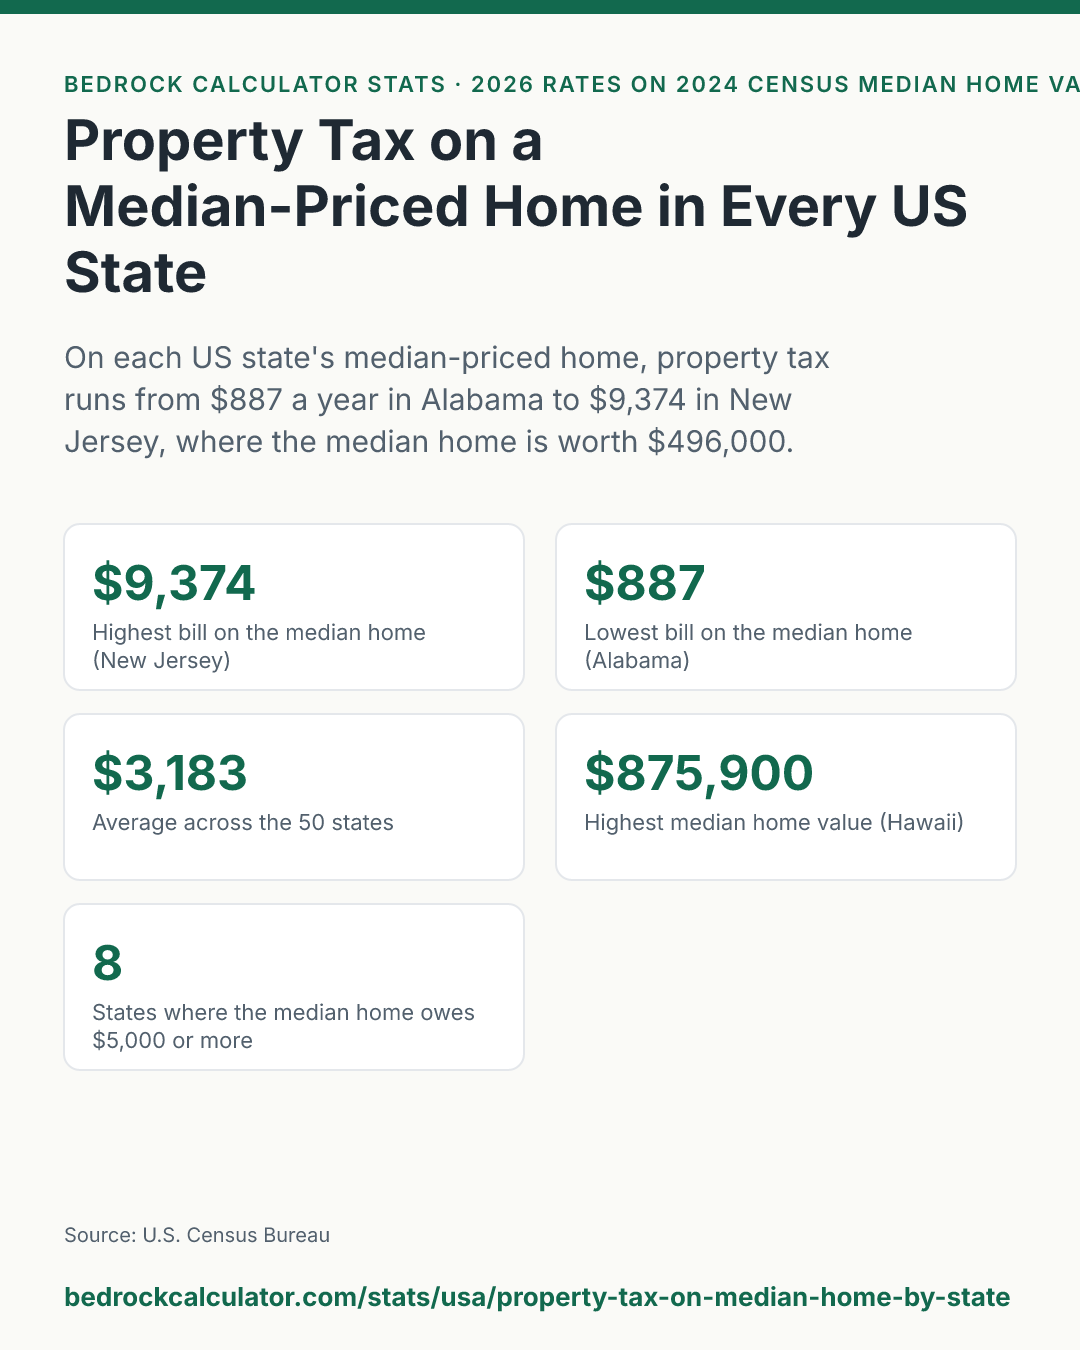
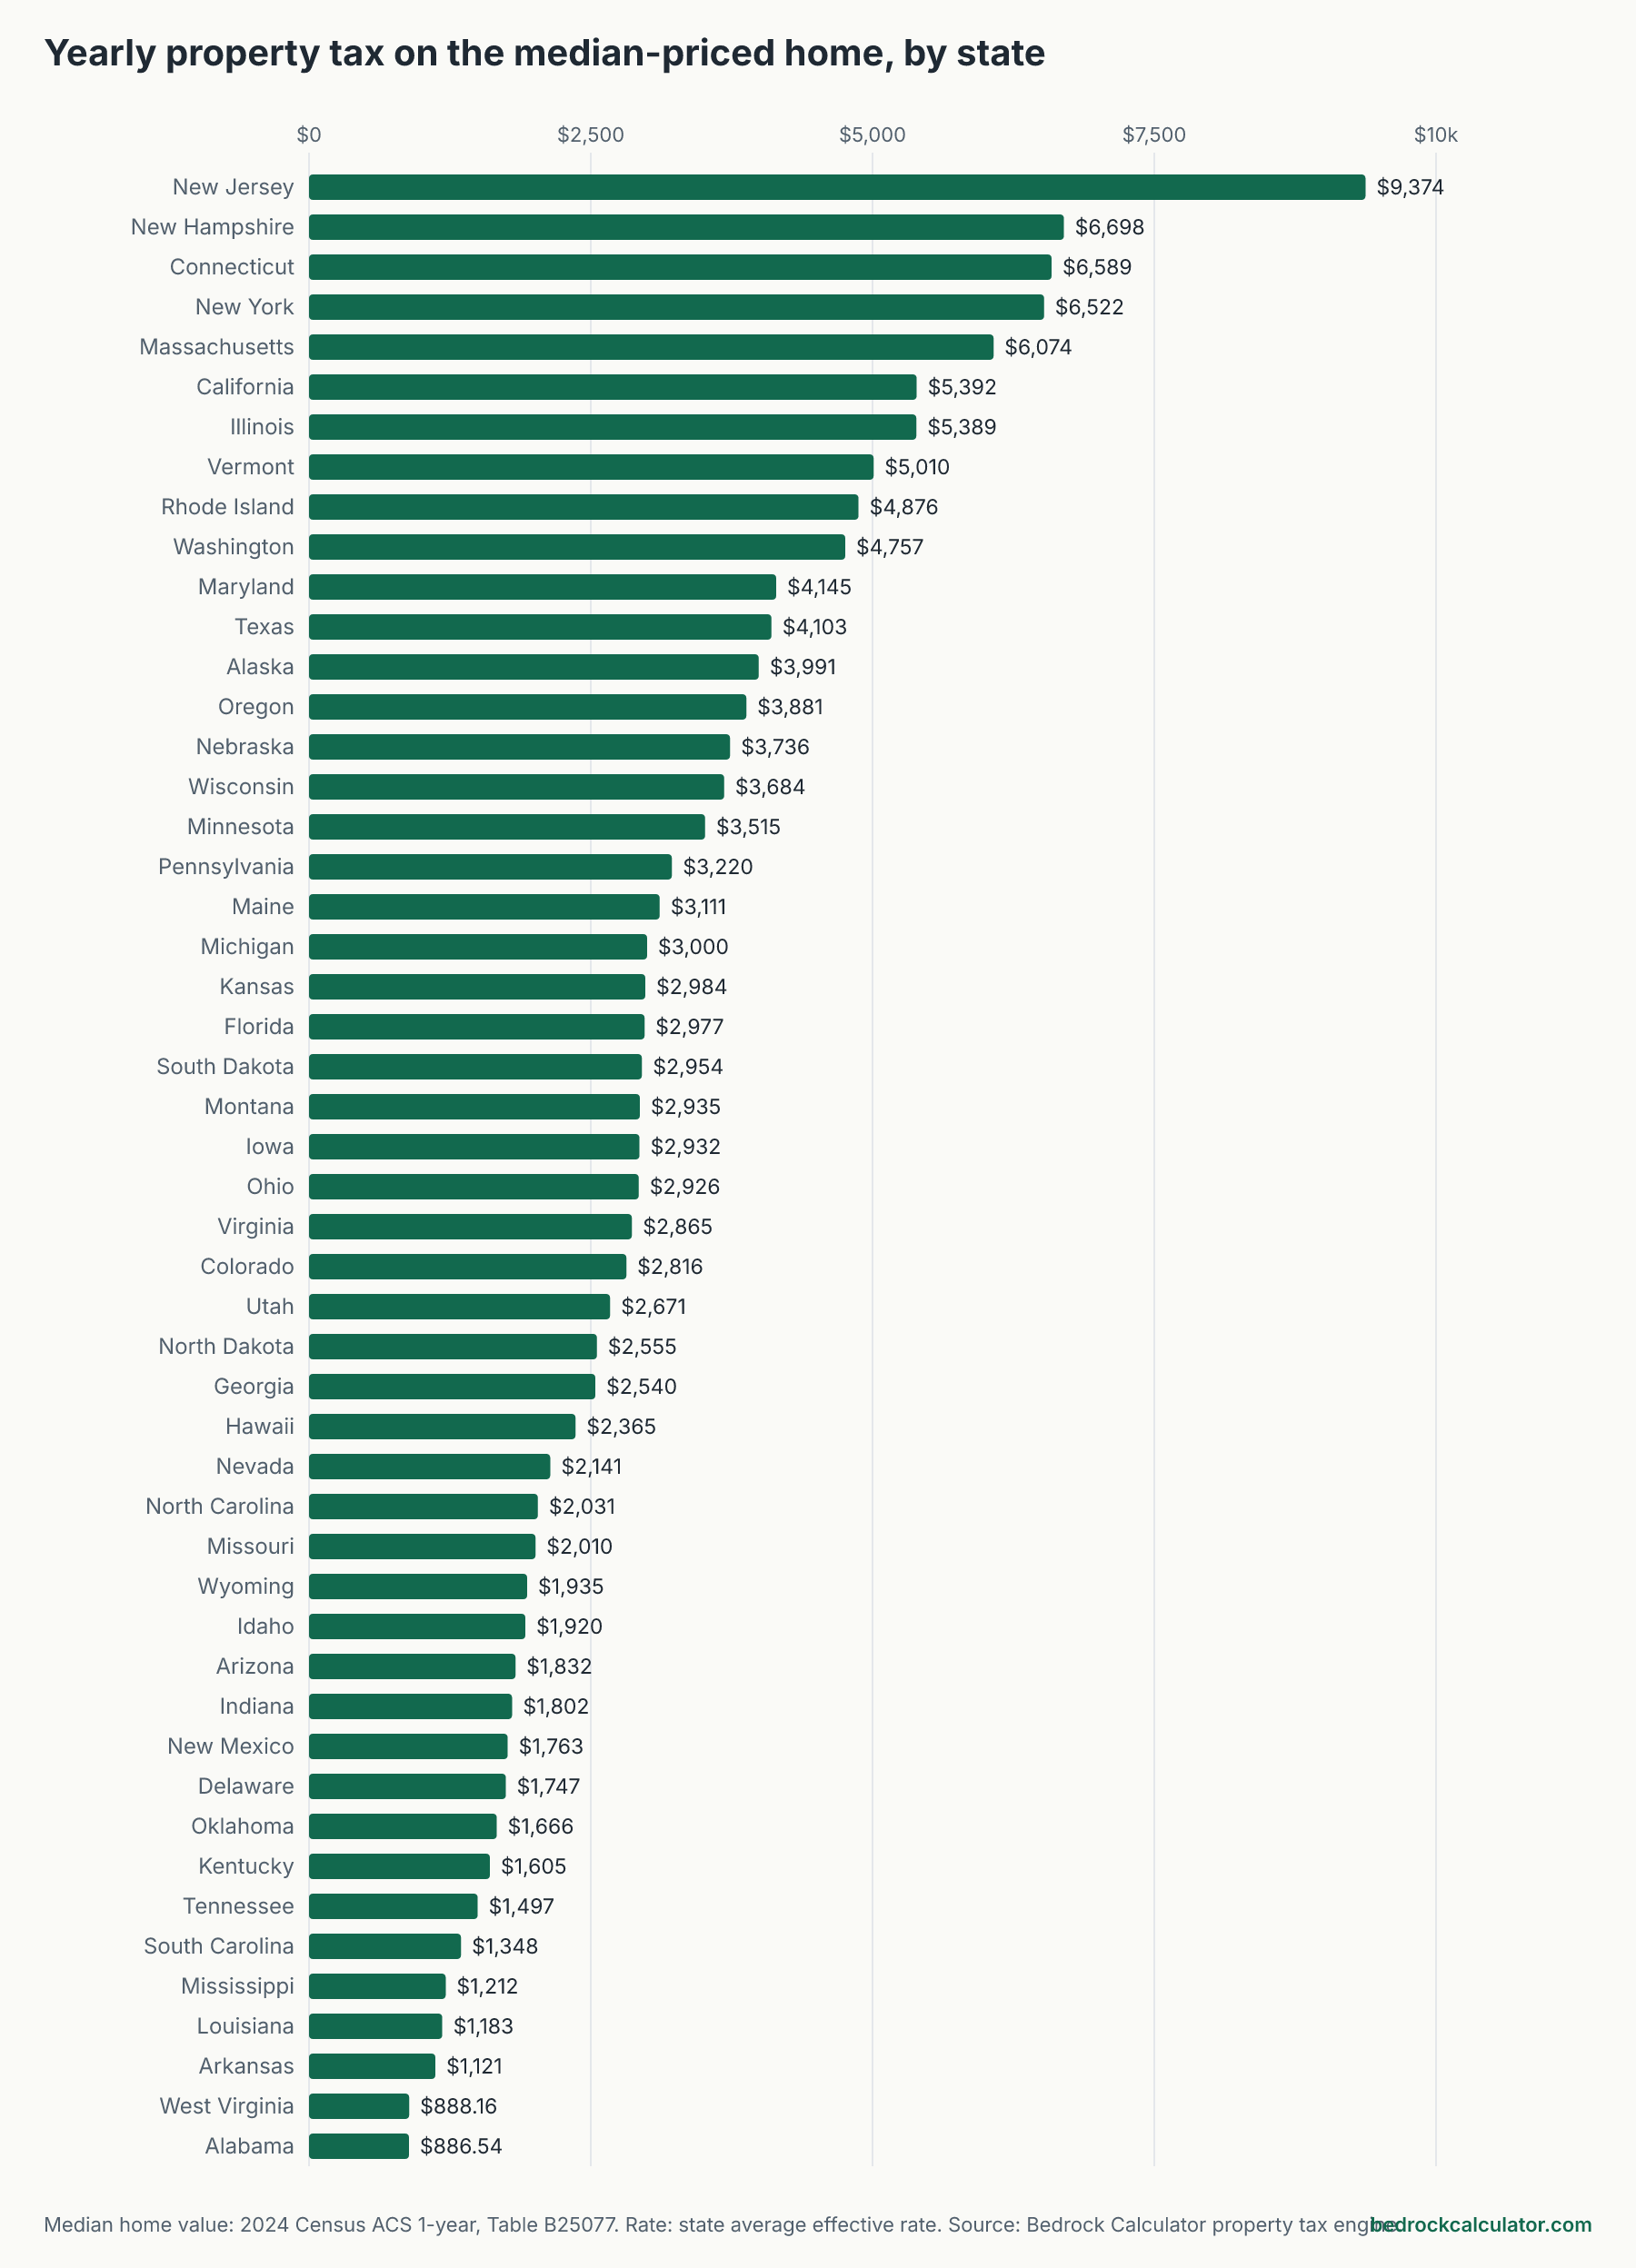
A median-priced home in New Jersey owes about $9,374 a year in property tax, the most of any US state. In Alabama the median home owes about $887. Averaged across all 50 states, the typical home owes $3,183.
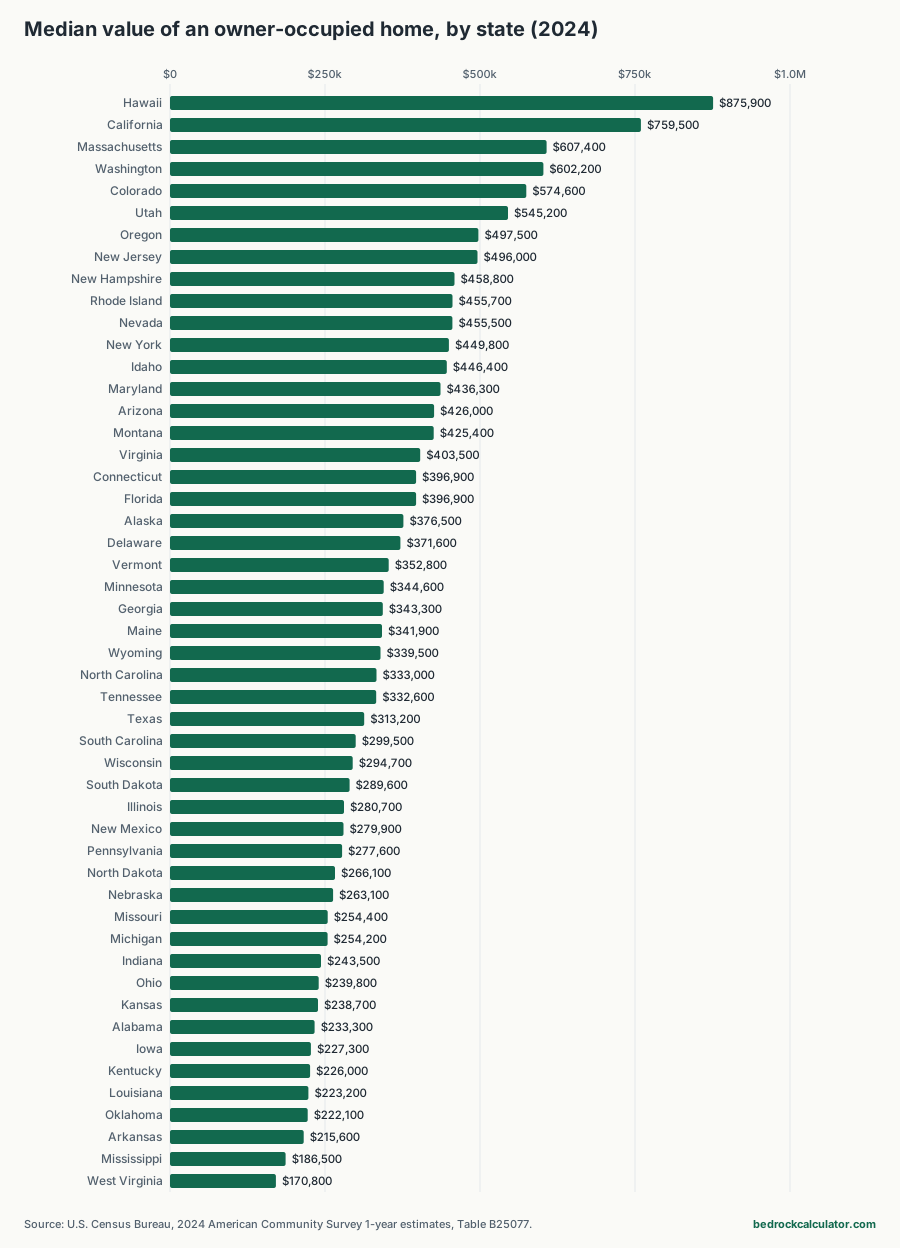
Ranking states by property tax rate tells you how hard the tax bites per dollar of home. It doesn't tell you what a typical homeowner actually pays, because home prices differ so much from state to state. So we took the median home value in every US state from the Census Bureau and ran it through the same property tax calculation.
How we worked out these numbers
Two inputs go into every row:
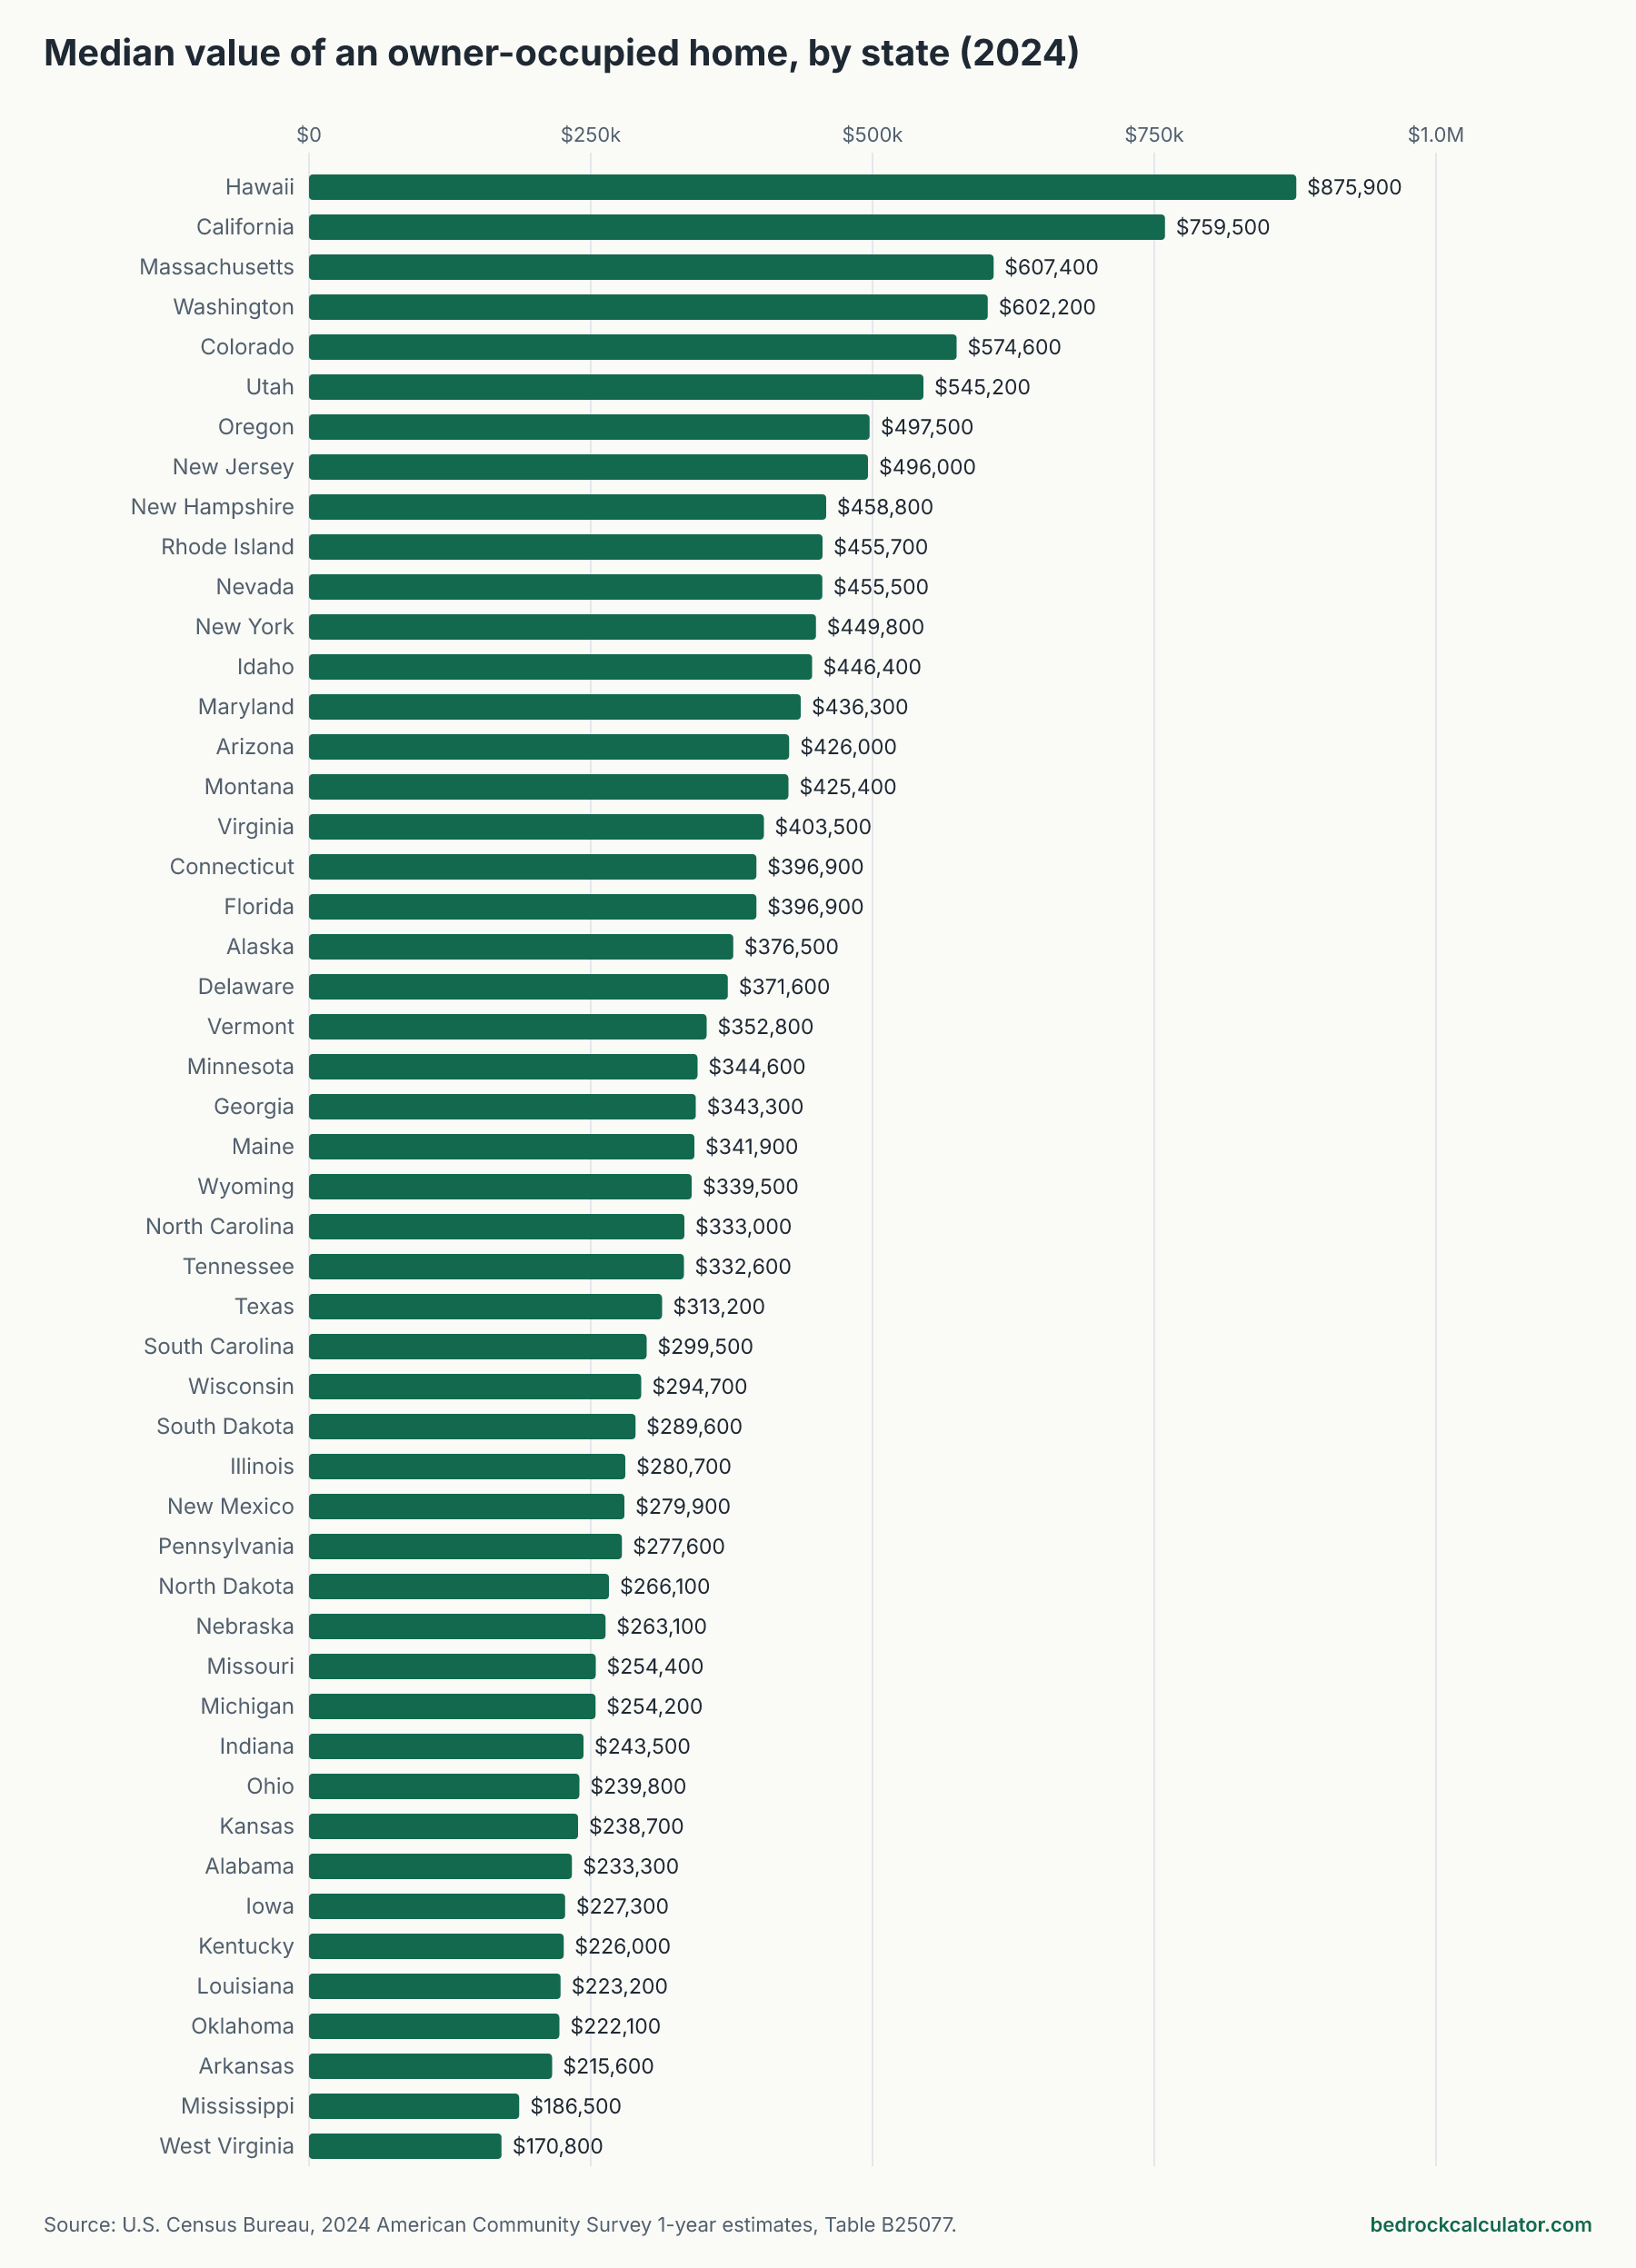
- The home value is the median value of owner-occupied homes in the state from the Census Bureau's 2024 American Community Survey 1-year estimates (Table B25077), the latest 1-year release available when we pulled it on 2026-10-14. Owners report what they think their home would sell for, so it tracks the housing stock people live in, not this year's listings.
- The tax comes from the property tax calculator, which multiplies that value by the state's average effective property tax rate, with no exemption entered.
The effective rate is itself built from the same Census survey: median real estate taxes paid divided by median home value. So the bill on the median home lands close to what the median homeowner in that state reports paying. That's a useful cross-check, and it's why this ranking is a fair answer to "what does a typical homeowner pay here?"
What the figures leave out is the same as for any statewide average. Your county and school district set the real rate, exemptions you claim lower your bill, and in states with assessment caps a recent buyer often pays more than a long-time owner of the same house. The District of Columbia has a Census median value but no rate in our property tax engine, so it isn't in the table.
The full table: median home value and property tax by US state
Click a column heading to sort. "Rank by bill" orders states by the dollar tax on their median home, and "Rank by rate" by the effective rate alone. The margin of error is the Census Bureau's own 90% range around its median estimate.
Property tax on the median-priced home in every state
Download CSVMedian value of owner-occupied homes from the 2024 Census ACS 1-year estimates (with its 90% margin of error), taxed at the state average effective rate with no exemption.
| New Jersey | $496,000 | $2,982 | 1.89% | $9,374 | $781.20 | 1 | 2 |
| New Hampshire | $458,800 | $6,138 | 1.46% | $6,698 | $558.21 | 2 | 4 |
| Connecticut | $396,900 | $3,745 | 1.66% | $6,589 | $549.05 | 3 | 3 |
| New York | $449,800 | $3,718 | 1.45% | $6,522 | $543.51 | 4 | 5 |
| Massachusetts | $607,400 | $3,979 | 1.00% | $6,074 | $506.17 | 5 | 19 |
| California | $759,500 | $3,644 | 0.71% | $5,392 | $449.37 | 6 | 30 |
| Illinois | $280,700 | $1,768 | 1.92% | $5,389 | $449.12 | 7 | 1 |
| Vermont | $352,800 | $7,277 | 1.42% | $5,010 | $417.48 | 8 | 6 |
| Rhode Island | $455,700 | $6,647 | 1.07% | $4,876 | $406.33 | 9 | 15 |
| Washington | $602,200 | $3,897 | 0.79% | $4,757 | $396.45 | 10 | 23 |
| Maryland | $436,300 | $3,089 | 0.95% | $4,145 | $345.40 | 11 | 21 |
| Texas | $313,200 | $1,780 | 1.31% | $4,103 | $341.91 | 12 | 8 |
| Alaska | $376,500 | $7,020 | 1.06% | $3,991 | $332.58 | 13 | 16 |
| Oregon | $497,500 | $3,618 | 0.78% | $3,881 | $323.38 | 14 | 25 |
| Nebraska | $263,100 | $3,117 | 1.42% | $3,736 | $311.34 | 15 | 6 |
| Wisconsin | $294,700 | $1,862 | 1.25% | $3,684 | $306.98 | 16 | 10 |
| Minnesota | $344,600 | $1,807 | 1.02% | $3,515 | $292.91 | 17 | 17 |
| Pennsylvania | $277,600 | $1,517 | 1.16% | $3,220 | $268.35 | 18 | 14 |
| Maine | $341,900 | $4,987 | 0.91% | $3,111 | $259.27 | 19 | 22 |
| Michigan | $254,200 | $1,616 | 1.18% | $3,000 | $249.96 | 20 | 13 |
| Kansas | $238,700 | $2,937 | 1.25% | $2,984 | $248.65 | 21 | 10 |
| Florida | $396,900 | $1,617 | 0.75% | $2,977 | $248.06 | 22 | 26 |
| South Dakota | $289,600 | $6,421 | 1.02% | $2,954 | $246.16 | 23 | 17 |
| Montana | $425,400 | $10,246 | 0.69% | $2,935 | $244.61 | 24 | 33 |
| Iowa | $227,300 | $2,299 | 1.29% | $2,932 | $244.35 | 25 | 9 |
| Ohio | $239,800 | $1,395 | 1.22% | $2,926 | $243.80 | 26 | 12 |
| Virginia | $403,500 | $3,411 | 0.71% | $2,865 | $238.74 | 27 | 30 |
| Colorado | $574,600 | $3,773 | 0.49% | $2,816 | $234.63 | 28 | 41 |
| Utah | $545,200 | $6,188 | 0.49% | $2,671 | $222.62 | 29 | 41 |
| North Dakota | $266,100 | $5,332 | 0.96% | $2,555 | $212.88 | 30 | 20 |
| Georgia | $343,300 | $2,287 | 0.74% | $2,540 | $211.70 | 31 | 28 |
| Hawaii | $875,900 | $14,013 | 0.27% | $2,365 | $197.08 | 32 | 50 |
| Nevada | $455,500 | $3,836 | 0.47% | $2,141 | $178.40 | 33 | 43 |
| North Carolina | $333,000 | $1,908 | 0.61% | $2,031 | $169.28 | 34 | 36 |
| Missouri | $254,400 | $2,059 | 0.79% | $2,010 | $167.48 | 35 | 23 |
| Wyoming | $339,500 | $8,452 | 0.57% | $1,935 | $161.26 | 36 | 37 |
| Idaho | $446,400 | $5,301 | 0.43% | $1,920 | $159.96 | 37 | 47 |
| Arizona | $426,000 | $2,728 | 0.43% | $1,832 | $152.65 | 38 | 47 |
| Indiana | $243,500 | $1,916 | 0.74% | $1,802 | $150.16 | 39 | 28 |
| New Mexico | $279,900 | $4,338 | 0.63% | $1,763 | $146.95 | 40 | 35 |
| Delaware | $371,600 | $4,972 | 0.47% | $1,747 | $145.54 | 41 | 43 |
| Oklahoma | $222,100 | $2,147 | 0.75% | $1,666 | $138.81 | 42 | 26 |
| Kentucky | $226,000 | $2,611 | 0.71% | $1,605 | $133.72 | 43 | 30 |
| Tennessee | $332,600 | $2,448 | 0.45% | $1,497 | $124.73 | 44 | 45 |
| South Carolina | $299,500 | $3,303 | 0.45% | $1,348 | $112.31 | 45 | 45 |
| Mississippi | $186,500 | $3,787 | 0.65% | $1,212 | $101.02 | 46 | 34 |
| Louisiana | $223,200 | $2,575 | 0.53% | $1,183 | $98.58 | 47 | 38 |
| Arkansas | $215,600 | $3,253 | 0.52% | $1,121 | $93.43 | 48 | 39 |
| West Virginia | $170,800 | $2,594 | 0.52% | $888 | $74.01 | 49 | 39 |
| Alabama | $233,300 | $2,461 | 0.38% | $887 | $73.88 | 50 | 49 |
Where typical homeowners pay the most
New Jersey tops the list because it combines a high rate (1.89%) with a fairly expensive median home ($496,000). That works out to roughly $781.20 a month in escrow. New Hampshire ($6,698) and Connecticut ($6,589) come next, and 8 states in all have a median-home bill of five thousand dollars or more a year.
Illinois has the highest rate in the country, but its median home is worth $280,700, so its typical bill is $5,389, rank 7 by dollars. High rates on modest homes and modest rates on expensive homes can end up in the same place.
Why California and Hawaii look different here
The biggest jump between the two rankings belongs to California. It's rank 30 by rate but rank 6 by bill. The median California home is worth $759,500, and even a middling rate on that value adds up to about $5,392 a year.
Hawaii is the other headline case. It has the lowest effective rate of any state, 0.27%, and the most expensive median home, $875,900. Put together, the typical Hawaii homeowner pays $2,365, which is rank 32 out of 50. Low rate, middling bill.
Going the other way, Oklahoma drops from rank 26 by rate to rank 42 by bill, because its homes are among the less expensive in the country.
Where the typical bill is lowest
Alabama has the smallest bill on a median home, $887, thanks to one of the lowest rates in the country on a home worth $233,300. 15 states have a median-home bill under two thousand dollars a year.
Texas is a useful contrast. Its median home is worth $313,200, close to the middle of the pack, but its rate is high, so the typical bill is $4,103, rank 12.
How to use this for your own move
If you're comparing states, both rankings matter. The rate tells you what each extra dollar of house will cost you in tax every year. The median-home bill tells you what a typical buyer in that market is already paying.
For a figure on a specific house, enter its price in the property tax calculator and add any exemption you'd qualify for. Then carry the result into the mortgage calculator to see your full monthly payment, or the house affordability calculator to see how the tax changes your budget. For a same-house comparison across states, see our study of property tax rates and rankings by state.