How much does investing a set amount every month grow to?
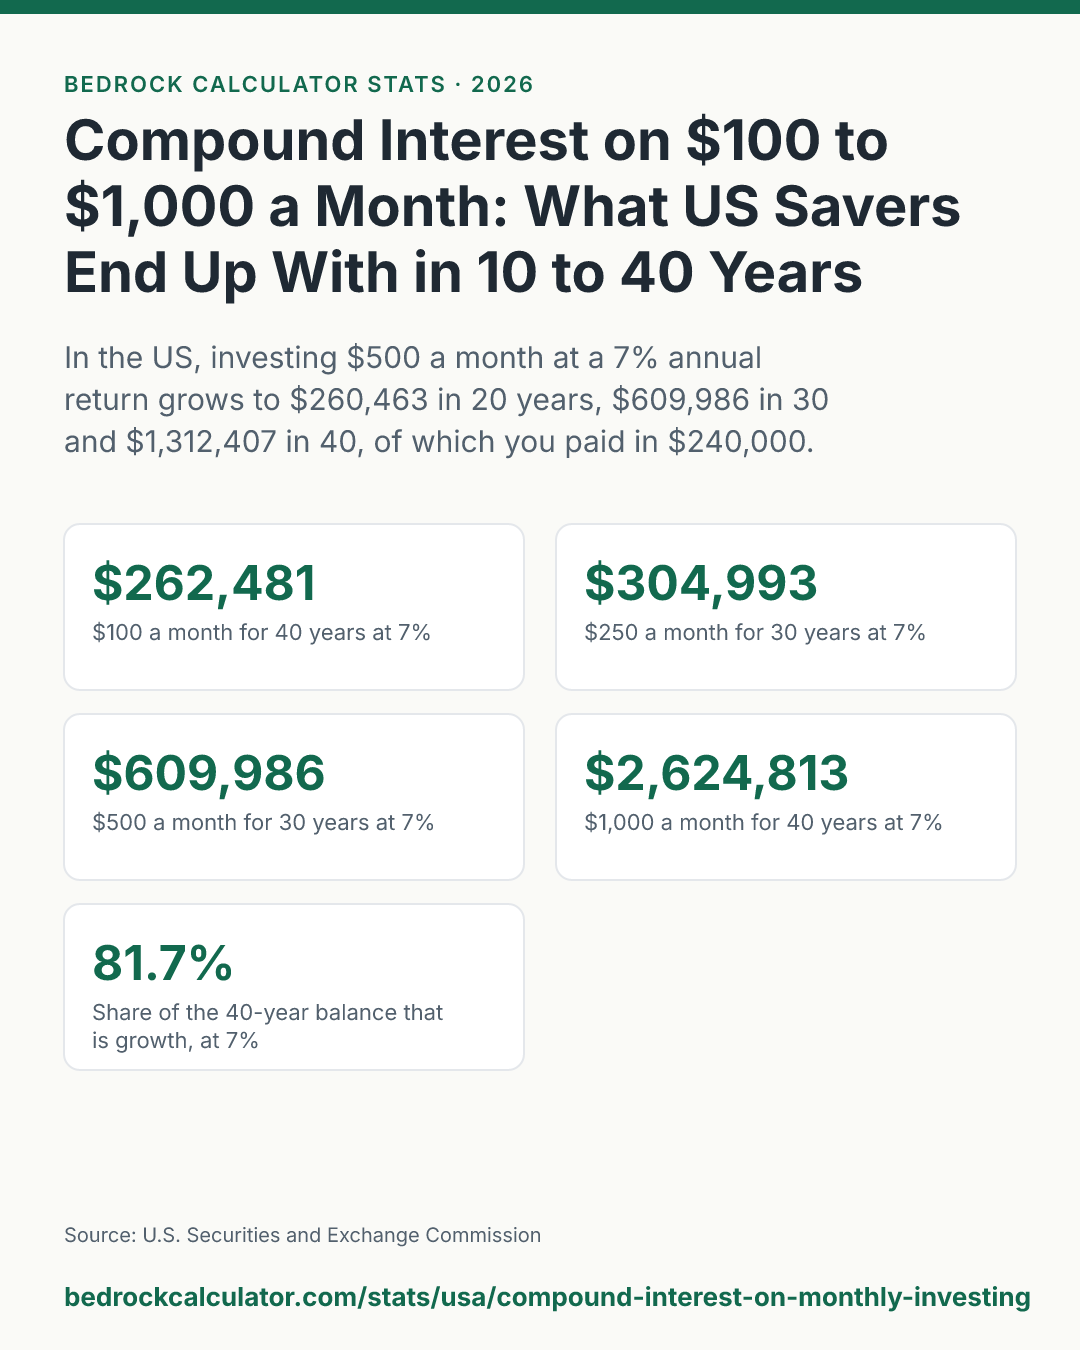
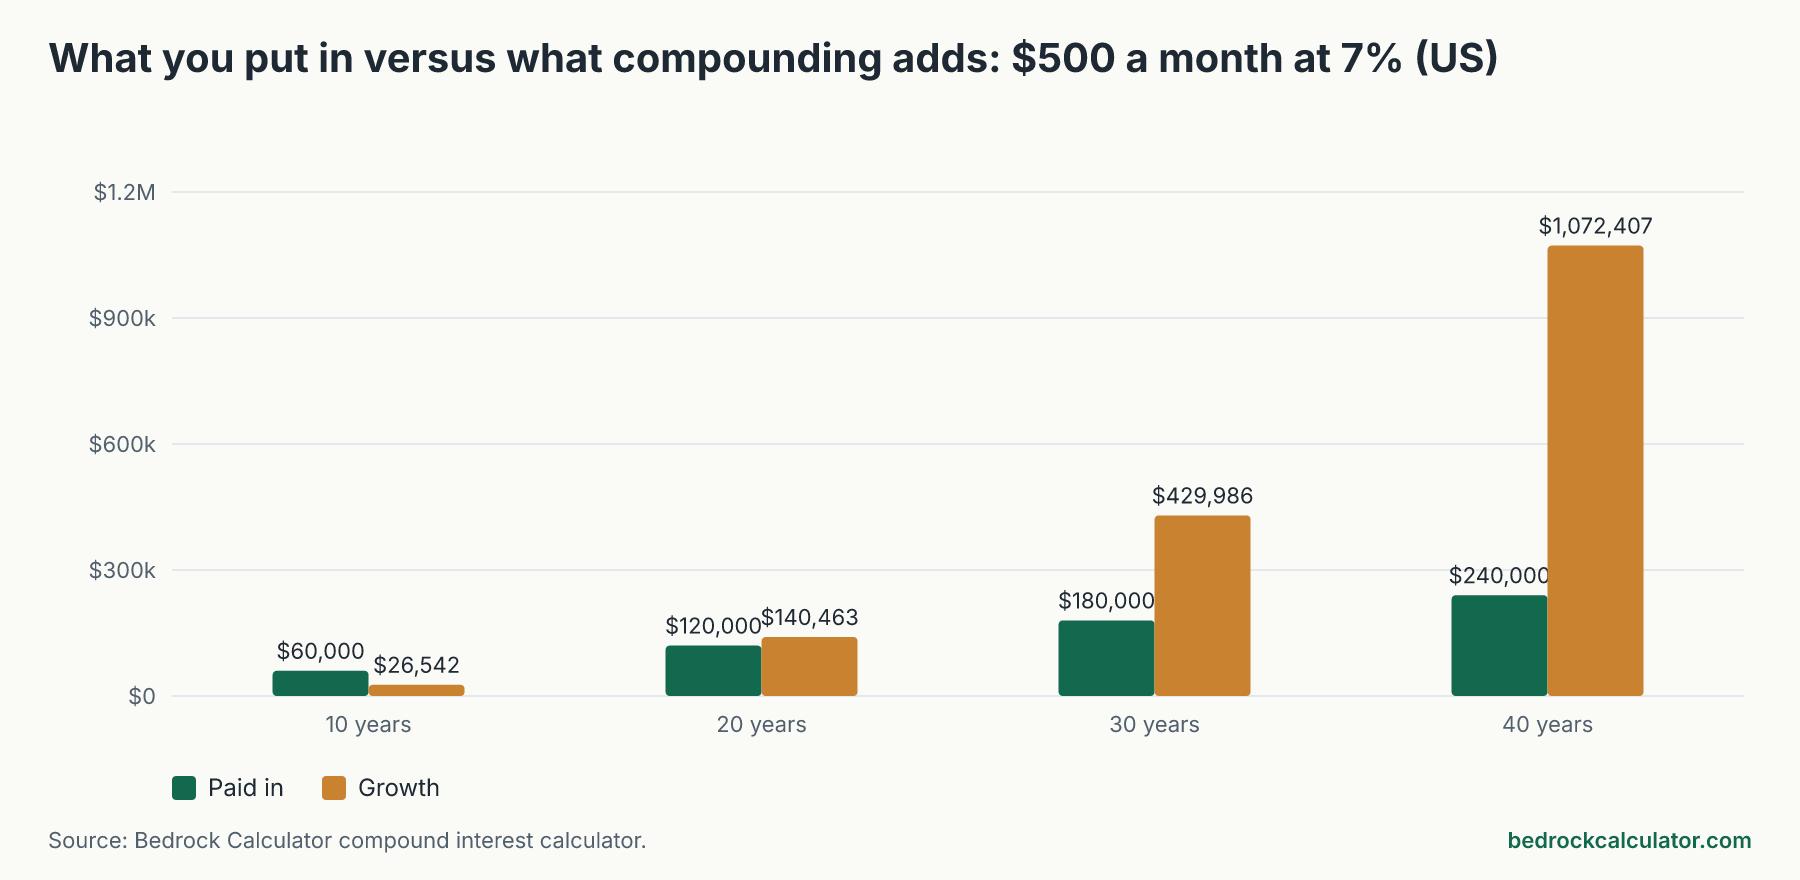
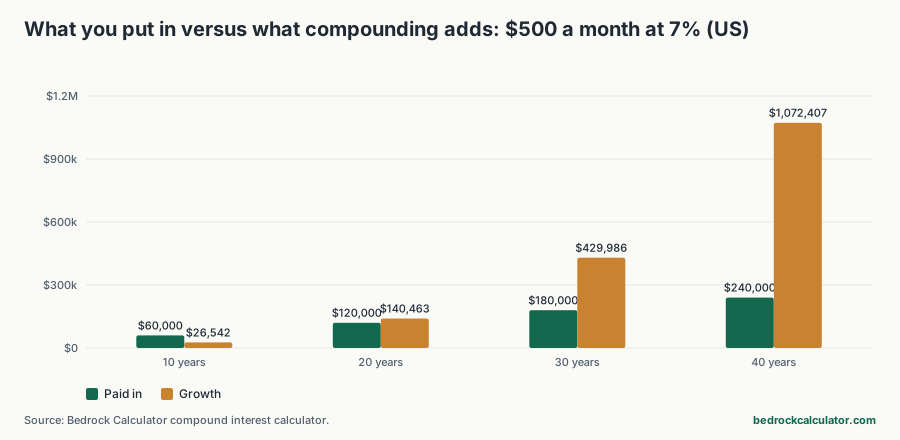
Put $500 a month into an investment that earns a steady 7% a year and you'll have $260,463 after 20 years, $609,986 after 30 and $1,312,407 after 40. Over those 40 years you'd pay in $240,000. The other $1,072,407 is compound growth.
Smaller amounts follow the same curve. $100 a month for 40 years at 7% grows to $262,481. $1,000 a month reaches $1,219,971 in 30 years.
How we worked out these numbers
Every figure comes from the site's compound interest calculator, run once for each combination of monthly deposit, number of years and annual return. The setup is the same each time:
- No starting balance. You begin from zero and add the same amount every month.
- Each deposit goes in at the end of the month.
- The annual return is split into twelve monthly rates and compounded monthly, so a 7% rate works out to an effective 7.23% a year.
- The return is the same every single year.
The "today's dollars" figures use the calculator's default inflation assumption of 2.5% a year to show what a future balance would buy now.
Three things aren't in these numbers, and each one would lower them:
- Taxes. In a regular brokerage or savings account, interest, dividends and realized gains are taxed along the way. Inside a 401(k), IRA or Roth IRA the tax is deferred or avoided, which is why these accounts compound closer to the figures here.
- Fees. A fund's yearly expense ratio comes straight off your return, every year, for as long as you hold it.
- Real markets. Stocks don't return 7% each year. A strong year can be followed by a loss. A steady rate shows the long-run arithmetic, not the ride.
The full table: $100 to $1,000 a month
What monthly investing grows to in the US, by amount, years and return
Download CSVNo starting balance. Deposits at the end of each month, returns compounded monthly, before tax and fees. Nominal dollars; the last column is the 7% balance in today's money at 2.5% inflation.
| $100 | 10 | $12,000 | $14,725 | $17,308 | $20,485 | $13,521 |
| $100 | 20 | $24,000 | $36,677 | $52,093 | $75,937 | $31,791 |
| $100 | 30 | $36,000 | $69,405 | $121,997 | $226,049 | $58,161 |
| $100 | 40 | $48,000 | $118,196 | $262,481 | $632,408 | $97,756 |
| $250 | 10 | $30,000 | $36,812 | $43,271 | $51,211 | $33,803 |
| $250 | 20 | $60,000 | $91,694 | $130,232 | $189,842 | $79,477 |
| $250 | 30 | $90,000 | $173,512 | $304,993 | $565,122 | $145,403 |
| $250 | 40 | $120,000 | $295,490 | $656,203 | $1,581,020 | $244,390 |
| $500 | 10 | $60,000 | $73,625 | $86,542 | $102,422 | $67,607 |
| $500 | 20 | $120,000 | $183,387 | $260,463 | $379,684 | $158,953 |
| $500 | 30 | $180,000 | $347,025 | $609,986 | $1,130,244 | $290,806 |
| $500 | 40 | $240,000 | $590,981 | $1,312,407 | $3,162,040 | $488,780 |
| $1,000 | 10 | $120,000 | $147,250 | $173,085 | $204,845 | $135,214 |
| $1,000 | 20 | $240,000 | $366,775 | $520,927 | $759,369 | $317,906 |
| $1,000 | 30 | $360,000 | $694,049 | $1,219,971 | $2,260,488 | $581,612 |
| $1,000 | 40 | $480,000 | $1,181,961 | $2,624,813 | $6,324,080 | $977,561 |
Two columns are worth comparing. "You put in" is just the monthly amount times the number of months. The balance columns show what compounding does with it. At 10 years the two are fairly close: $500 a month becomes $86,542 at 7%, from $60,000 of deposits. At 40 years they're far apart.
Because everything scales with the deposit, you can read any amount you like from the table. The table covers $100, $250, $500, $1,000 a month. $250 a month is half of $500, and $1,000 is double.
Why the last decade adds the most
Compound growth means your returns earn returns. In the early years most of the balance is your own deposits. After 10 years at 7%, growth is 30.7% of the balance. After 20 years it's 53.9%, after 30 years 70.5%, and after 40 years 81.7%.
The jump between year 30 and year 40 shows how this plays out. At $500 a month, the balance goes from $609,986 to $1,312,407. Those ten extra years add $702,421, more than everything in the first 30 years put together. The balance at 40 years is 2.2 times the balance at 30.
That's also the cost of waiting. If you start ten years later and have only 30 years until you stop, you'd need to put in about $1,076 a month at 7% to end up where a $500-a-month saver who started earlier does.
Starting small still adds up
If $500 a month isn't realistic right now, the smaller rows are worth a look. $100 a month grows to $121,997 over 30 years at 7% and $262,481 over 40. $250 a month reaches $304,993 in 30 years. You can also start small and raise the amount later, since each increase starts compounding from the day you make it. What hurts most is waiting, not starting with a modest figure.
How much the return assumption matters
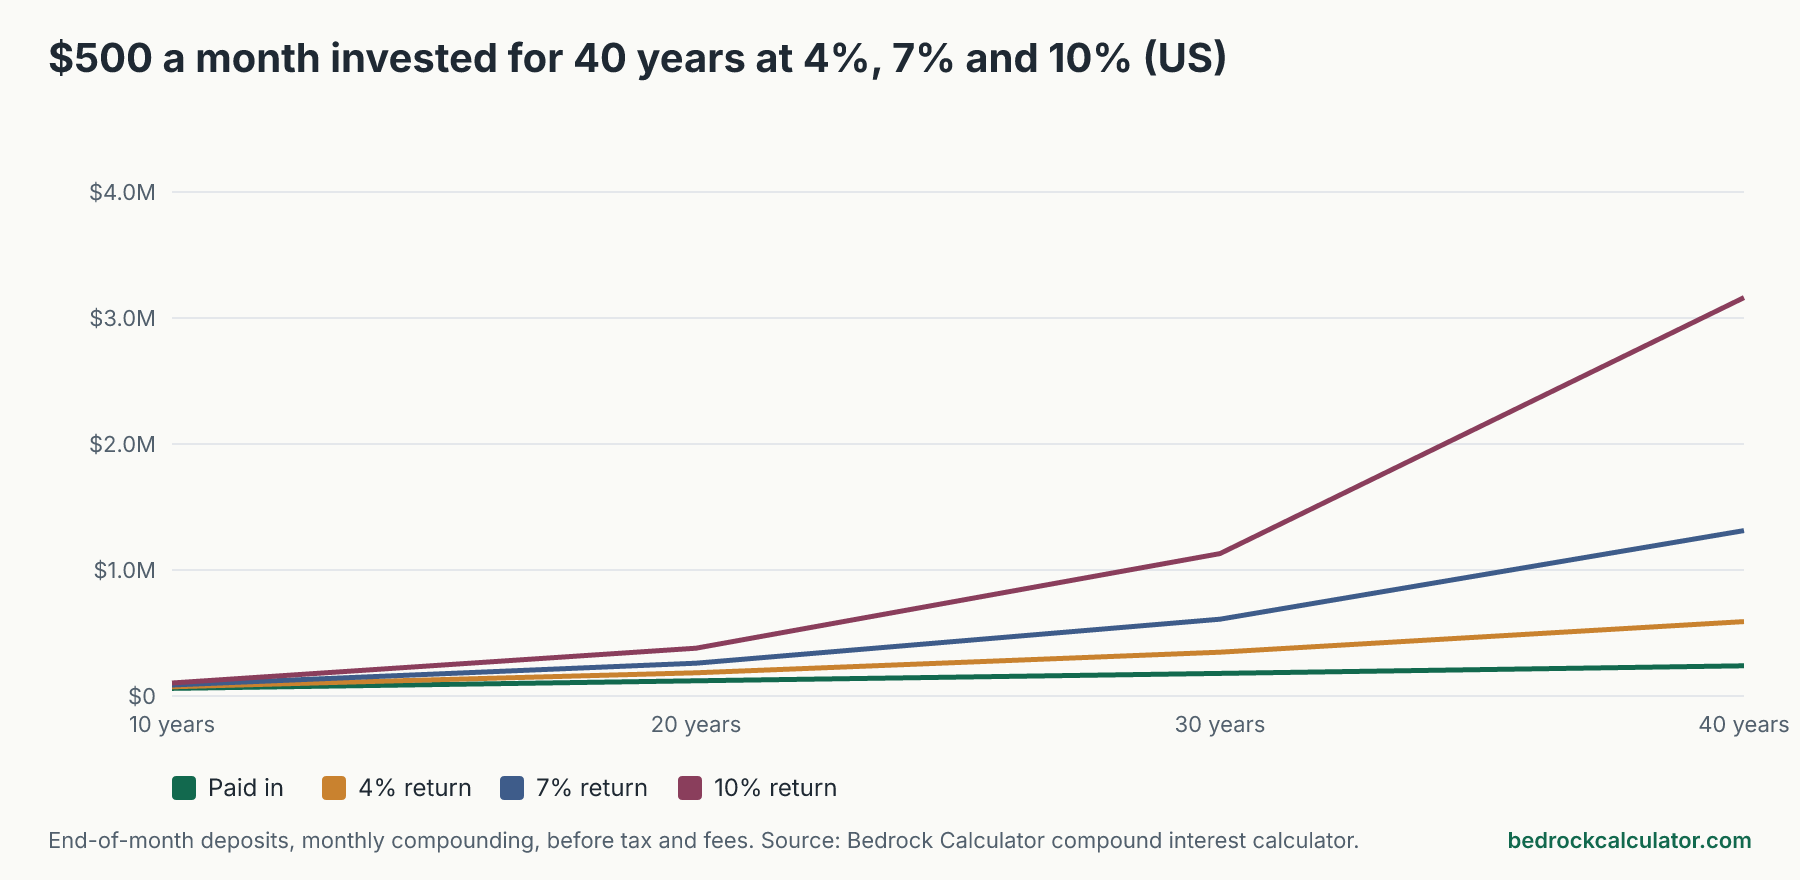
Small differences in the yearly return turn into large differences over decades. $500 a month for 30 years becomes $347,025 at 4%, $609,986 at 7% and $1,130,244 at 10%. Over 40 years the spread is wider still: $590,981 at 4% against $3,162,040 at 10%.
This is why the fees and taxes left out of this table matter. Anything that takes a slice of your yearly return, even a small one, compounds against you the same way.
Which column to use depends on where the money sits. A high-yield savings account or a CD pays a fixed rate that can change when the bank decides. A stock index fund has no fixed rate at all, and over long periods its average has historically been higher than savings rates, with big swings along the way. Treat the 4% column as a cautious case and 10% as an optimistic one.
What it's worth in today's money
A million dollars in 40 years won't buy what a million buys today. At 2.5% inflation, the $1,312,407 from $500 a month for 40 years would buy about what $488,780 buys now. After 30 years, $609,986 is worth about $290,806 in today's dollars.
That's still far more than you paid in, but it's the number to compare against what you want to spend in retirement. If you raise your monthly deposit as your pay rises, which this table doesn't assume, you'll keep closer pace with inflation.
Run your own numbers
The compound interest calculator lets you add a starting balance, change the return and inflation, and see the year-by-year schedule. For a bank account with an advertised APY, use the savings calculator, which converts the APY properly before compounding. To see what tax-free growth is worth, try the Roth IRA calculator, and to check whether your monthly saving is on pace for retirement, use the retirement calculator.