How many years until buying a home beats renting?
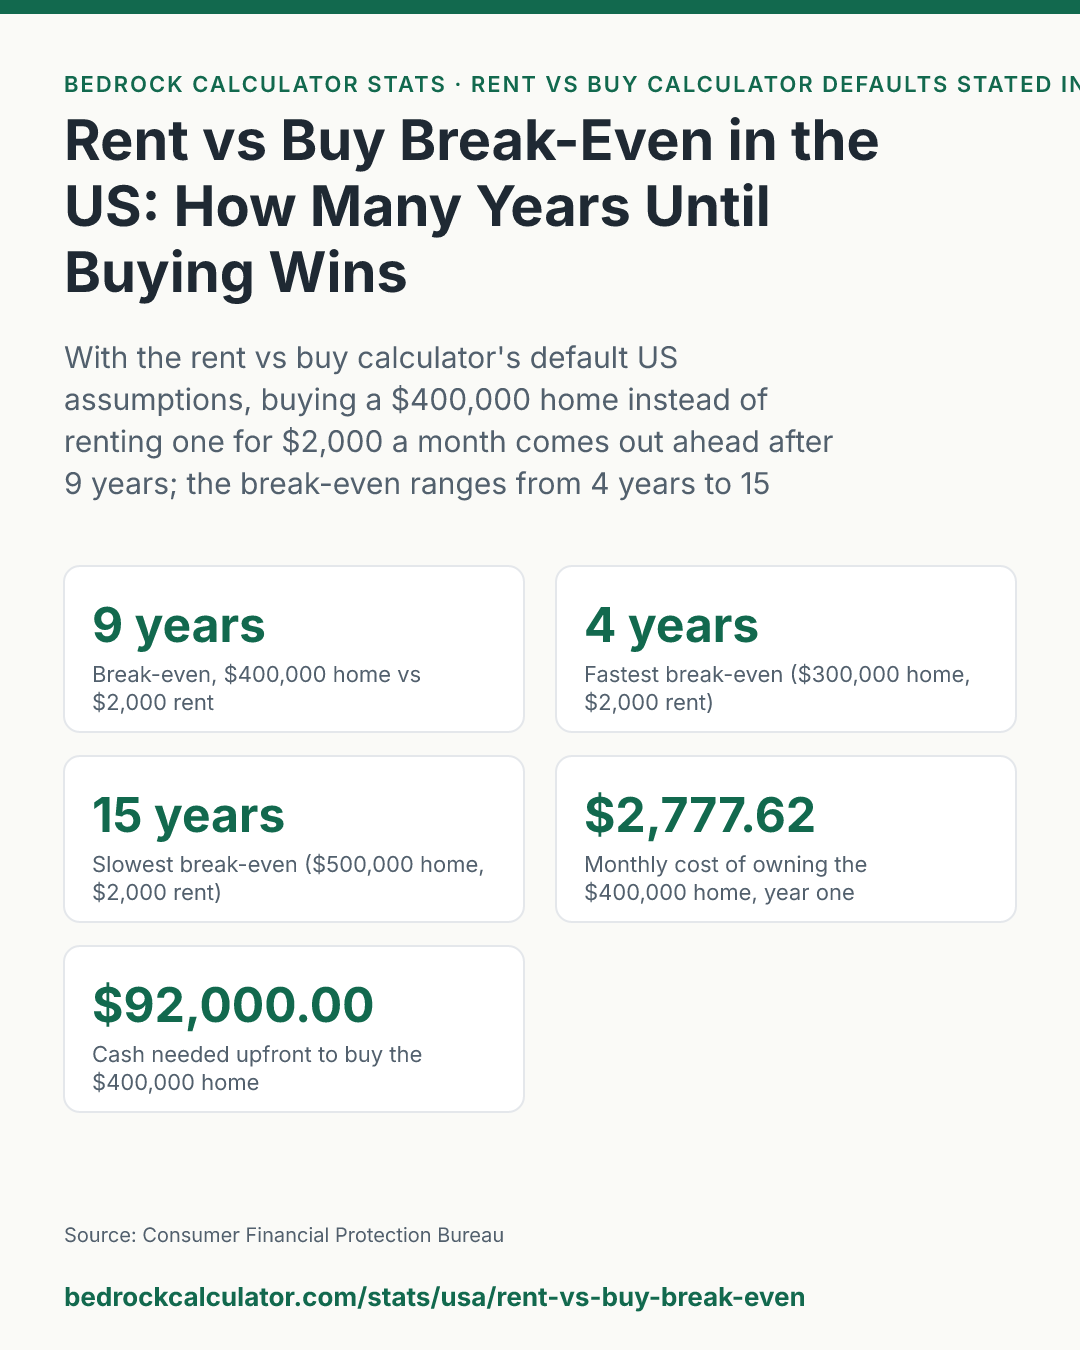
Using the default assumptions in our US rent vs buy calculator, buying a $400,000 home instead of renting a similar one for $2,000 a month comes out ahead after 9 years. Stay for less than that and renting costs less.
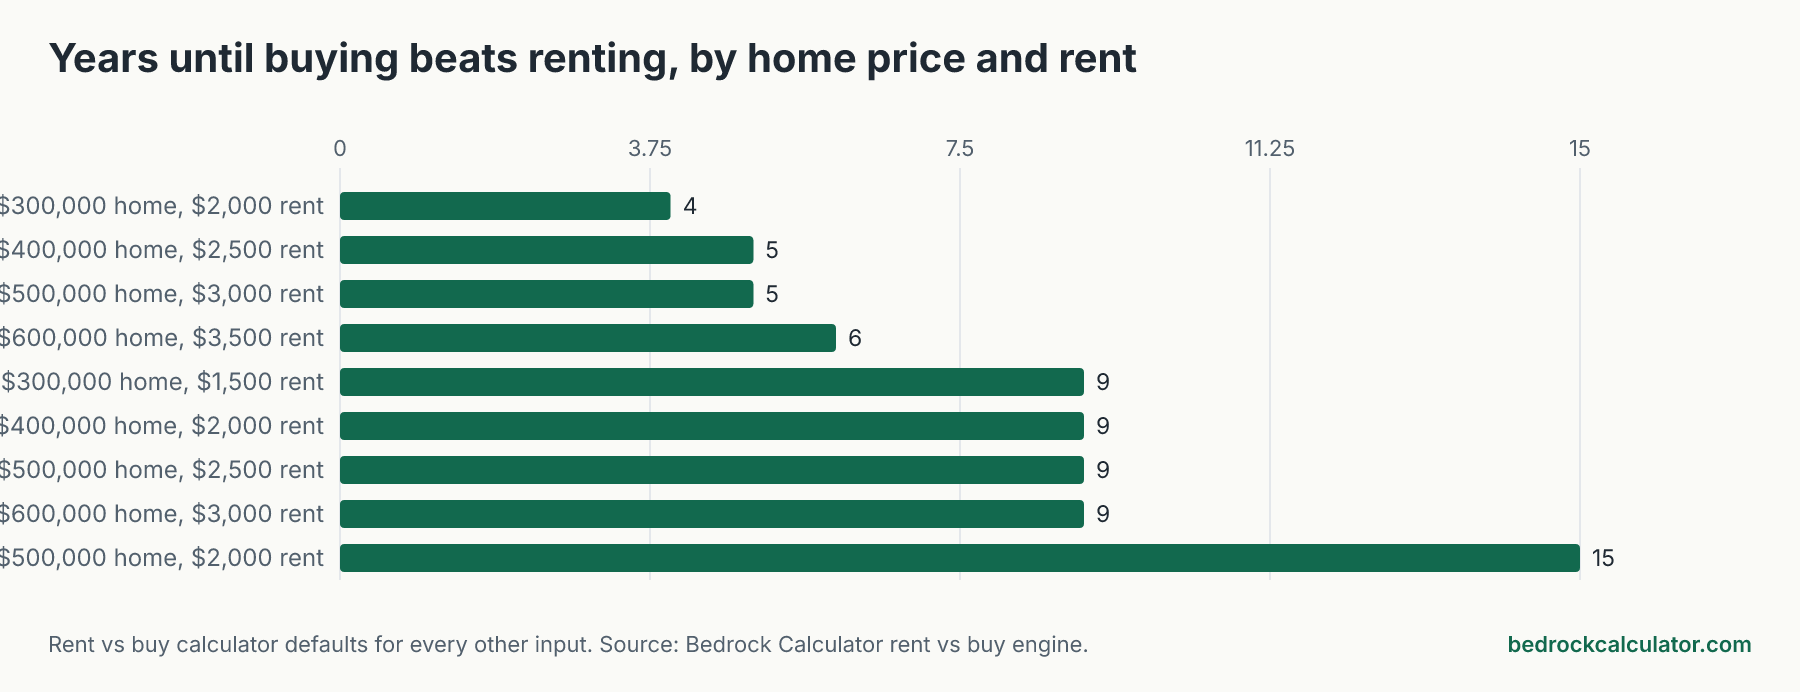
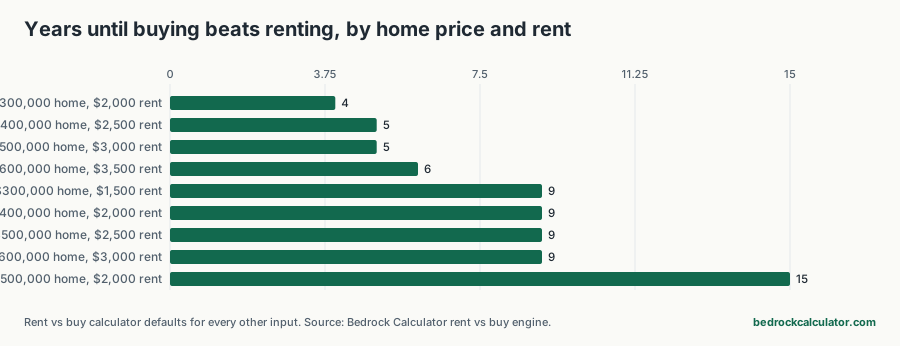
Across the nine price and rent pairs we tested, the break-even ran from 4 years for a $300,000 home, $2,000 rent to 15 years for a $500,000 home, $2,000 rent. One number predicted the answer better than the price itself: how many years of rent the home costs.
How we worked out these numbers
We ran the rent vs buy calculator on this site for each pair of home price and monthly rent, at every time horizon from 1 to 30 years. The break-even is the first whole year at which the net cost of buying is the same as or lower than the cost of renting. The calculator's own menu offers horizons of 3 to 15 years; its engine accepts any whole number, which is how we found the exact year.
Everything other than price and rent is the calculator's default. Here's every assumption, because the answer depends on all of them:
- Down payment: 20% of the price, so no mortgage insurance.
- Mortgage: 30-year fixed at 6.5%.
- Closing costs to buy: 3% of the price. Selling costs when you leave: 7% of the sale price.
- Property tax: 0.89% of the purchase price a year. Homeowners insurance: $125 a month. Maintenance: 1% of the purchase price a year.
- Home appreciation: 3.5% a year.
- Rent increases: 3% a year. Renters insurance: $15 a month.
- Opportunity cost: the down payment and closing costs would otherwise earn 7% a year if invested.
The net cost of buying is everything you pay to own (down payment, closing costs, mortgage payments, property tax, insurance and maintenance), minus what you'd walk away with after selling the home and paying off the loan, plus the investment return you gave up on the upfront cash. The cost of renting is rent plus renters insurance.
Every pair we tested
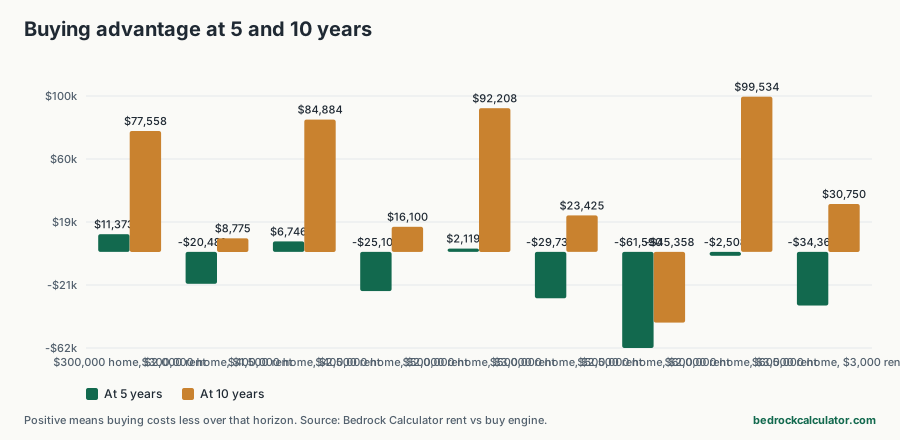
Rent vs buy break-even for common price and rent pairs
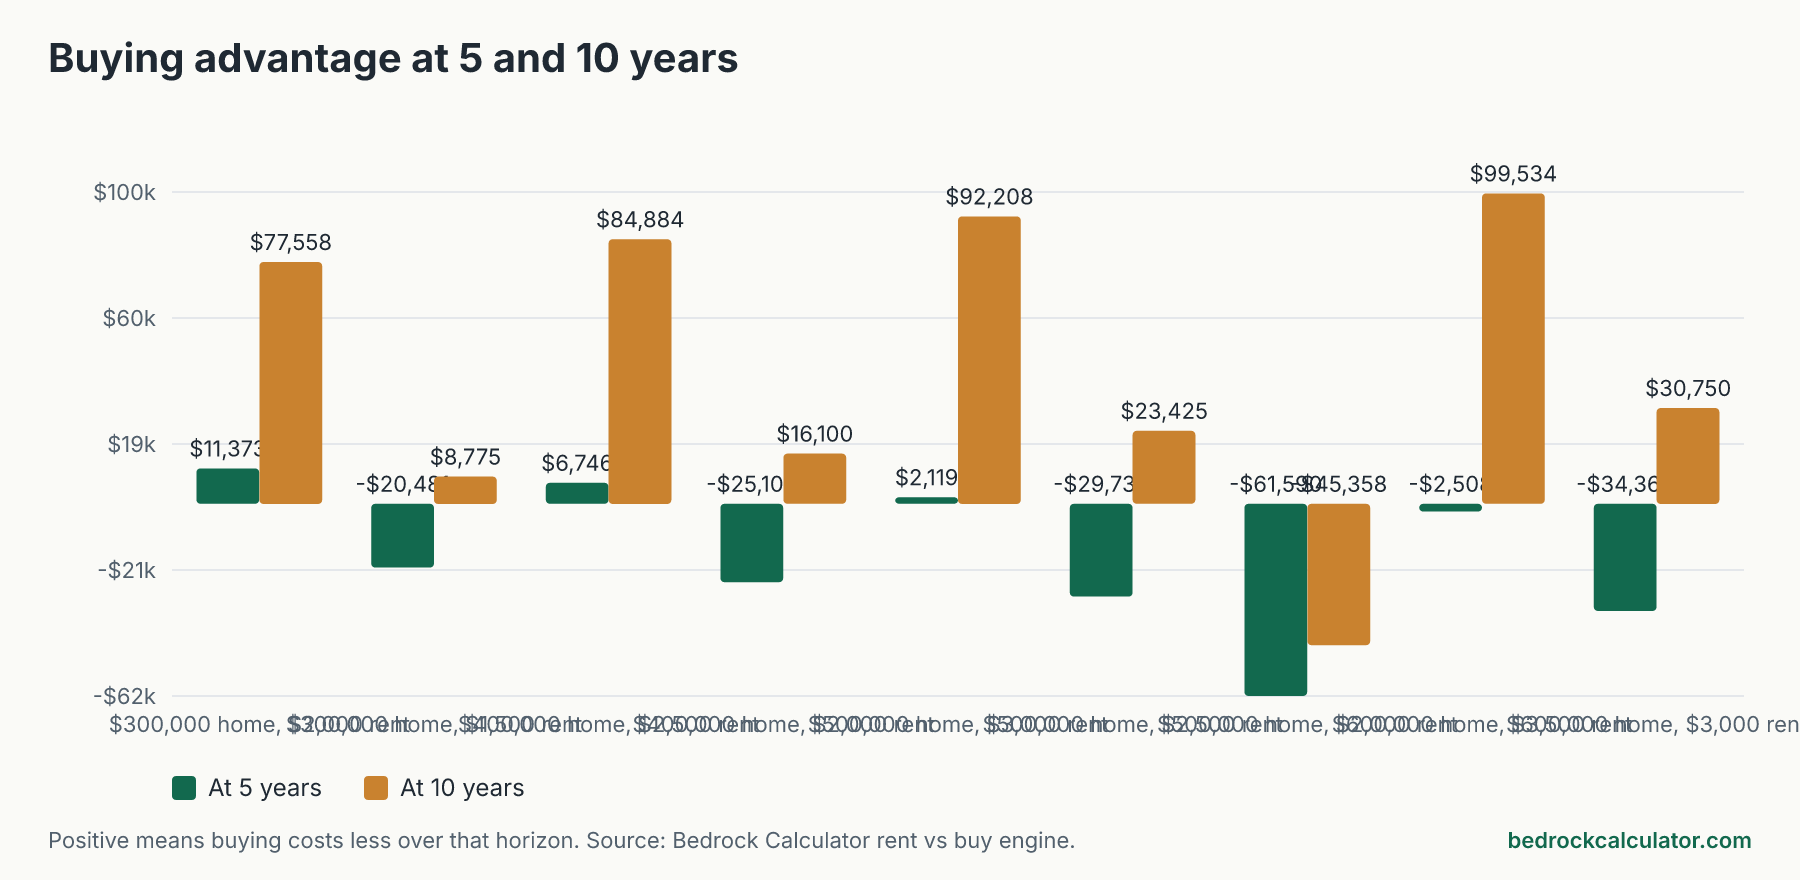
Download CSVFirst whole year at which the net cost of buying is at or below the cost of renting. Calculator defaults for every other input. Negative advantage means renting is cheaper at that horizon.
| $300,000 home, $2,000 rent | 12.5 | $2,114.46 | $11,373.47 | $77,558.28 | 4 |
| $400,000 home, $2,500 rent | 13.3 | $2,777.62 | $6,746.44 | $84,883.56 | 5 |
| $500,000 home, $3,000 rent | 13.9 | $3,440.77 | $2,119.29 | $92,208.34 | 5 |
| $600,000 home, $3,500 rent | 14.3 | $4,103.93 | -$2,507.71 | $99,533.76 | 6 |
| $300,000 home, $1,500 rent | 16.7 | $2,114.46 | -$20,481.35 | $8,775.01 | 9 |
| $400,000 home, $2,000 rent | 16.7 | $2,777.62 | -$25,108.37 | $16,100.28 | 9 |
| $500,000 home, $2,500 rent | 16.7 | $3,440.77 | -$29,735.53 | $23,425.06 | 9 |
| $600,000 home, $3,000 rent | 16.7 | $4,103.93 | -$34,362.52 | $30,750.49 | 9 |
| $500,000 home, $2,000 rent | 20.8 | $3,440.77 | -$61,590.34 | -$45,358.22 | 15 |
The price-to-rent ratio does most of the work
Divide the home price by a year's rent and you get the price-to-rent ratio. Look at the four pairs with a ratio of 16.7: a $300,000 home at $1,500, a $400,000 home at $2,000, a $500,000 home at $2,500 and a $600,000 home at $3,000. All four break even after 9 years. The price level hardly matters; the ratio does.
When the ratio drops, buying wins sooner. At 12.5 it took 4 years. When it climbs, renting stays cheaper for longer. At 20.8, a $500,000 home, $2,000 rent, it took 15 years.
That's a useful shortcut when you're comparing places to live. In areas where homes are expensive relative to rents, renting can be the better deal for a long time, even with home values rising.
Why short stays favor renting
Buying has big one-time costs. For the $400,000 home, you'd need $92,000.00 in cash on day one for the down payment and closing costs, and you pay 7% of the sale price when you leave. Spread over a few years, those costs swamp everything else. Over five years, renting the $2,000 home comes out $25,108.37 cheaper. Over ten, buying is $16,100.28 ahead.
Owning also costs more each month in these examples. In year one the $400,000 home costs $2,777.62 a month in mortgage, tax, insurance and maintenance, against $2,000 in rent. Buying catches up through equity, appreciation and rent increases over time.
The two assumptions that move it most
How the $400,000 vs $2,000 break-even moves with two key assumptions
Download CSVEach row changes one input from the calculator default and keeps the rest.
| Home appreciation a year | 2% | 20 |
| Home appreciation a year | 3.5% | 9 |
| Home appreciation a year | 5% | 5 |
| Return on the down payment if invested | 5% | 7 |
| Return on the down payment if invested | 7% | 9 |
| Return on the down payment if invested | 9% | 15 |
Appreciation. If the home gains only 2% a year, the $400,000 vs $2,000 break-even stretches to 20 years. At 5% it shrinks to 5 years. No one knows what your home will do, so it's worth running a cautious case.
Investment return. The higher the return you could earn on the down payment, the more buying costs you in lost growth. At 5% the break-even is 7 years; at 9%, 15 years.
What this leaves out
The calculator makes simplifications that matter, and you should know them before relying on these numbers:
- The renter's monthly savings aren't invested. Owning the $400,000 home costs more each month than renting. The calculator counts the investment return lost on the down payment, but not on that monthly difference. Counting it would make renting look better and push every break-even later.
- Costs held flat. Property tax, insurance and maintenance stay at their year-one amounts based on the purchase price, even as the home's value rises. In reality they tend to rise.
- No tax effects. The mortgage interest and property tax deductions aren't included, and neither is any tax on investment returns.
- No PMI or HOA dues. With 20% down there's no PMI, and HOA dues aren't an input.
- Annual compounding. The return on the upfront cash compounds once a year.
Run your own numbers
Put your own price, rent, rate and expectations into the rent vs buy calculator. To see what the monthly payment looks like with PMI and your local tax rate, use the mortgage calculator, and the house affordability calculator for what you can borrow. If a smaller down payment is likely, see what PMI costs with a smaller down payment, and how little of each early mortgage payment builds equity.