How much house can a $100,000 salary buy in each US state?
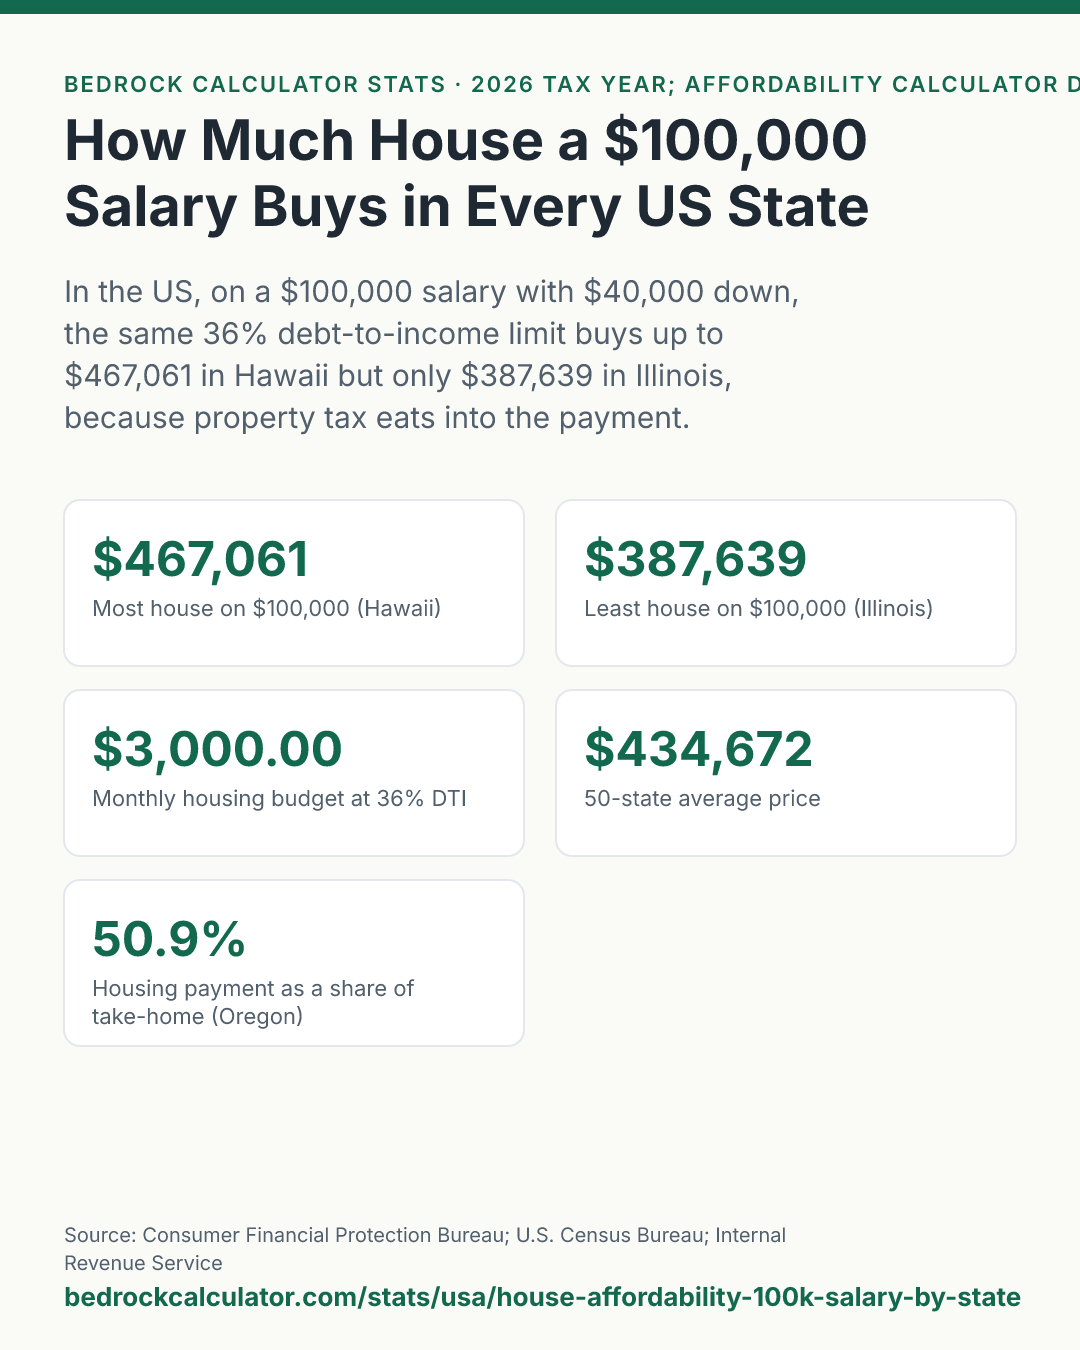
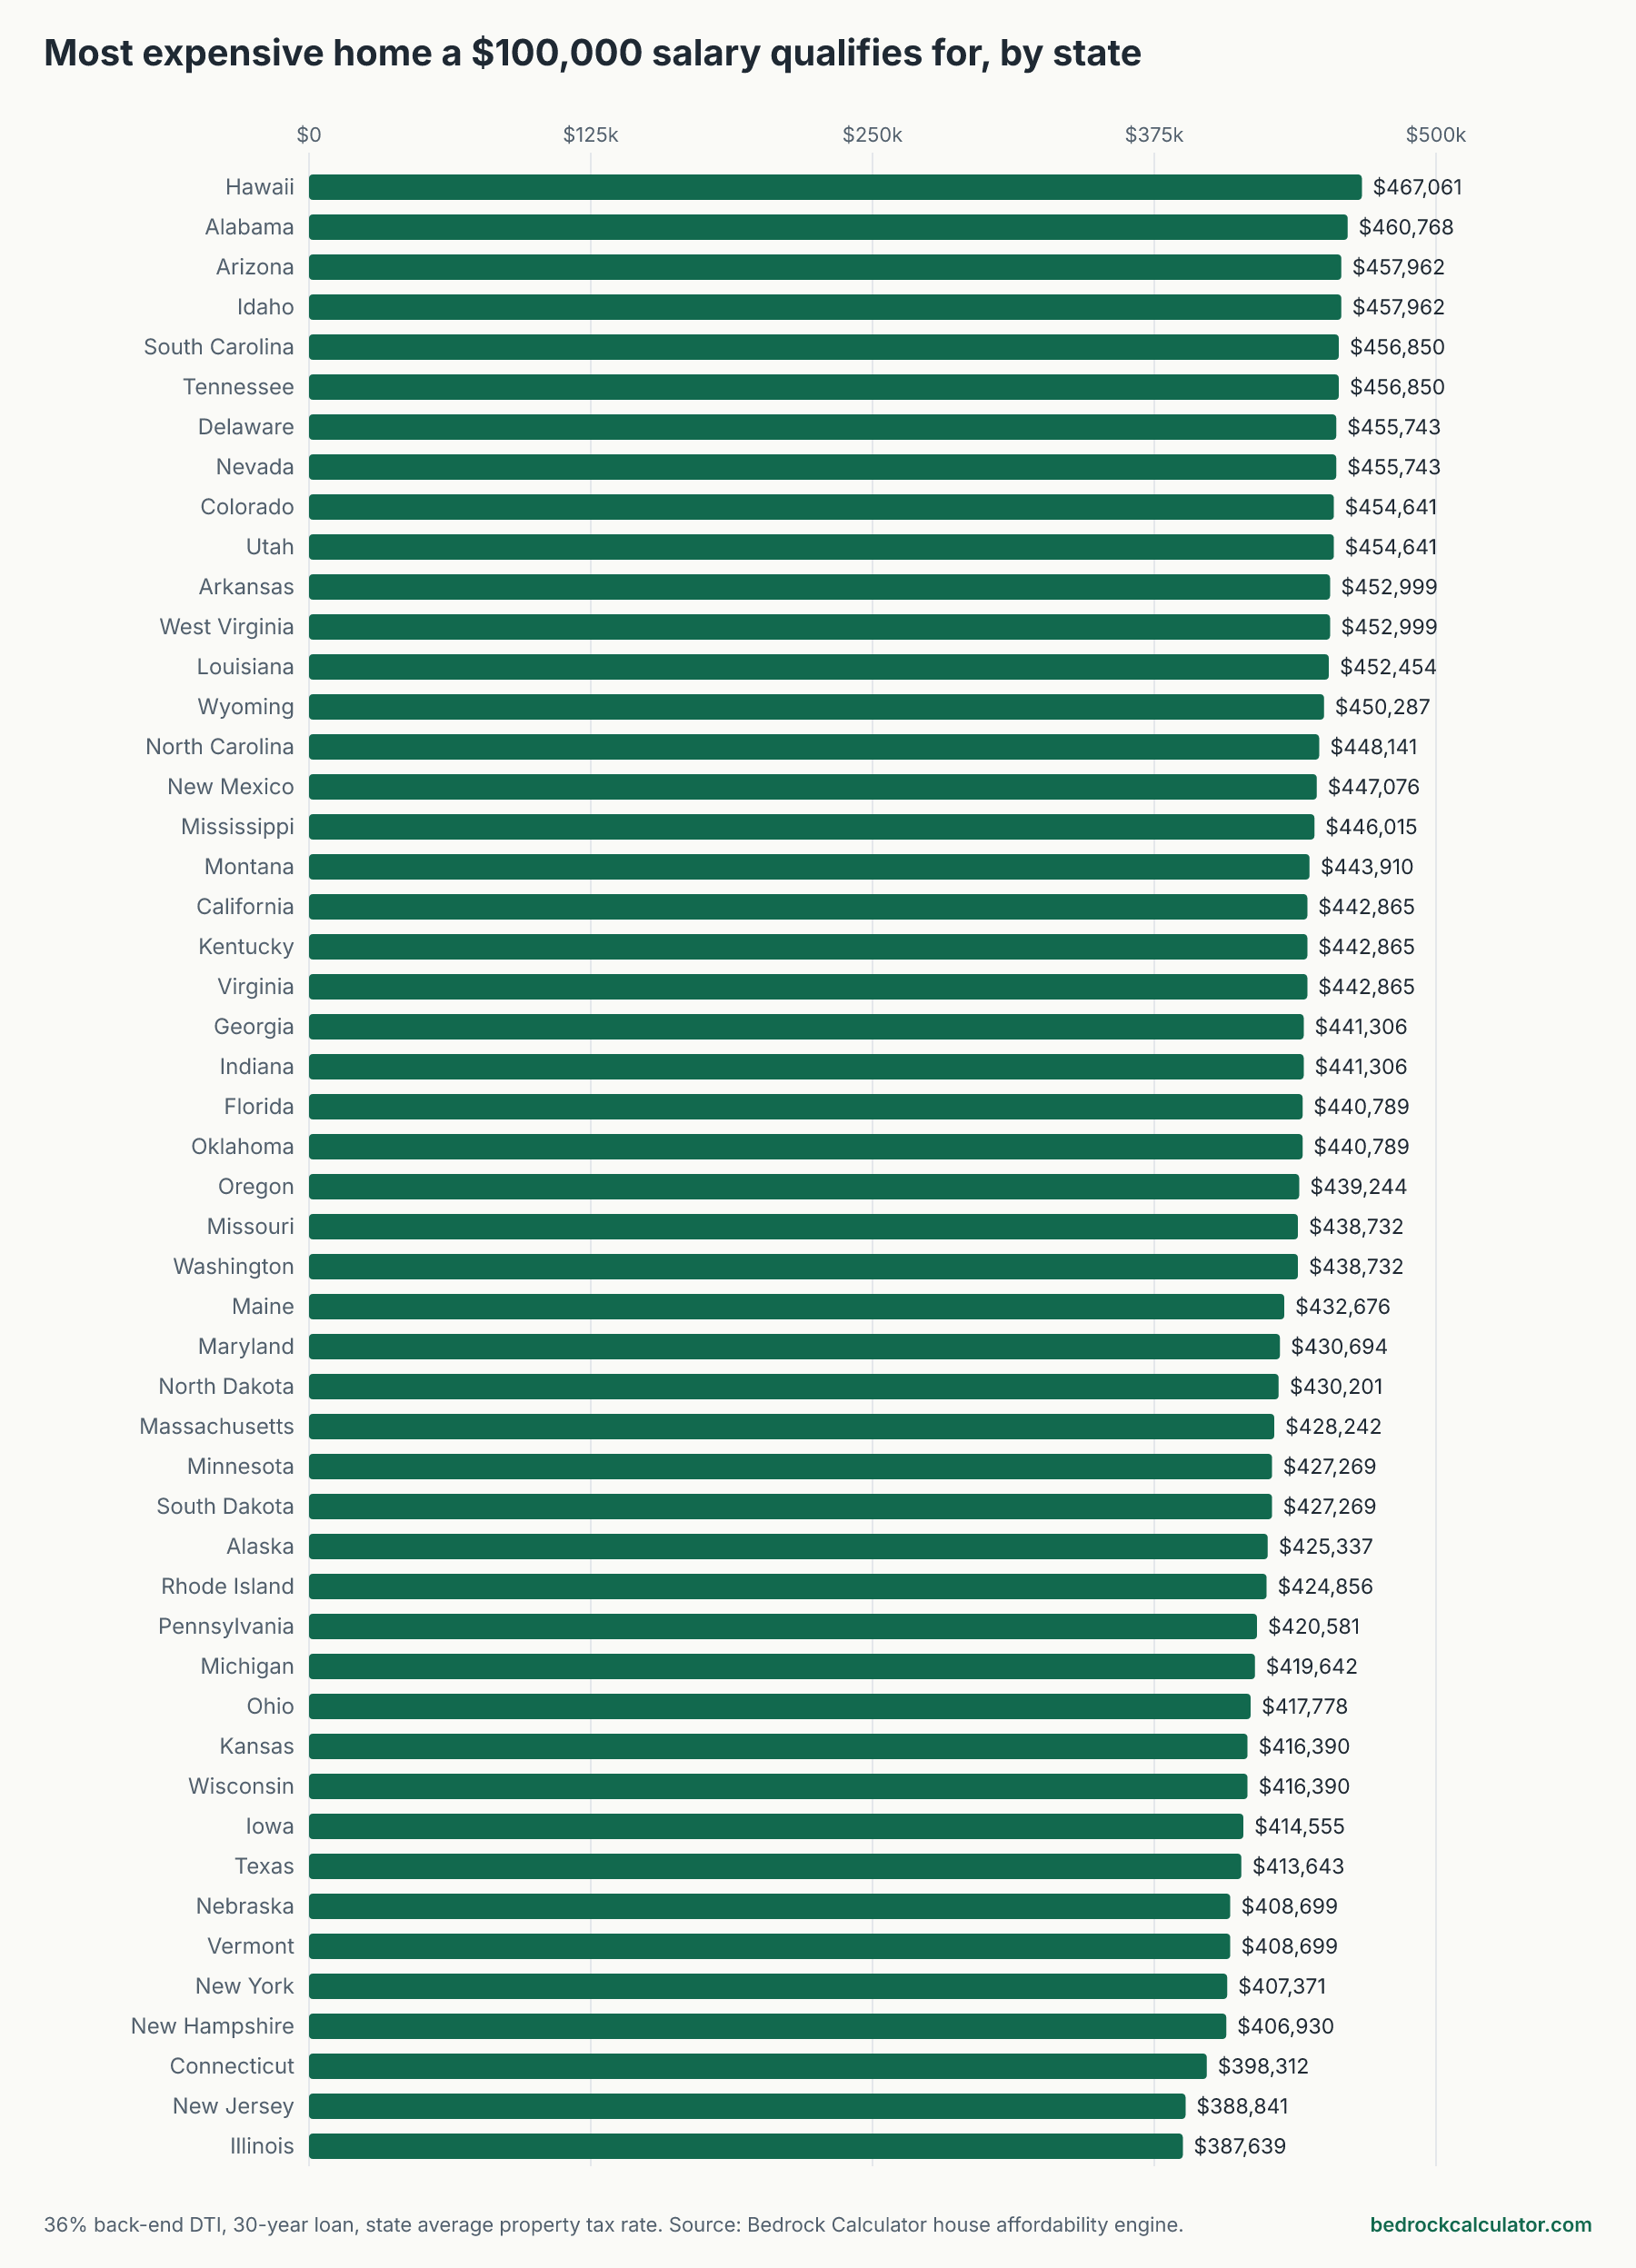
On a $100,000 salary, with no other debts and $40,000 saved for a down payment, the most house a US lender's standard rule will approve ranges from $387,639 in Illinois to $467,061 in Hawaii. That's a $79,423 difference in buying power on the same income.
The reason is property tax. Lenders cap your whole housing payment, tax included, so every dollar that goes to tax is a dollar that can't go to the loan. Across all 50 states the average maximum price is $434,672.
The debt-to-income rule behind these numbers
We ran the house affordability calculator once per state. It uses one rule that many lenders start from: a 36% back-end debt-to-income ratio. Your housing payment plus all your other monthly debt payments can't be more than 36% of your gross monthly income.
On $100,000 a year, gross monthly income is $8,333.33, so with no car loan, student loan or card payments the housing budget is $3,000.00 a month. The calculator then finds the price where principal and interest on a 30-year loan, plus property tax, plus insurance, adds up to exactly that budget.
The inputs we held fixed:
- $100,000 gross salary and no other monthly debts
- $40,000 down payment
- 6.75% interest rate and $1,500 a year of homeowners insurance, both the calculator's defaults
- Each state's average effective property tax rate, from our property tax engine
What the calculator leaves out
A few things would lower these prices in real life, and it's worth knowing them before you shop:
- PMI. $40,000 is under 20 percent of every price on this page, so a conventional lender would add private mortgage insurance. The affordability calculator doesn't include it, so your true maximum would be somewhat lower.
- State insurance costs. Insurance is the same $1,500 a year everywhere because our engine has no state premium data.
- HOA dues, closing costs and cash reserves. None are counted.
- Your lender's actual limits. Some loan programs allow a higher ratio than 36%, and others are stricter. Your credit score also changes the rate you're offered.
Notice, too, that the rate here is the affordability calculator's default, which isn't the same as the mortgage calculator's default. If you compare with our study of the monthly cost of a home in every state, keep that in mind.
How much house $100,000 buys in every US state
Click any column heading to sort. The last two columns bring in the paycheck calculator: what a single filer actually takes home on $100,000 in each state, and what share of that the $3,000.00 payment would eat.
How much house a $100,000 salary buys, by state
Download CSV36% back-end DTI, no other debts, $40,000 down, 30-year loan at the affordability calculator's default rate and insurance. Take-home pay: single filer, no deductions.
| Hawaii | $467,061 | $427,061 | $2,769.91 | $105.09 | 0.27% | $72,689 | 49.5% |
| Alabama | $460,768 | $420,768 | $2,729.09 | $145.91 | 0.38% | $74,220 | 48.5% |
| Arizona | $457,962 | $417,962 | $2,710.90 | $164.10 | 0.43% | $76,680 | 46.9% |
| Idaho | $457,962 | $417,962 | $2,710.90 | $164.10 | 0.43% | $73,880 | 48.7% |
| South Carolina | $456,850 | $416,850 | $2,703.68 | $171.32 | 0.45% | $74,936 | 48.0% |
| Tennessee | $456,850 | $416,850 | $2,703.68 | $171.32 | 0.45% | $79,180 | 45.5% |
| Delaware | $455,743 | $415,743 | $2,696.50 | $178.50 | 0.47% | $73,597 | 48.9% |
| Nevada | $455,743 | $415,743 | $2,696.50 | $178.50 | 0.47% | $79,180 | 45.5% |
| Colorado | $454,641 | $414,641 | $2,689.35 | $185.65 | 0.49% | $74,780 | 48.1% |
| Utah | $454,641 | $414,641 | $2,689.35 | $185.65 | 0.49% | $74,730 | 48.2% |
| Arkansas | $452,999 | $412,999 | $2,678.70 | $196.30 | 0.52% | $75,700 | 47.6% |
| West Virginia | $452,999 | $412,999 | $2,678.70 | $196.30 | 0.52% | $75,398 | 47.7% |
| Louisiana | $452,454 | $412,454 | $2,675.17 | $199.83 | 0.53% | $76,180 | 47.3% |
| Wyoming | $450,287 | $410,287 | $2,661.11 | $213.89 | 0.57% | $79,180 | 45.5% |
| North Carolina | $448,141 | $408,141 | $2,647.19 | $227.81 | 0.61% | $75,190 | 47.9% |
| New Mexico | $447,076 | $407,076 | $2,640.29 | $234.71 | 0.63% | $74,822 | 48.1% |
| Mississippi | $446,015 | $406,015 | $2,633.41 | $241.59 | 0.65% | $75,580 | 47.6% |
| Montana | $443,910 | $403,910 | $2,619.75 | $255.25 | 0.69% | $73,981 | 48.7% |
| California | $442,865 | $402,865 | $2,612.97 | $262.03 | 0.71% | $73,441 | 49.0% |
| Kentucky | $442,865 | $402,865 | $2,612.97 | $262.03 | 0.71% | $75,680 | 47.6% |
| Virginia | $442,865 | $402,865 | $2,612.97 | $262.03 | 0.71% | $73,688 | 48.9% |
| Georgia | $441,306 | $401,306 | $2,602.86 | $272.14 | 0.74% | $74,190 | 48.5% |
| Indiana | $441,306 | $401,306 | $2,602.86 | $272.14 | 0.74% | $76,230 | 47.2% |
| Florida | $440,789 | $400,789 | $2,599.51 | $275.49 | 0.75% | $79,180 | 45.5% |
| Oklahoma | $440,789 | $400,789 | $2,599.51 | $275.49 | 0.75% | $74,895 | 48.1% |
| Oregon | $439,244 | $399,244 | $2,589.49 | $285.51 | 0.78% | $70,749 | 50.9% |
| Missouri | $438,732 | $398,732 | $2,586.17 | $288.83 | 0.79% | $74,661 | 48.2% |
| Washington | $438,732 | $398,732 | $2,586.17 | $288.83 | 0.79% | $79,180 | 45.5% |
| Maine | $432,676 | $392,676 | $2,546.89 | $328.11 | 0.91% | $72,550 | 49.6% |
| Maryland | $430,694 | $390,694 | $2,534.03 | $340.97 | 0.95% | $74,483 | 48.3% |
| North Dakota | $430,201 | $390,201 | $2,530.84 | $344.16 | 0.96% | $78,197 | 46.0% |
| Massachusetts | $428,242 | $388,242 | $2,518.13 | $356.87 | 1.00% | $74,180 | 48.5% |
| Minnesota | $427,269 | $387,269 | $2,511.82 | $363.18 | 1.02% | $72,863 | 49.4% |
| South Dakota | $427,269 | $387,269 | $2,511.82 | $363.18 | 1.02% | $79,180 | 45.5% |
| Alaska | $425,337 | $385,337 | $2,499.29 | $375.71 | 1.06% | $79,180 | 45.5% |
| Rhode Island | $424,856 | $384,856 | $2,496.17 | $378.83 | 1.07% | $75,251 | 47.8% |
| Pennsylvania | $420,581 | $380,581 | $2,468.44 | $406.56 | 1.16% | $76,110 | 47.3% |
| Michigan | $419,642 | $379,642 | $2,462.35 | $412.65 | 1.18% | $74,930 | 48.0% |
| Ohio | $417,778 | $377,778 | $2,450.26 | $424.74 | 1.22% | $76,814 | 46.9% |
| Kansas | $416,390 | $376,390 | $2,441.26 | $433.74 | 1.25% | $73,687 | 48.9% |
| Wisconsin | $416,390 | $376,390 | $2,441.26 | $433.74 | 1.25% | $74,484 | 48.3% |
| Iowa | $414,555 | $374,555 | $2,429.35 | $445.65 | 1.29% | $75,380 | 47.8% |
| Texas | $413,643 | $373,643 | $2,423.44 | $451.56 | 1.31% | $79,180 | 45.5% |
| Nebraska | $408,699 | $368,699 | $2,391.37 | $483.63 | 1.42% | $74,931 | 48.0% |
| Vermont | $408,699 | $368,699 | $2,391.37 | $483.63 | 1.42% | $74,186 | 48.5% |
| New York | $407,371 | $367,371 | $2,382.76 | $492.24 | 1.45% | $73,848 | 48.7% |
| New Hampshire | $406,930 | $366,930 | $2,379.90 | $495.10 | 1.46% | $79,180 | 45.5% |
| Connecticut | $398,312 | $358,312 | $2,324.00 | $551.00 | 1.66% | $74,430 | 48.4% |
| New Jersey | $388,841 | $348,841 | $2,262.58 | $612.42 | 1.89% | $74,936 | 48.0% |
| Illinois | $387,639 | $347,639 | $2,254.78 | $620.22 | 1.92% | $74,230 | 48.5% |
Where $100,000 goes furthest, and why
Hawaii tops the list because its property tax rate is the lowest in the country at 0.27%. Only $105.09 of the monthly budget goes to tax, which leaves $2,769.91 for principal and interest. That supports a price of about 4.7 times salary.
In Illinois, at 1.92%, tax takes $620.22 a month and leaves $2,254.78 for the loan. The approved price drops to about 3.9 times salary. New Jersey is close behind at $388,841.
For a sense of how big the tax effect is: in a state with no property tax at all, the same income would qualify for about $483,264.
A few common searches:
- Texas: about $413,643. High property tax keeps it below average, even though Texas doesn't tax wages.
- Florida: about $440,789.
- California: about $442,865. The median California home is worth $759,500 in the latest Census data, so on one $100,000 income most buyers there would need a much bigger down payment.
The payment a lender allows can take half your paycheck
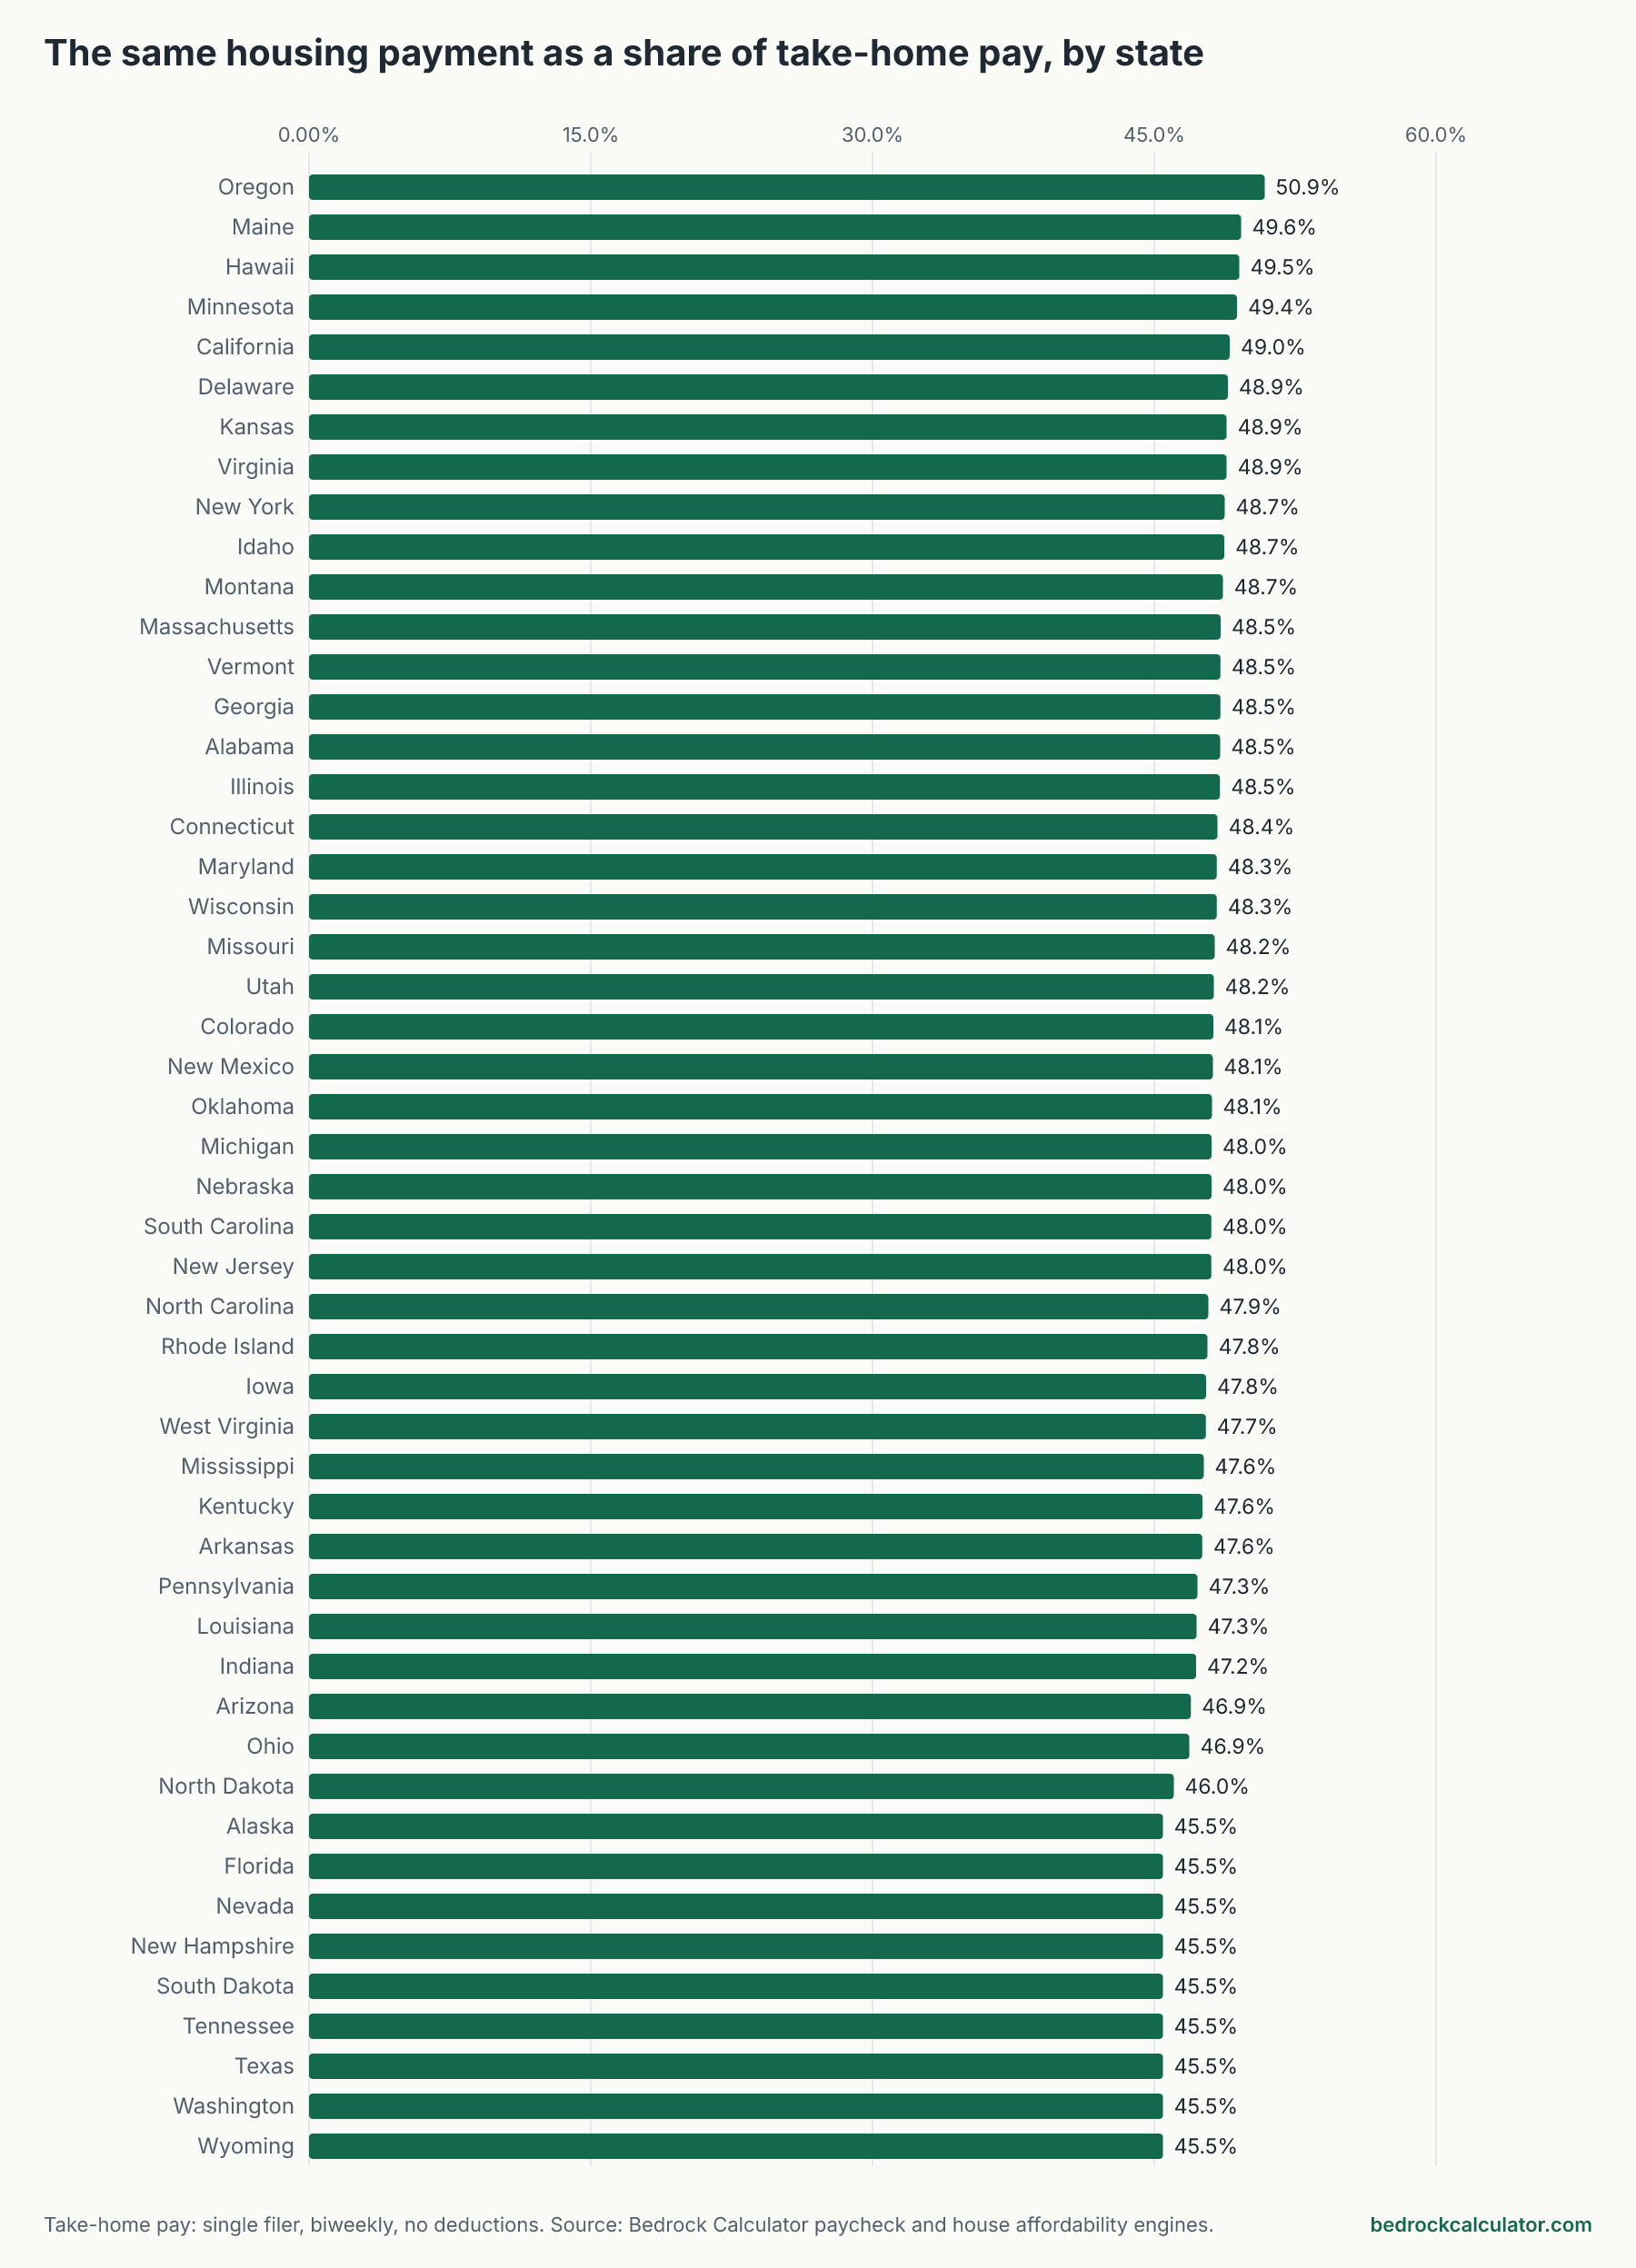
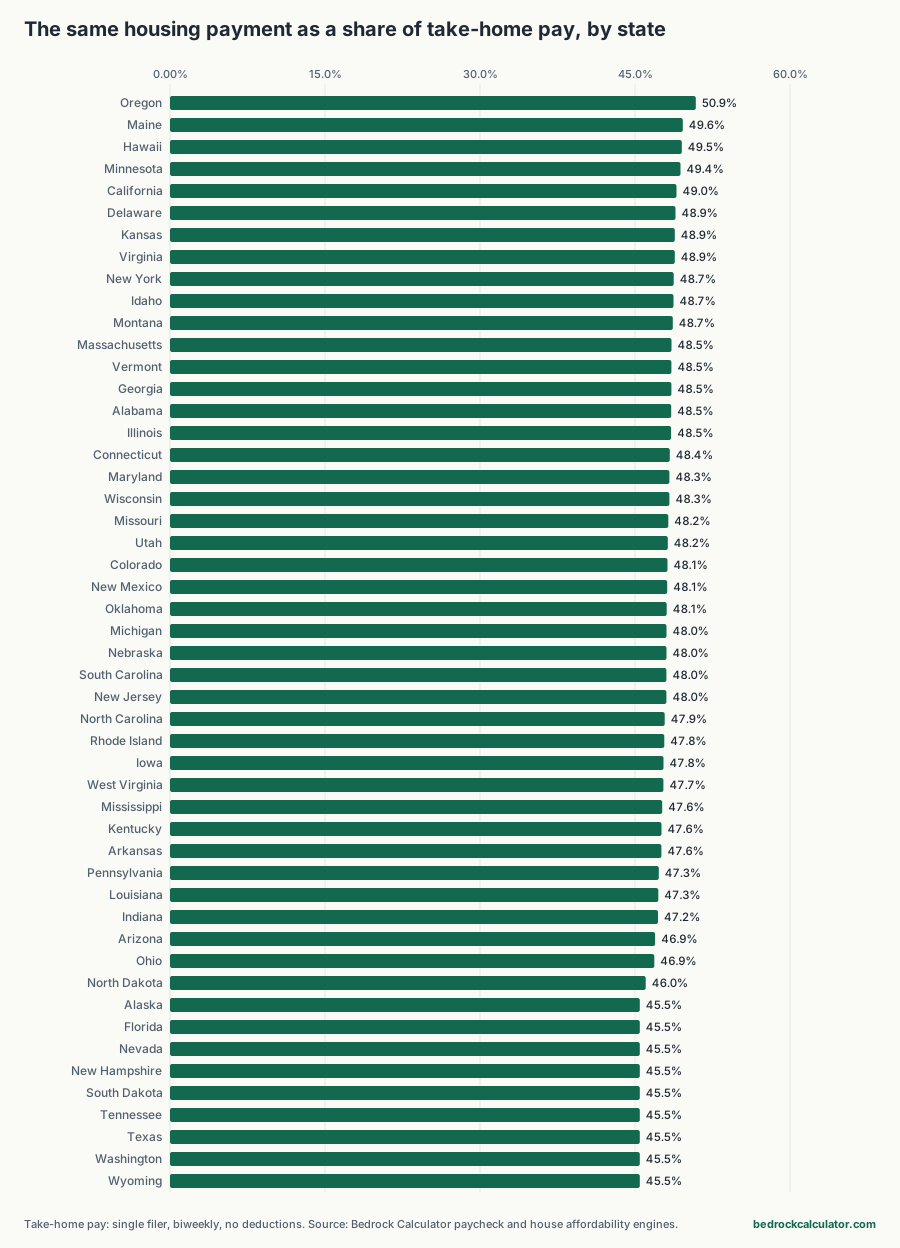
Here's the part that surprises people. The 36% rule is measured against gross pay, before any tax comes out. Measured against what actually lands in your bank account, the same $3,000.00 payment is a much bigger bite.
In Oregon, a single filer keeps $70,749 a year, so the payment would take 50.9% of take-home pay. In the 9 states that don't tax wages (Alaska, Florida, Nevada, New Hampshire, South Dakota, Tennessee, Texas, Washington, Wyoming), take-home is $79,180 and the payment takes 45.5%. California sits at 49.0%, Texas at 45.5%.
So qualifying for a price isn't the same as being comfortable at it. If you also save for retirement, pay for childcare or carry other bills, you may want a target well under the maximum.
Run your own numbers
Start with the house affordability calculator, enter your income, debts and down payment, and swap in your county's property tax rate from the property tax calculator. The debt-to-income ratio calculator shows where your current debts leave you. Then take the price to the mortgage calculator to see the full payment with PMI.