How long does $1 million last in retirement?
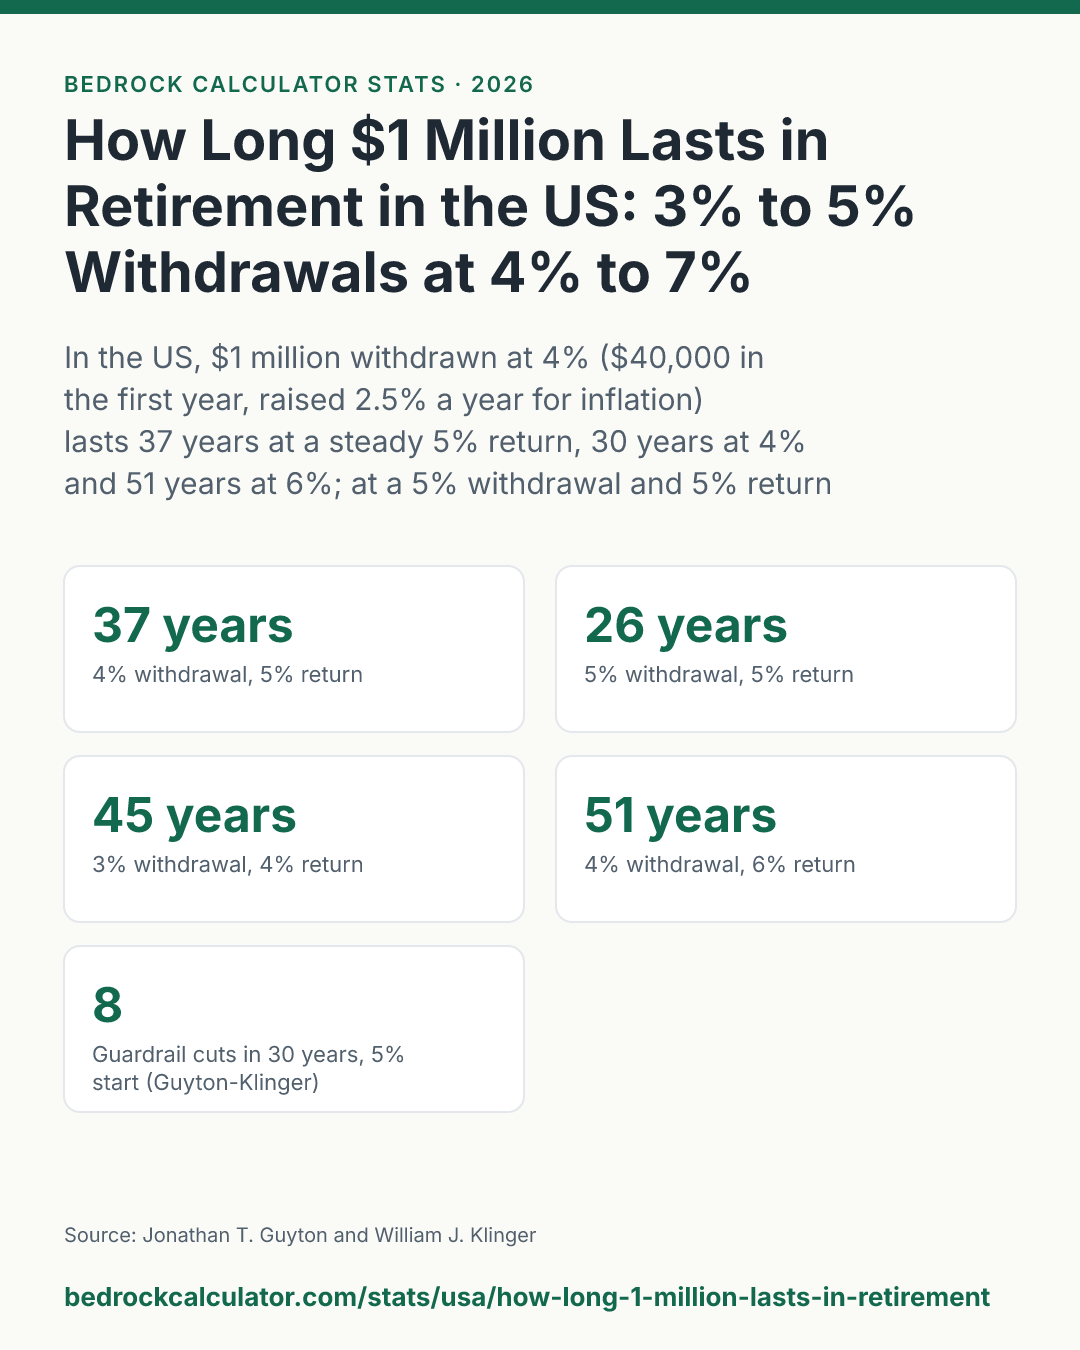
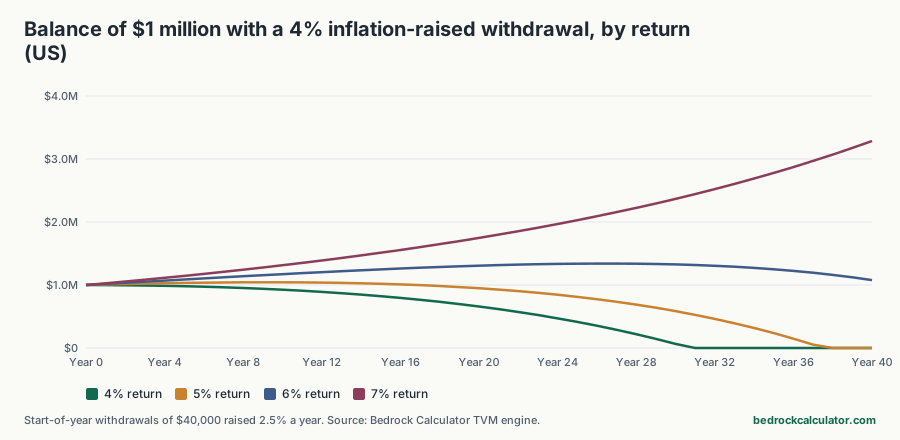
A US retiree who takes 4% of $1 million in the first year, $40,000, and raises it 2.5% a year for inflation gets 37 years of withdrawals if the money earns a steady 5% a year. At a 4% return it's 30 years. At 6% it's 51 years.
Push the withdrawal up to 5%, or $50,000 to start, and the same million lasts 26 years at a 5% return. The return you earn matters about as much as how much you take out.
How we worked out these numbers
We ran each case year by year using the site's time value of money engine, with the same yearly order of events the safe withdrawal rate calculator uses:
- At the start of each year, the year's withdrawal comes out of the portfolio.
- What's left grows for one year at a fixed return.
- The next year's withdrawal is the previous one raised by 2.5%, the inflation assumption that calculator uses by default.
The first withdrawal is the withdrawal rate times $1,000,000, so 3% means $30,000 and 4% means $40,000. We count how many full yearly withdrawals the money pays before it can't cover the next one, and we stop counting at 60 years. Anything that's still funded after that shows as "60+ years".
What this leaves out is just as important as what it includes:
- Returns are steady. Every year earns exactly the same return. Real markets swing, and a run of bad years early in retirement can drain a portfolio much faster than an average return suggests. This is sequence of returns risk, and a fixed-return model can't show it.
- No taxes or fees. Withdrawals from a traditional 401(k) or IRA are taxed as income, and fund fees reduce returns. Both would shorten these timelines.
- No other income. Social Security, pensions and required minimum distributions aren't part of the model. Any income from those sources lowers how much has to come out of savings each year.
Every withdrawal rate and return, side by side
How many years of withdrawals $1 million pays for in the US, by withdrawal rate and return
Download CSVFirst-year withdrawal is the rate times $1,000,000, raised 2.5% a year for inflation, taken at the start of each year. Constant yearly return, no taxes or fees. "60+ years" means money is still left after 60 withdrawals.
| 3.5% ($35,000 a year) | 36 years | 47 years | 60+ years | 60+ years |
| 3% ($30,000 a year) | 45 years | 60+ years | 60+ years | 60+ years |
| 4.5% ($45,000 a year) | 26 years | 31 years | 39 years | 60+ years |
| 4% ($40,000 a year) | 30 years | 37 years | 51 years | 60+ years |
| 5% ($50,000 a year) | 23 years | 26 years | 32 years | 42 years |
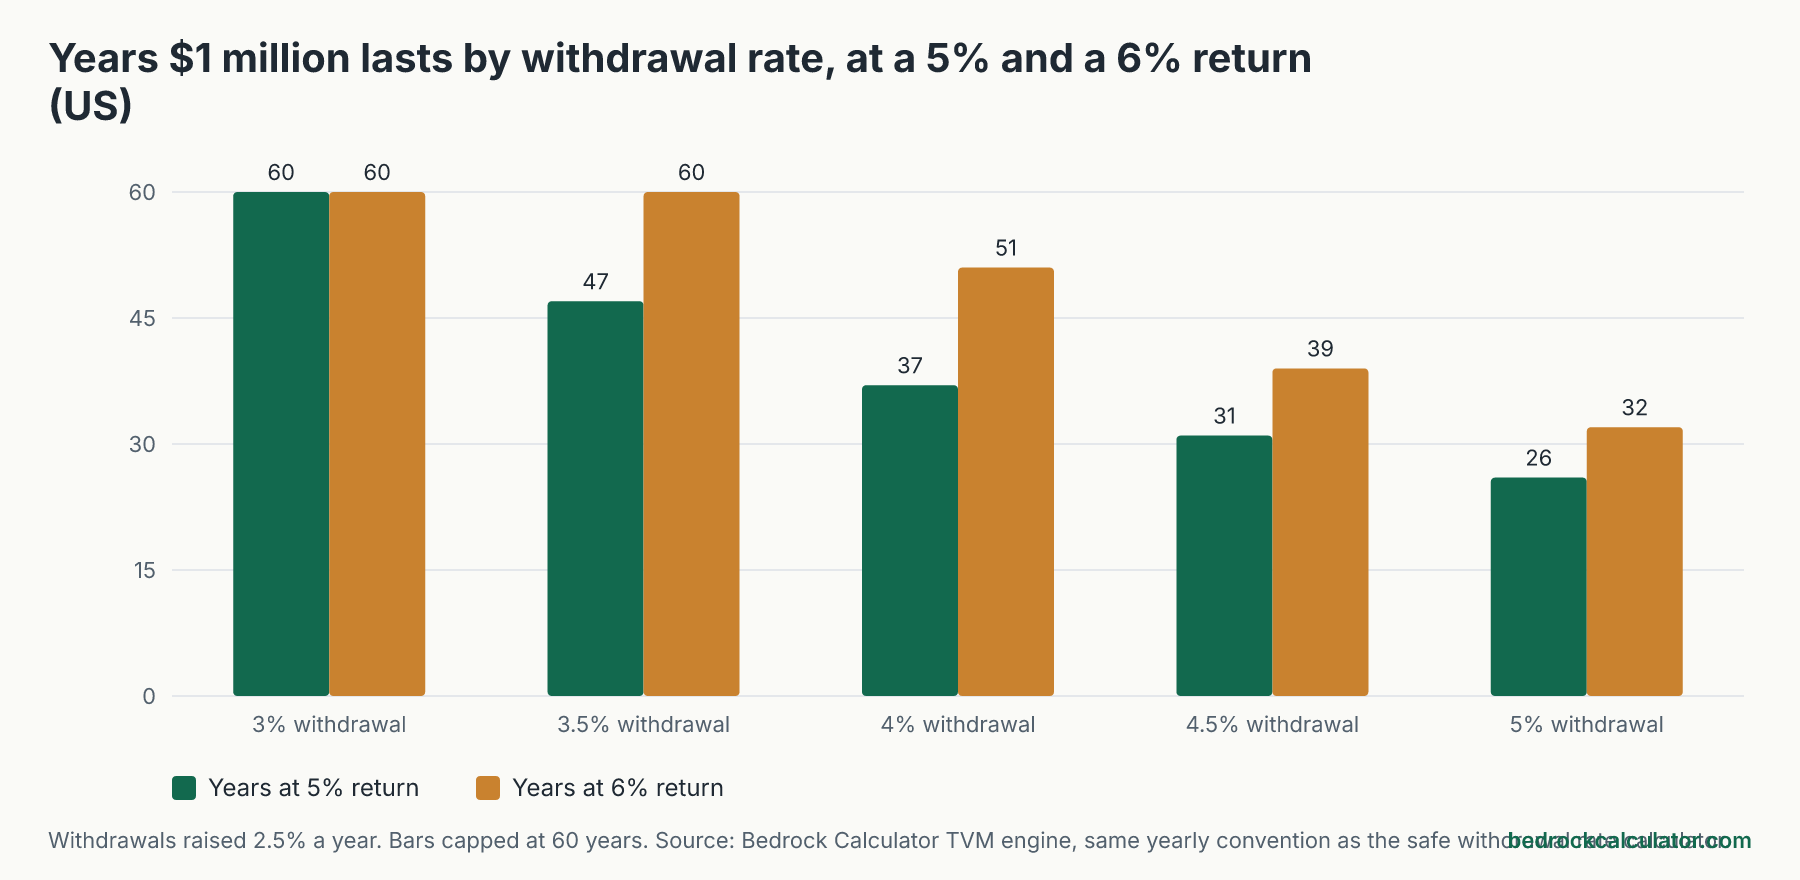
Read across a row and you see how much the return matters. A 4% withdrawal runs out after 30 years at a 4% return but is still going after 60 years at 7%. Read down a column and you see the cost of spending more. At a 5% return, moving from a 3.5% to a 4.5% withdrawal cuts the run from 47 years to 31 years.
The pattern behind it is simple. Your money keeps up only if the return covers both the withdrawal and the inflation raise. When it falls short, the balance shrinks a little faster each year, because the withdrawal keeps growing while the pot it comes from gets smaller.
What the 4% rule looks like on $1 million
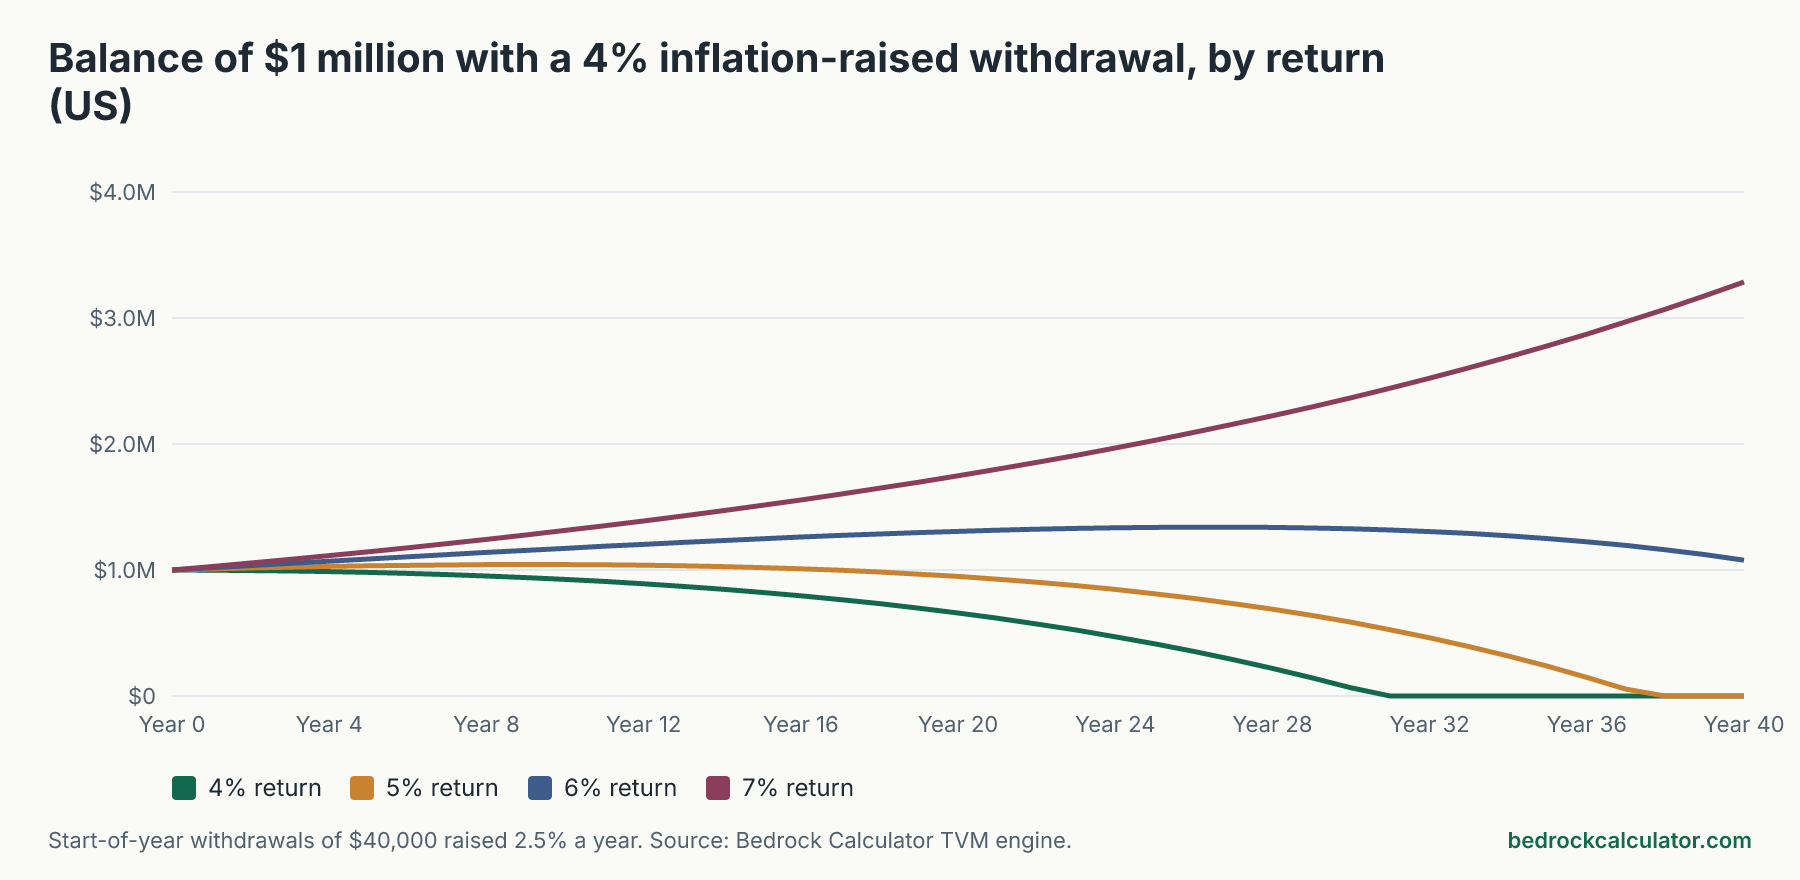
The 4% rule of thumb says you can take 4% of your savings in the first year, raise it with inflation, and expect it to last about 30 years. On $1 million that's $40,000 in year one. With inflation raises it reaches $63,946 a year by year 20.
The chart shows why the return assumption decides the outcome. At 5% the balance drifts down slowly at first, still $948,633 after 20 years, then falls quickly as the bigger withdrawals take hold, and runs out after 37 years. Over that time it pays out $2,442,827 in total. At 6% the balance is $1,326,715 after 30 years, and at 7% it's $2,367,174.
The rule of thumb is meant to hold up through bad stretches in the market, not just average years. A steady-return model is kinder than real history at any given average return, because it never hands you a crash in year two. Don't read "37 years at 5%" as a promise.
Can you safely withdraw 5% a year?
At a 5% withdrawal the margin gets thin. The money lasts 23 years at a 4% return, 26 years at 5%, 32 years at 6% and 42 years at 7%. For someone retiring at 65, the lower end of that range could run out while they're still alive.
One way people make a higher withdrawal work is to agree in advance to spend less when markets fall. That's the idea behind the guardrail rules developed by Jonathan Guyton and William Klinger, which our safe withdrawal rate calculator models. Run with $1,000,000, a 5% start, a 5% return and its default guardrails, it takes $50,000 in year one and then cuts the withdrawal by 10% whenever the current withdrawal rate drifts more than 20% above where it started. Over 30 years it makes 8 cuts, the average withdrawal works out to $49,961, the lowest tenth of years pay $44,308 or less, and the portfolio still holds $755,126 at the end. A fixed 5% withdrawal at the same return runs out after 26 years.
That calculator also uses a single steady return, so it shares the same blind spot on market swings. It does show the trade-off clearly: flexibility in spending buys a much longer-lasting portfolio.
What this means if you're planning on $1 million
Three practical points come out of these numbers.
First, the withdrawal rate you can afford depends on how long you need the money. A couple retiring at 60 should plan for a longer stretch than a single person retiring at 70. A 3% withdrawal lasts 45 years even at a 4% return, which gives a lot of room.
Second, the return assumption deserves more attention than it usually gets. A one-point difference in average return moves a 4% plan from 37 years to 51 years. A portfolio held mostly in cash or bonds may not earn the returns at the right of the table.
Third, your other income changes the question. If Social Security covers half your spending, you only need the portfolio for the other half, and the withdrawal rate on your million falls with it.
Run your own numbers
The safe withdrawal rate calculator lets you change the starting balance, the withdrawal rate, the return and the guardrail settings. The retirement calculator works the other way: it starts from the income you want and your expected Social Security and tells you how much capital you need. To test how market swings change the odds, use the Monte Carlo retirement calculator, and to see how the million gets built in the first place, try the compound interest calculator.