How much of your Social Security is taxable?
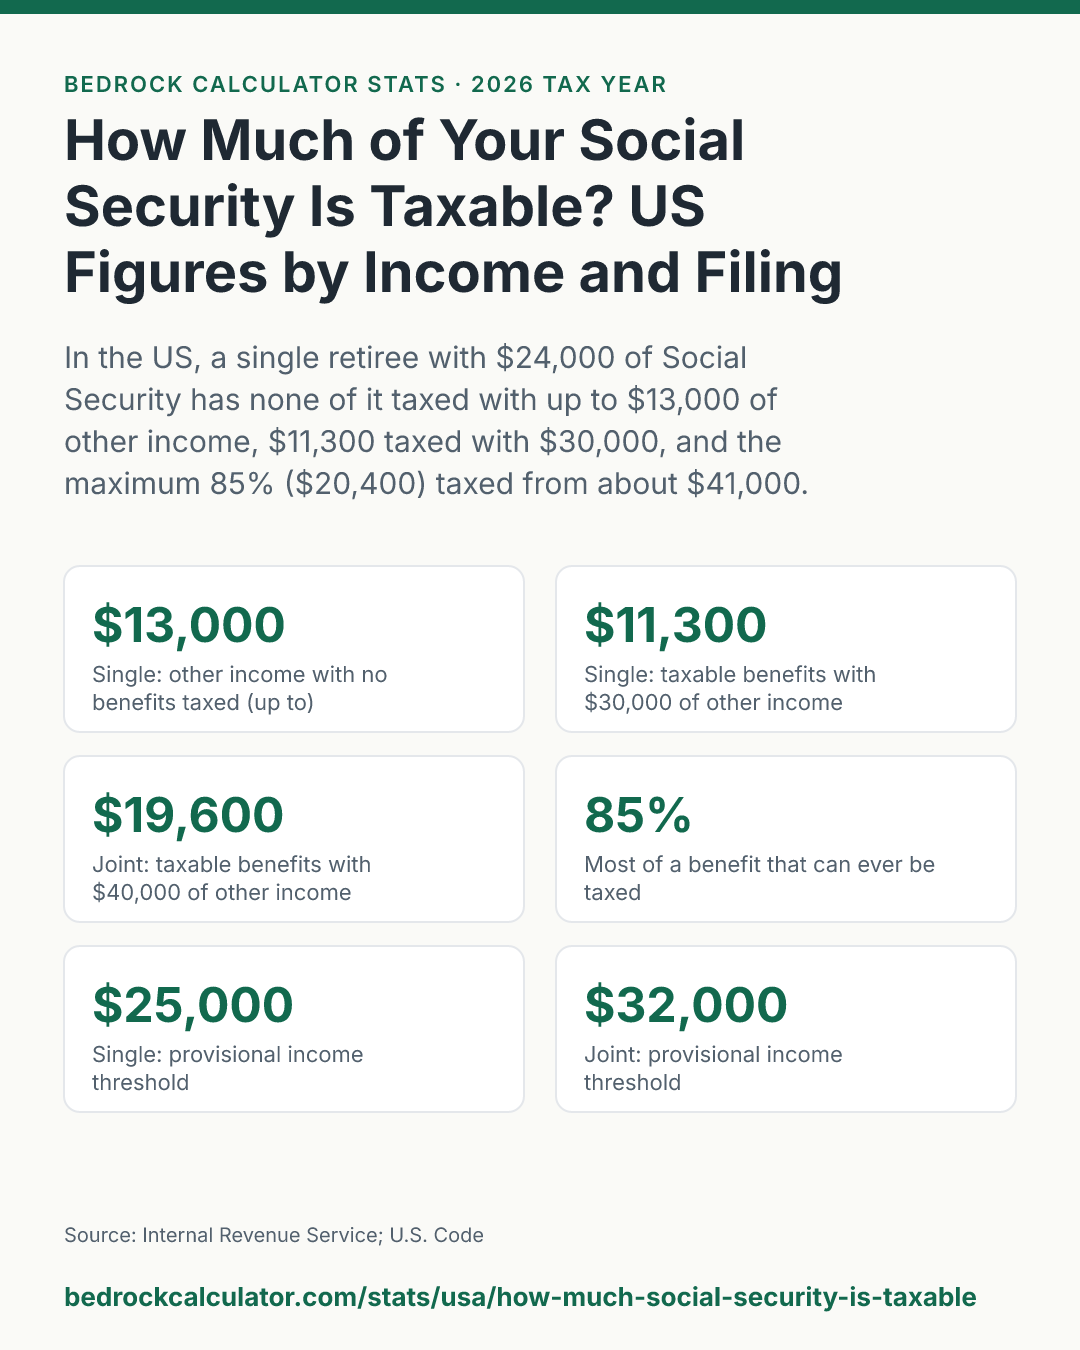
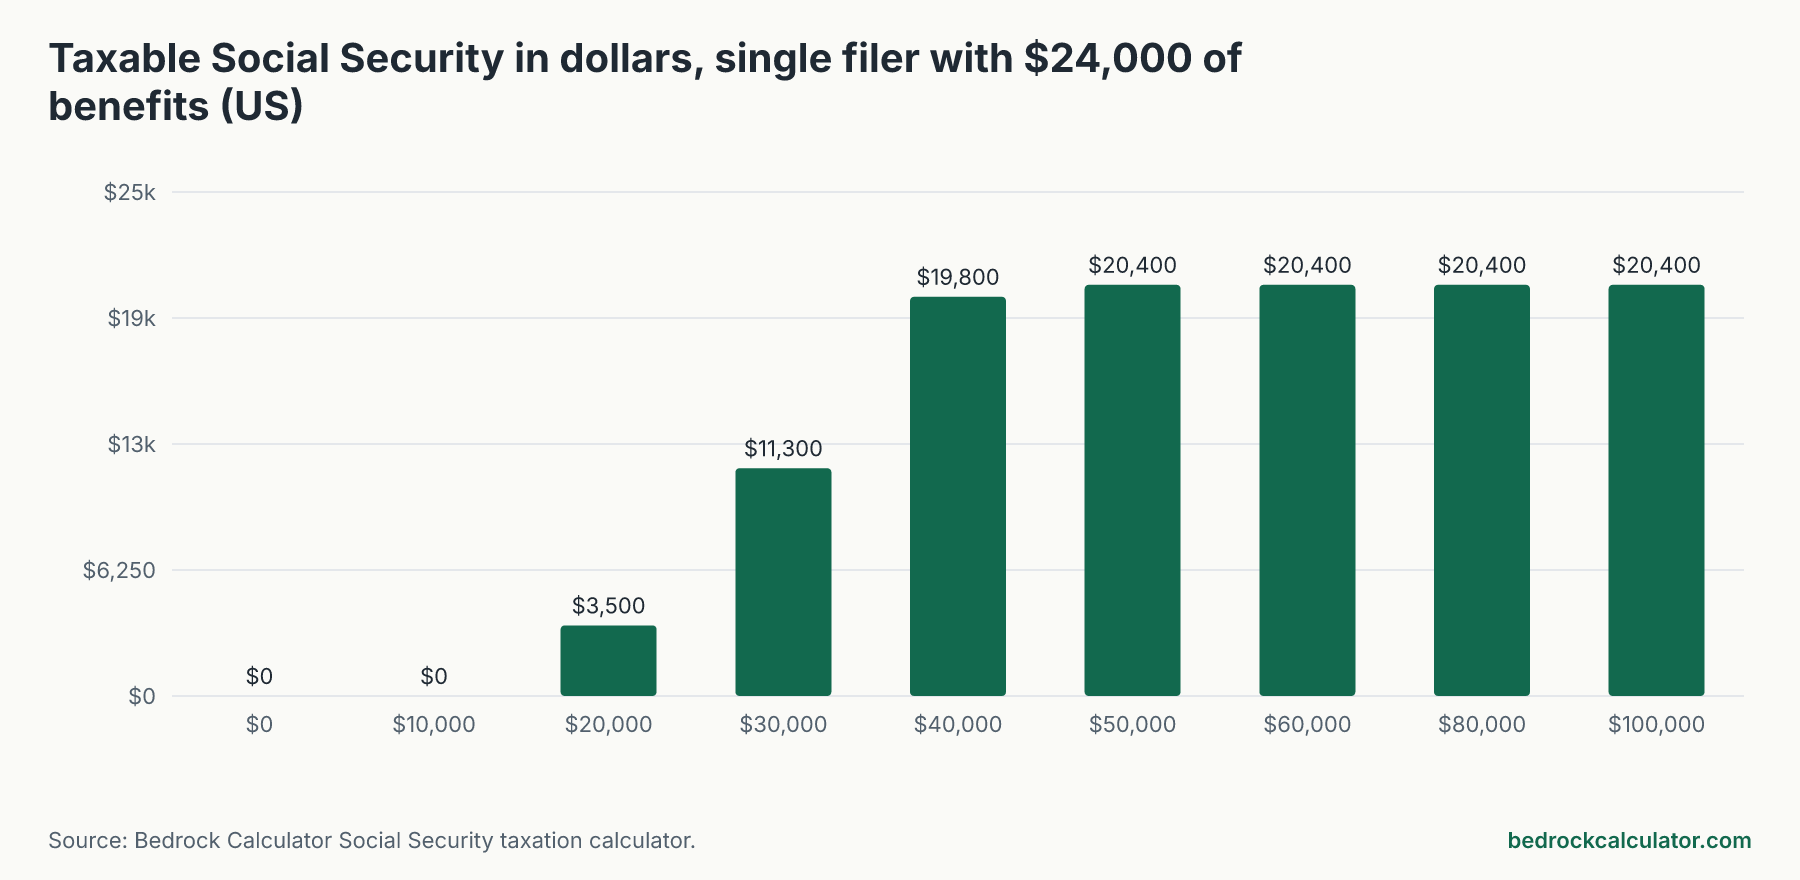
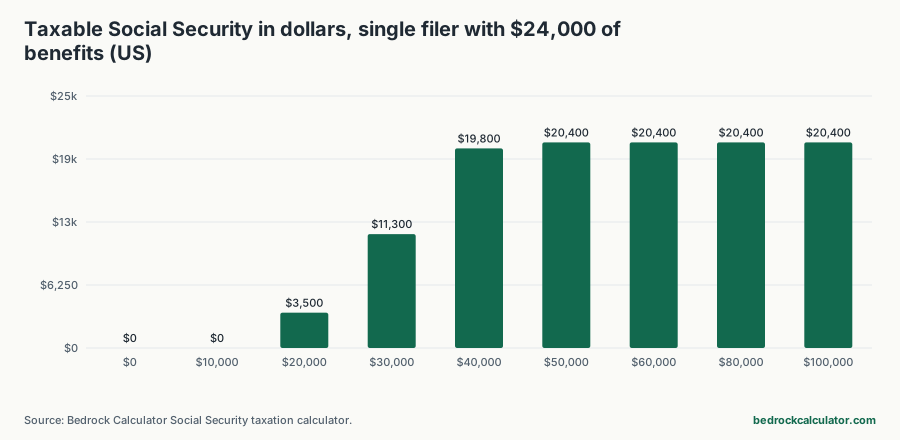
Whether your US Social Security is taxed depends on your other income, not on the benefit itself. A single retiree with $24,000 a year in benefits and up to $13,000 of other income owes no tax on any of it. With $30,000 of other income, $11,300 of the benefit counts as taxable income.
At about $41,000 of other income, the share reaches 85%, the most the law ever taxes.
A married couple filing jointly with $40,000 of benefits has more room: $11,100 is taxable at $30,000 of other income and $34,000 at $60,000.
How we worked out these numbers
Every figure here comes from the site's Social Security taxation calculator, which follows Worksheet 1 in IRS Publication 915 line by line. We ran it for two households:
- A single filer receiving $24,000 a year in Social Security
- A married couple filing jointly receiving $40,000 a year between them
Each one was run at other income from zero to $100,000. "Other income" means adjusted gross income without Social Security: wages, pensions, IRA and 401(k) withdrawals, interest, dividends and capital gains. We assumed no tax-exempt interest except in one example below.
Keep one thing in mind as you read. These figures show how much of your benefit is added to your taxable income. They aren't your tax bill. The taxable part is taxed at your normal federal rate along with the rest of your income, after the standard deduction. To get the actual tax, put the taxable amount into the federal income tax calculator.
State taxes aren't included either. Most states don't tax Social Security, but a few still do under their own rules.
Provisional income: the number that decides it
The IRS uses a figure called provisional income, sometimes called combined income. It's your other income, plus any tax-exempt interest, plus half of your Social Security. For our single retiree, half the benefit is $12,000, so with $30,000 of other income their provisional income is $42,000.
That number is then compared with two thresholds:
- Single, head of household, or married filing separately and living apart: $25,000 and $34,000
- Married filing jointly: $32,000 and $44,000
Below the first threshold, none of your benefit is taxable. Between the two, up to half can be. Above the second, up to 85% can be.
These thresholds are written into the tax code and aren't adjusted for inflation. They haven't changed in decades, while benefits rise with every cost-of-living adjustment. Each year, more retirees cross them.
The full table by income and filing status
How much of your Social Security is taxable in the US, by other income and filing status
Download CSVSingle filer with $24,000 of benefits; married couple filing jointly with $40,000 of combined benefits. Other income is adjusted gross income without Social Security. No tax-exempt interest.
| $0 | $0 | 0.0% | $0 | 0.0% |
| $10,000 | $0 | 0.0% | $0 | 0.0% |
| $20,000 | $3,500 | 14.6% | $4,000 | 10.0% |
| $30,000 | $11,300 | 47.1% | $11,100 | 27.8% |
| $40,000 | $19,800 | 82.5% | $19,600 | 49.0% |
| $50,000 | $20,400 | 85.0% | $28,100 | 70.3% |
| $60,000 | $20,400 | 85.0% | $34,000 | 85.0% |
| $80,000 | $20,400 | 85.0% | $34,000 | 85.0% |
| $100,000 | $20,400 | 85.0% | $34,000 | 85.0% |
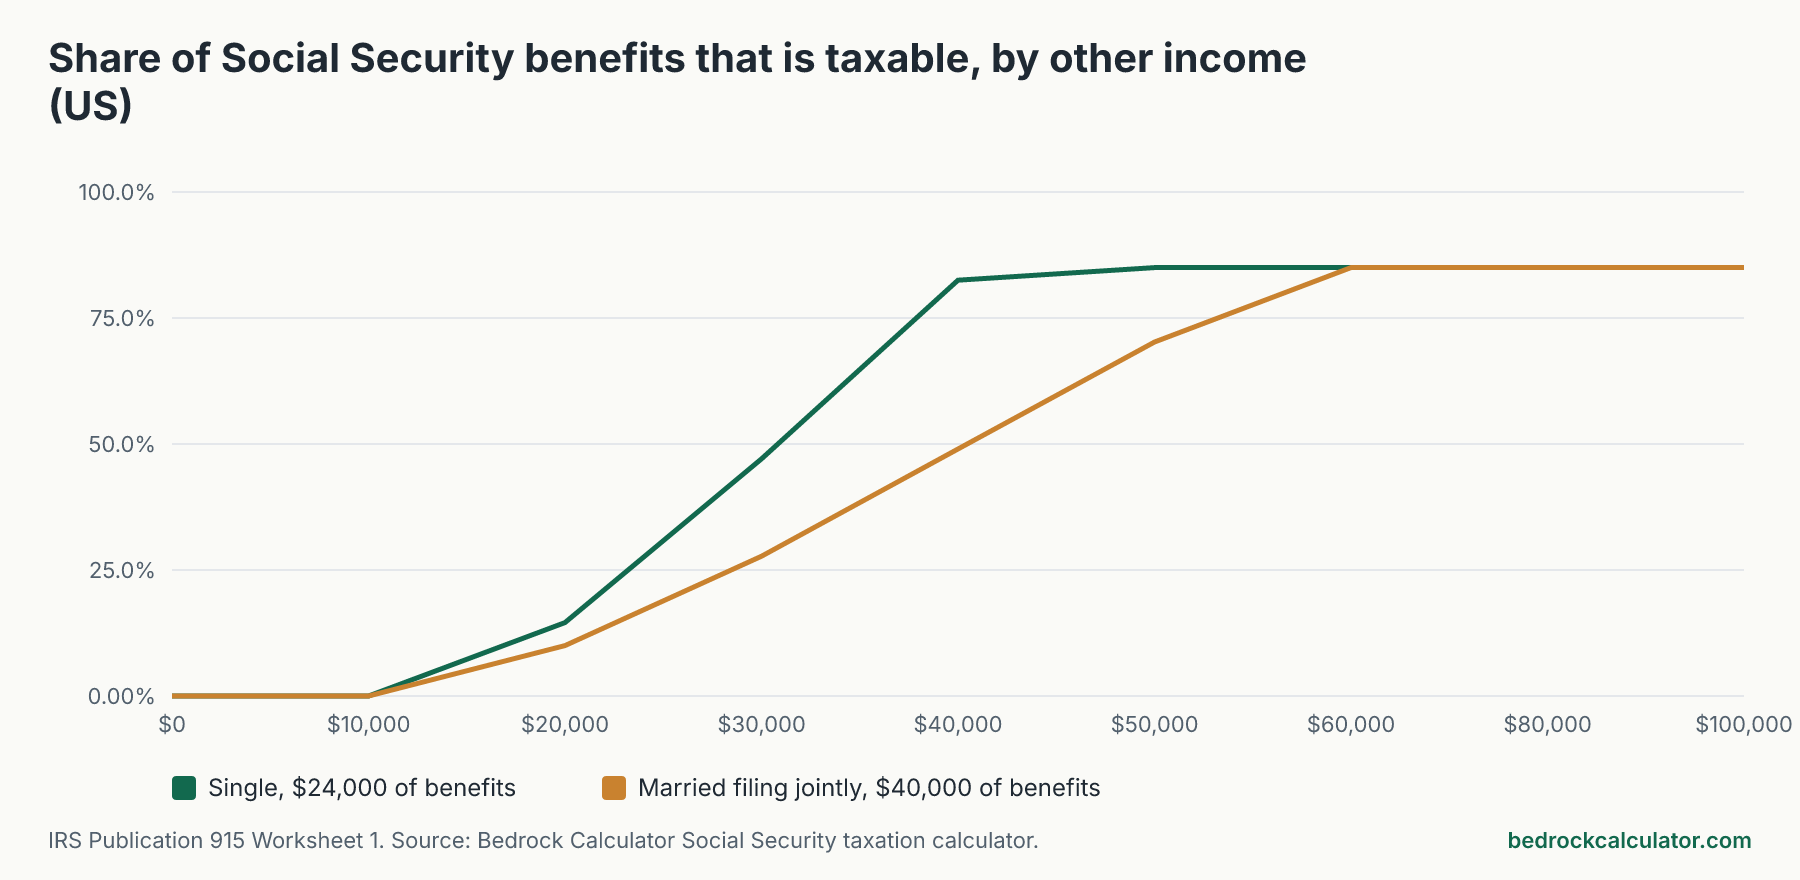
The single column shows how fast the share climbs once it starts. At $20,000 of other income, $3,500 is taxable, or 14.6% of the benefit. At $30,000 it's 47.1%. At $40,000 it's 82.5%. From $50,000 up, it stays at the cap of $20,400.
The joint column climbs more slowly because the thresholds are higher and the couple's benefits are larger. At $40,000 of other income they have $19,600 taxable, 49.0% of their benefits. They hit the cap at about $57,000.
Why the middle range costs more than it looks
In the stretch where benefits are becoming taxable, each extra dollar of other income does double duty. It's taxed itself, and it also pulls some of your Social Security into taxable income.
In the first band, every extra $1,000 of other income makes 50.0% of that amount in benefits taxable as well. In the second band it's 85.0%. So a retiree in the 12% federal bracket who takes an extra $1,000 from an IRA can owe tax on well over $1,000 of income. Planners sometimes call this the tax torpedo. Once the full 85% is taxable, the effect stops, and extra income is taxed normally again.
That's why the timing of IRA withdrawals and Roth conversions matters for people in this range. Taking larger withdrawals before you claim Social Security, or spreading them evenly over several years, can keep more of your benefit out of tax.
Things that catch retirees out
Tax-exempt interest still counts. Municipal bond interest isn't taxed itself, but it's added to provisional income. A single filer with $24,000 of benefits, $20,000 of other income and $10,000 of muni interest has $11,300 of taxable benefits. Without the muni interest it would be $3,500.
Married filing separately is the worst case. If you lived with your spouse at any point in the year, both thresholds are zero. Our single-benefit example with $20,000 of other income would have $20,400 taxable, 85.0% of the benefit.
A big one-off withdrawal can tip you over. Selling an investment with a large gain, or taking money from a 401(k) for a home repair, raises provisional income for that year and can make much more of your benefit taxable than usual.
Lump-sum back payments have a special rule. If you received benefits covering earlier years, the IRS lets you figure the taxable amount as if each part had been paid in its own year. The calculator doesn't do this, so use Publication 915 if it applies to you.
Run your own numbers
Enter your benefit from your SSA-1099, your other income and your filing status in the Social Security taxation calculator. Then take the taxable amount to the federal income tax calculator to see the tax itself. If you haven't claimed yet, the Social Security breakeven calculator compares claiming ages, and the retirement calculator shows how benefits fit with your savings.