How long can a 65-year-old in the US expect to live?
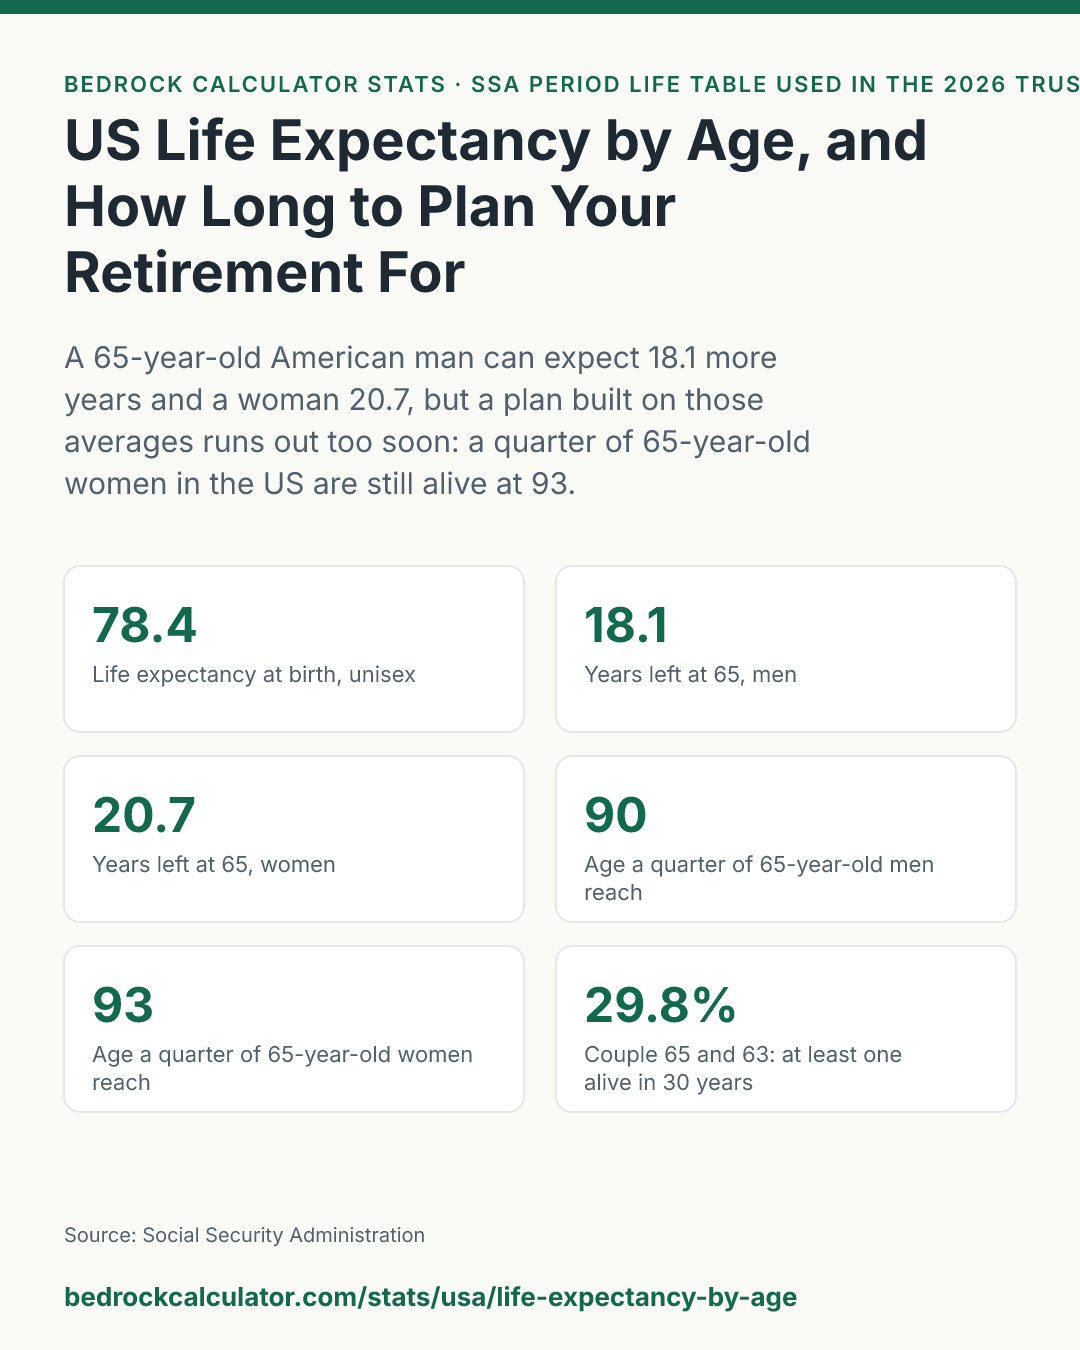
According to the Social Security Administration's period life table, a 65-year-old man in the US can expect to live 18.1 more years and a 65-year-old woman 20.7. That puts the average age at death at about 83.1 for men and 85.7 for women.
But an average is the wrong number to plan around. Half of 65-year-old women in our model are still alive at 87, a quarter at 93 and one in ten at 98. If you plan for your money to last to your life expectancy, there's roughly an even chance you'll outlive it.
Where these numbers come from
The life expectancy figures are the SSA's own period life table, as held in the site's engine. The SSA publishes it from its Office of the Chief Actuary, and the version used in the 2026 Trustees Report reflects mortality in 2023. Period tables always lag a few years because death data takes time to finalize.
The survival odds come from the site's actuarial engine, the same one behind the joint life expectancy calculator. It takes the SSA's annual death rates at 7 ages between 60 and 90, fits a smooth curve through them in which the risk of dying rises by a roughly constant percentage each year, and compounds the yearly chance of surviving. That makes the odds a model rather than a published table, and the figures for ages beyond 90 rely on the curve continuing the same way.
What these numbers don't reflect:
- Your own health. Smoking, chronic illness and family history move your odds far more than any average.
- Income and education. People with higher incomes live noticeably longer than the national average, so readers of a retirement planning page probably should, too.
- Future improvement. A period table uses today's death rates for every future year. If mortality keeps falling, these figures understate how long people will live.
- Couples as a unit. The joint figures treat two people's lives as independent, though in practice spouses share habits, homes and health care.
US life expectancy at every age
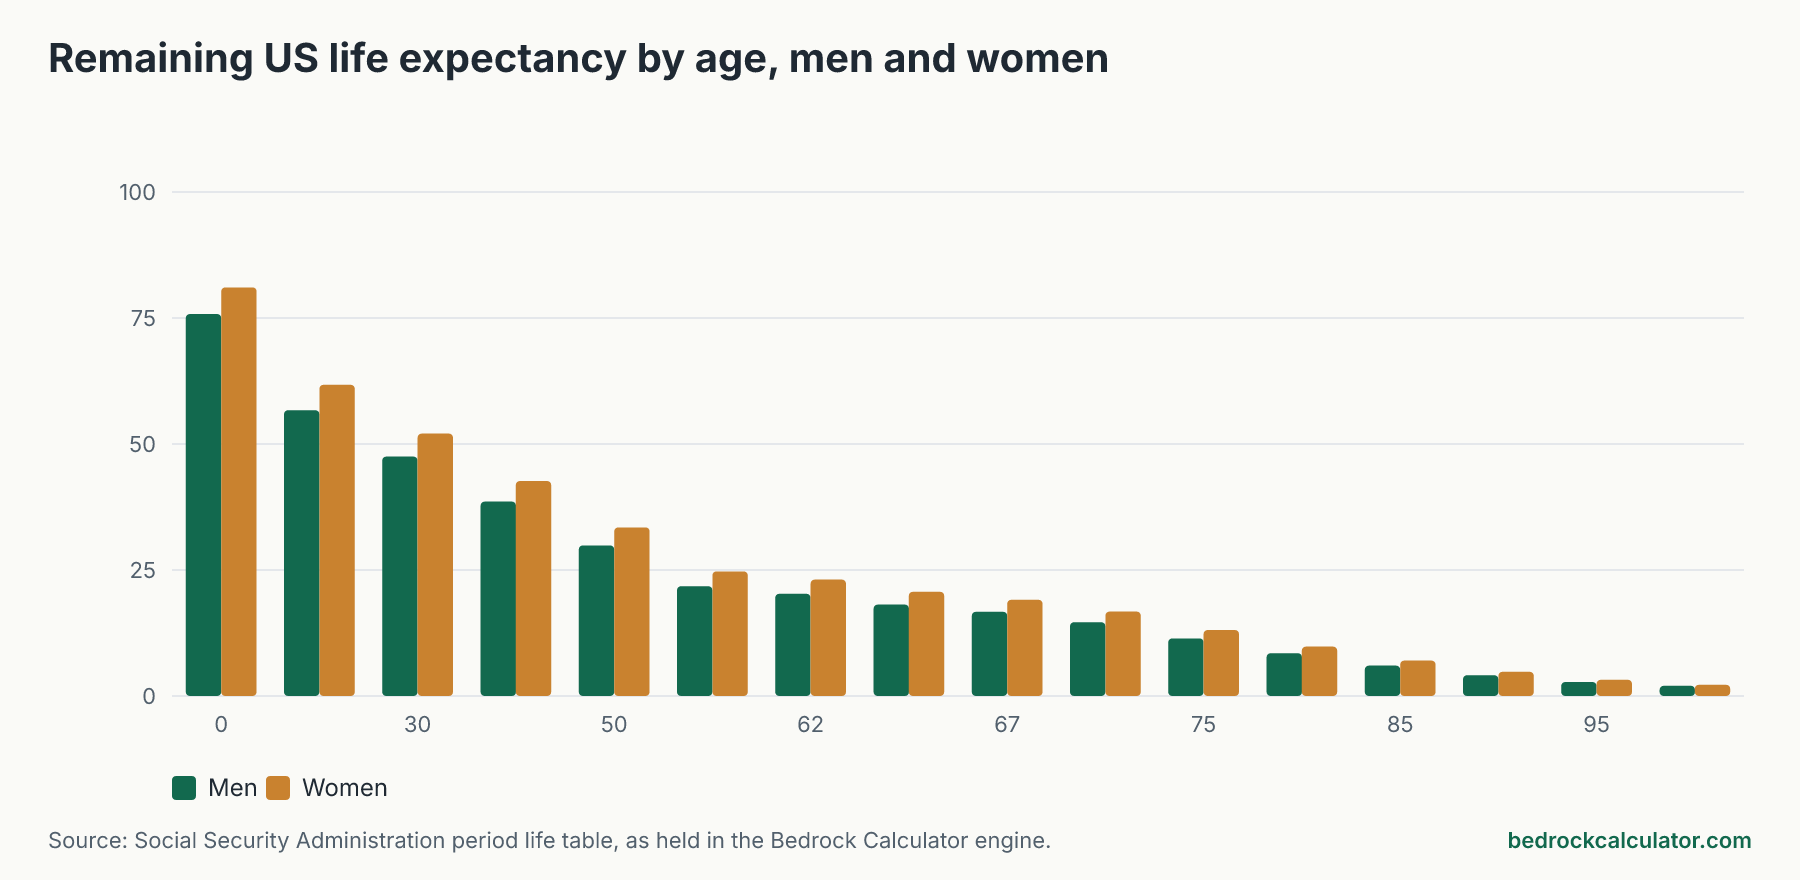
US life expectancy by age, SSA period life table
Download CSVRemaining years of life at each exact age, and the average age at death that implies. Unisex is the simple average of the male and female figures.
| 0 | 75.79 | 81.06 | 78.43 | 75.79 | 81.06 |
| 20 | 56.69 | 61.74 | 59.22 | 76.69 | 81.74 |
| 30 | 47.5 | 52.08 | 49.79 | 77.5 | 82.08 |
| 40 | 38.59 | 42.64 | 40.62 | 78.59 | 82.64 |
| 50 | 29.9 | 33.45 | 31.68 | 79.9 | 83.45 |
| 60 | 21.79 | 24.73 | 23.26 | 81.79 | 84.73 |
| 62 | 20.29 | 23.08 | 21.69 | 82.29 | 85.08 |
| 65 | 18.12 | 20.66 | 19.39 | 83.12 | 85.66 |
| 67 | 16.71 | 19.08 | 17.9 | 83.71 | 86.08 |
| 70 | 14.66 | 16.76 | 15.71 | 84.66 | 86.76 |
| 75 | 11.42 | 13.1 | 12.26 | 86.42 | 88.1 |
| 80 | 8.5 | 9.82 | 9.16 | 88.5 | 89.82 |
| 85 | 6.04 | 7.02 | 6.53 | 91.04 | 92.02 |
| 90 | 4.11 | 4.8 | 4.46 | 94.11 | 94.8 |
| 95 | 2.77 | 3.23 | 3 | 97.77 | 98.23 |
| 100 | 2.04 | 2.23 | 2.14 | 102.04 | 102.23 |
The figure that surprises people is how the average age at death rises as you get older. At birth a man's life expectancy is 75.8 years. A man who has reached 65 can expect to live to about 83.1, and one who has reached 80 to about 88.5. That isn't a contradiction. Each year you survive removes the chance of having died earlier, so the average for the people still alive moves up.
Women live longer at every age, by 5.3 years at birth and 2.5 years at 65.
How long should your retirement savings last?
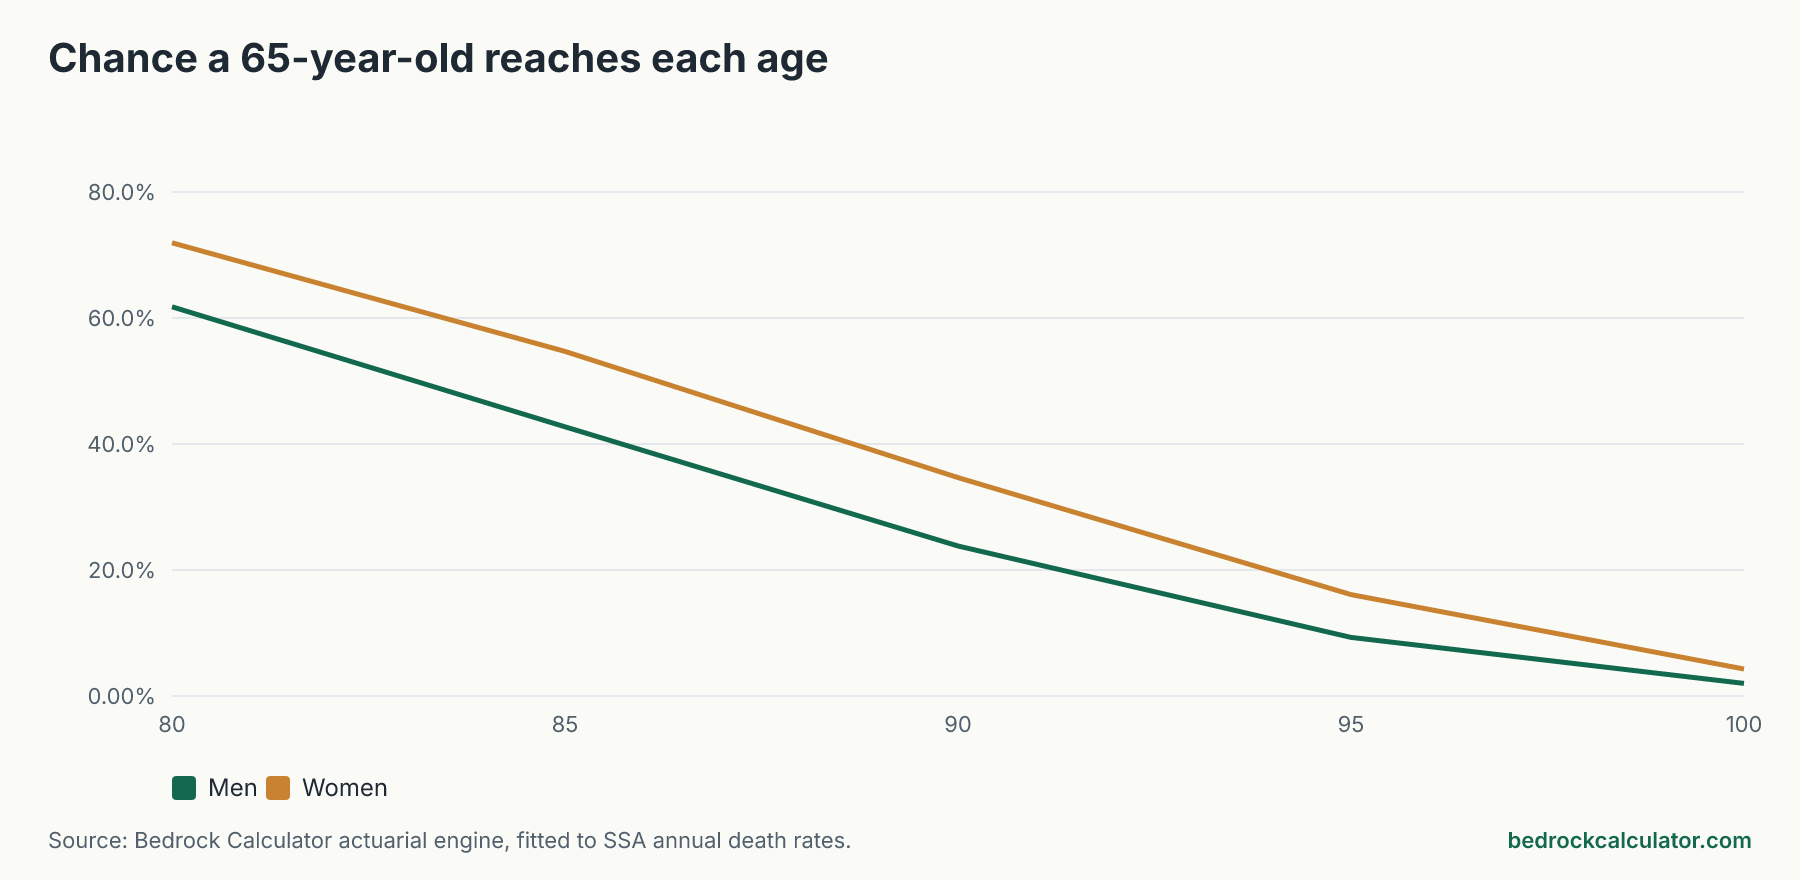
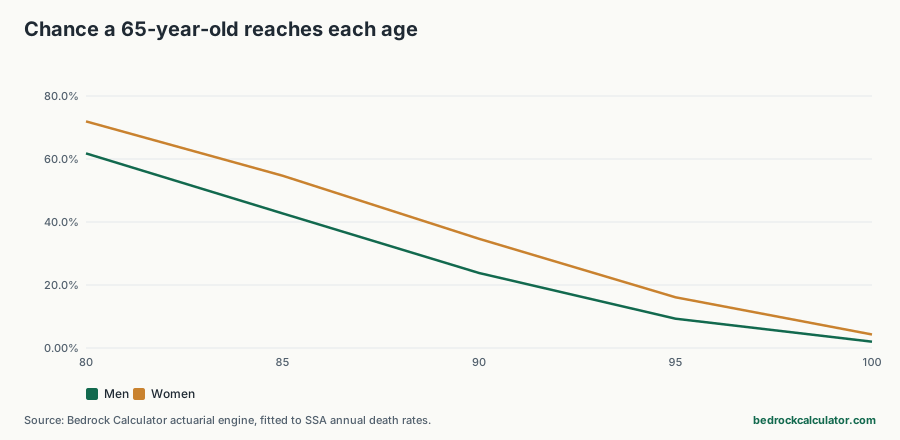
Life expectancy tells you the middle of the range. Retirement planning has to cover the tail. Here's the chance that someone who has reached 65 lives to each age:
Chance a 65-year-old in the US lives to each age
Download CSVFrom the engine's actuarial model, fitted to the SSA annual death rates at ages 60 to 90.
| 80 | 61.8% | 71.9% |
| 85 | 42.7% | 54.7% |
| 90 | 23.8% | 34.7% |
| 95 | 9.3% | 16.1% |
| 100 | 2.0% | 4.3% |
So 23.8% of 65-year-old men and 34.7% of 65-year-old women reach 90, and 9.3% and 16.1% reach 95.
A common way to turn that into a planning horizon is to pick a survival chance you're willing to plan past. Using our model:
- 50% chance: to 84 for a man, 87 for a woman
- 25% chance: to 90 for a man, 93 for a woman
- 10% chance: to 95 for a man, 98 for a woman
Many planners use the 25% or 10% point, because running out of money at 92 is a far worse outcome than leaving some behind. The retirement Monte Carlo calculator lets you test whether a portfolio survives to whichever age you choose.
Planning for two: the joint life expectancy
For a married couple the question isn't when one of you dies, but when the second does. That horizon is longer than either person's alone.
A couple aged 65 (man) and 63 (woman): chance one or both are still alive
Download CSVFrom the joint life expectancy calculator, which treats the two lives as independent.
| 20 | 42.7% | 61.0% | 26.1% | 77.7% |
| 25 | 23.8% | 42.1% | 10.0% | 55.9% |
| 30 | 9.3% | 22.6% | 2.1% | 29.8% |
| 35 | 2.0% | 7.8% | 0.2% | 9.7% |
Take a man of 65 and a woman of 63. In 30 years there's a 9.3% chance he's alive and a 22.6% chance she is, but a 29.8% chance at least one of them is. Twenty years out, at least one is alive 77.7% of the time. A plan built around the man's life expectancy alone would leave the surviving spouse short in many cases.
You can run your own ages in the joint life expectancy calculator.
Using this when you claim Social Security
Life expectancy also drives one of the biggest retirement decisions: when to claim Social Security. Delaying raises your monthly check for life, so the longer you live, the more delaying pays. At 67 the SSA table gives a man 16.7 more years and a woman 19.1, and the odds above show that a long life is common, not rare. The Social Security breakeven calculator shows the age at which waiting starts to come out ahead.
These figures aren't the same as the IRS life expectancy tables used for required minimum distributions. Those are set by Treasury regulation for tax purposes, and our 2026 RMD table covers them. For an overall picture of whether your savings will last, the retirement calculator puts the horizon together with your balance, spending and returns.